Whether you're interested in learning Microsoft Excel from the bottom up or just looking to pick up a few tips and tricks, you've come to the right place. In this tutorial from everyone's favorite digital spreadsheet guru, ExcelIsFun, the nth installment in his "Highline Excel Class" series of free video Excel lessons, you'll learn how to do basic statistical analysis in Excel. Specifically, this video covers the following topics:

If you use Microsoft Excel on a regular basis, odds are you work with numbers. Put those numbers to work. Statistical analysis allows you to find patterns, trends and probabilities within your data. In this MS Excel tutorial from everyone's favorite Excel guru, YouTube's ExcelsFun, the 17th installment in his "Excel Statistics" series of free video lessons, you'll learn how to cross tabulate & do percentage cross tabulation for categorical data using formulas rather than pivot tables.
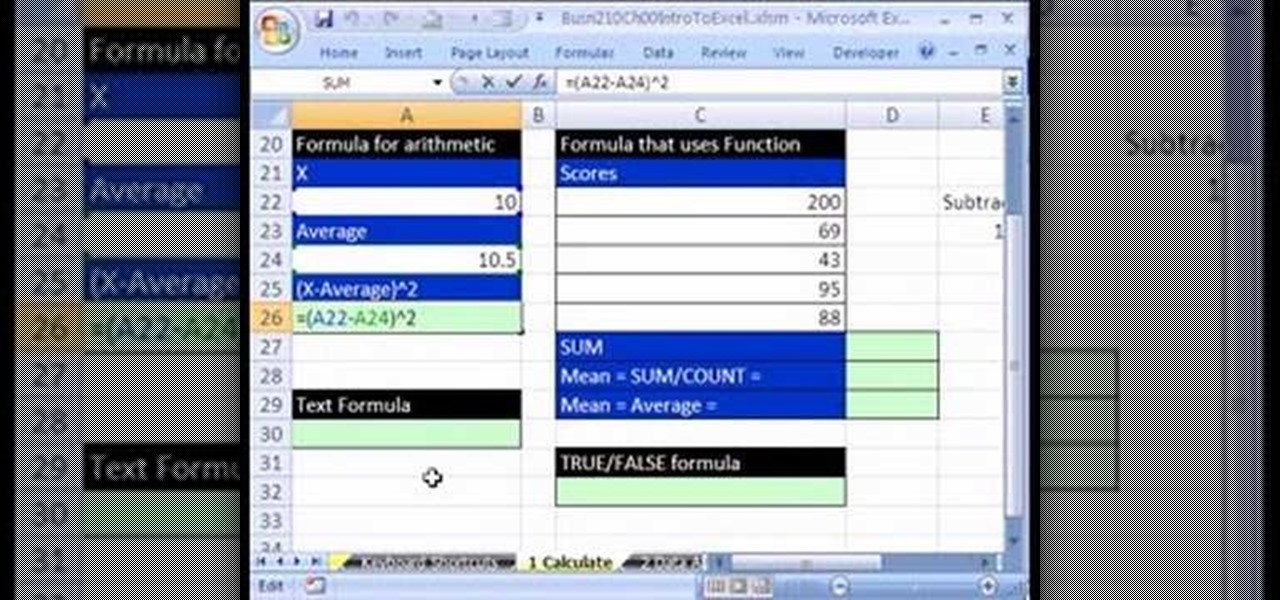
If you use Microsoft Excel on a regular basis, odds are you work with numbers. Put those numbers to work. Statistical analysis allows you to find patterns, trends and probabilities within your data. In this MS Excel tutorial from everyone's favorite Excel guru, YouTube's ExcelsFun, the 2nd installment in his "Excel Statistics" series of free video lessons, you'll learn how to make calculations in Excel using formulas and cell references. Learn about the different Excel Math operators and func...

If you use Microsoft Excel on a regular basis, odds are you work with numbers. Put those numbers to work. Statistical analysis allows you to find patterns, trends and probabilities within your data. In this MS Excel tutorial from everyone's favorite Excel guru, YouTube's ExcelsFun, the 86th installment in his "Excel Statistics" series of free video lessons, you'll learn how to construct confidence intervals for proportions using NORMSINV function and other formulas.

If you use Microsoft Excel on a regular basis, odds are you work with numbers. Put those numbers to work. Statistical analysis allows you to find patterns, trends and probabilities within your data. In this MS Excel tutorial from everyone's favorite Excel guru, YouTube's ExcelsFun, the 19th installment in his "Excel Statistics" series of free video lessons, you'll learn how to group categories in a frequency distribution with a formula (2 COUNTIF) and the pivot table (PivotTable) grouping fea...

If you use Microsoft Excel on a regular basis, odds are you work with numbers. Put those numbers to work. Statistical analysis allows you to find patterns, trends and probabilities within your data. In this MS Excel tutorial from everyone's favorite Excel guru, YouTube's ExcelsFun, the 21st installment in his "Excel Statistics" series of free video lessons, you'll learn how to build labels and counting formulas for a frequency distribution.

If you use Microsoft Excel on a regular basis, odds are you work with numbers. Put those numbers to work. Statistical analysis allows you to find patterns, trends and probabilities within your data. In this MS Excel tutorial from everyone's favorite Excel guru, YouTube's ExcelsFun, the 5th installment in his "Excel Statistics" series of free video lessons, you'll learn how to use relative and absolute cell references to save time when writing formulas.
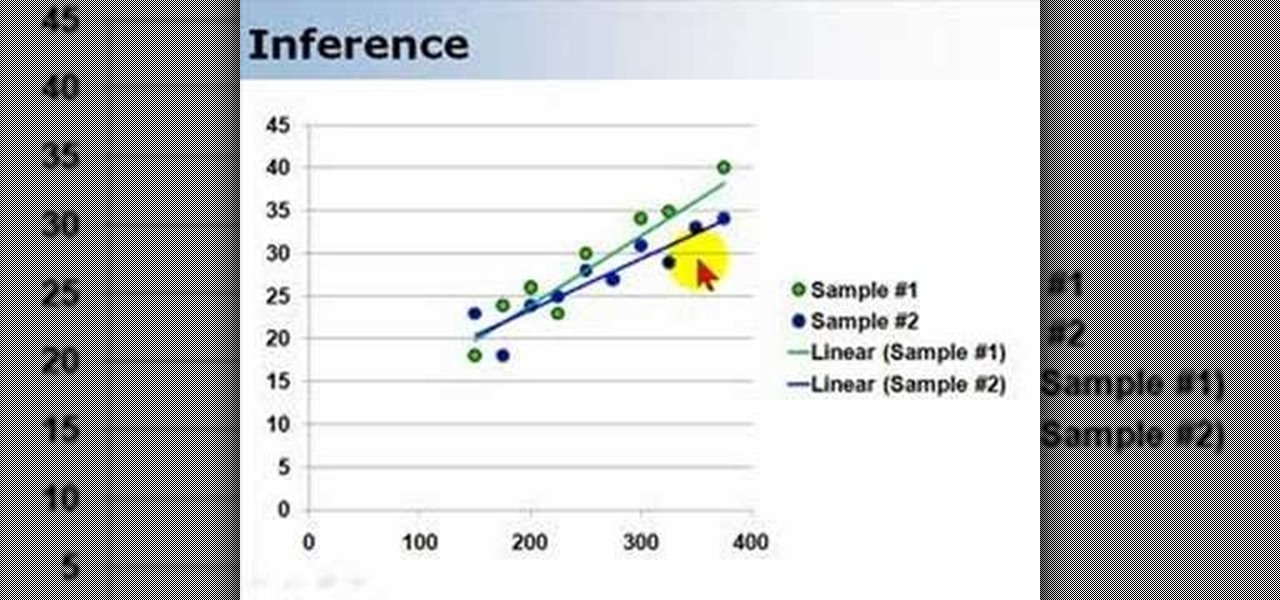
Regression functions are a vital part of statistical analysis of populations, and if you're involved in business, science, or nearly any academic field you should understand how it works. This series of videos will show you how standard regression functions, ANOVA, ordinary least squares, and everything else you need to know.
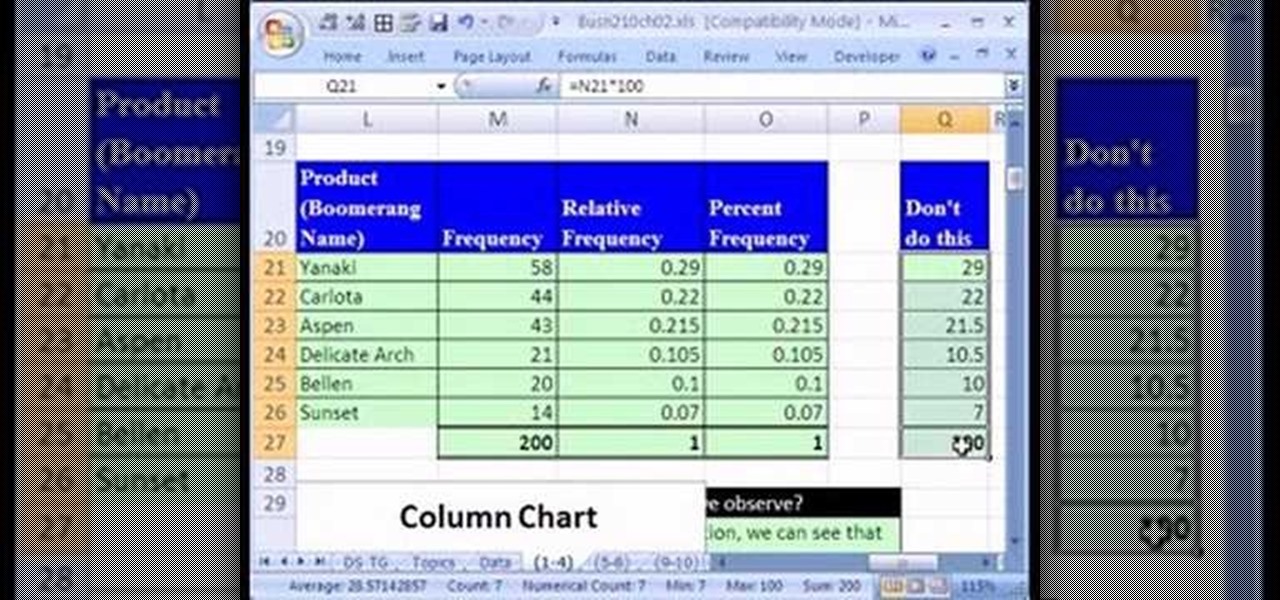
If you use Microsoft Excel on a regular basis, odds are you work with numbers. Put those numbers to work. Statistical analysis allows you to find patterns, trends and probabilities within your data. In this MS Excel tutorial from everyone's favorite Excel guru, YouTube's ExcelsFun, the 14th installment in his "Excel Statistics" series of free video lessons, you'll learn how to create relative & percent & frequency distributions with formulas for categorical data. See, too, how to create a per...
If you use Microsoft Excel on a regular basis, odds are you work with numbers. Put those numbers to work. Statistical analysis allows you to find patterns, trends and probabilities within your data. In this MS Excel tutorial from everyone's favorite Excel guru, YouTube's ExcelsFun, the 85th installment in his "Excel Statistics" series of free video lessons, you'll learn how to construct confidence intervals for proportions using NORMSINV function and other formulas.
If you use Microsoft Excel on a regular basis, odds are you work with numbers. Put those numbers to work. Statistical analysis allows you to find patterns, trends and probabilities within your data. In this MS Excel tutorial from everyone's favorite Excel guru, YouTube's ExcelsFun, the 22nd installment in his "Excel Statistics" series of free video lessons, you'll learn how to create a percent (%) cumulative frequency distribution with formulas, a histogram and an ogive chart. See how to add ...
From Ramanujan to calculus co-creator Gottfried Leibniz, many of the world's best and brightest mathematical minds have belonged to autodidacts. And, thanks to the Internet, it's easier than ever to follow in their footsteps (or just finish your homework or study for that next big test). With this installment from Internet pedagogical superstar Salman Khan's series of free math tutorials, you'll learn how to unpack and solve word problems involving events and outcomes.
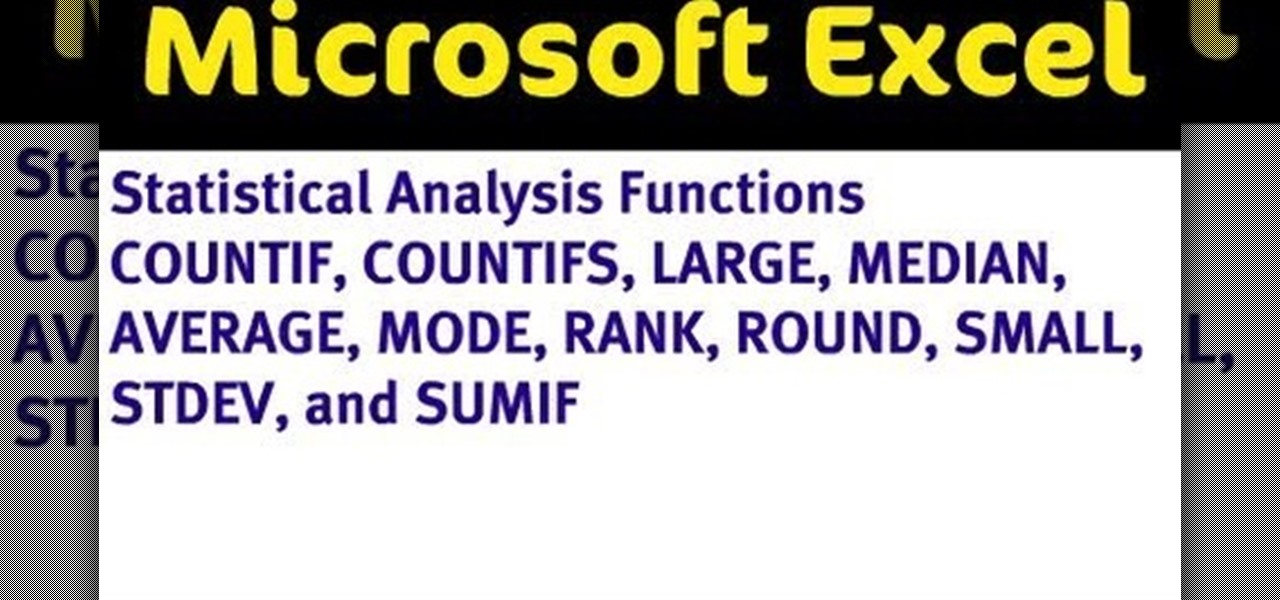
If you use Microsoft Office Excel on anything resembling a regular basis, odds are you work with numbers. Put those numbers to work with this free MS Excel video tutorial, which will teach you how to use a number of Excel's basic statistical functions (e.g., STDEV, AVERAGE, MEDIAN, MODE, RANK, ROUND, LARGE & SMALL).
If you use Microsoft Excel on a regular basis, odds are you work with numbers. Put those numbers to work. Statistical analysis allows you to find patterns, trends and probabilities within your data. In this MS Excel tutorial from everyone's favorite Excel guru, YouTube's ExcelsFun, the 89th installment in his "Excel Statistics" series of free video lessons, you'll learn how to use the NORMSINV function for critical values and the NORSDIST function for p-values.
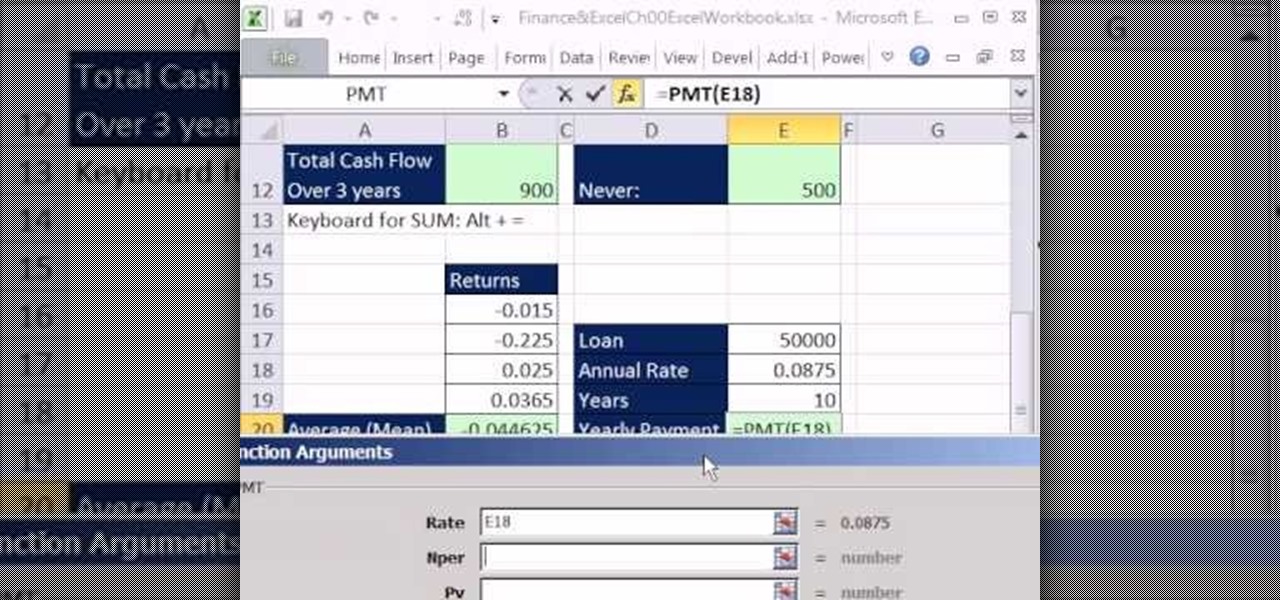
Excel 2008 for Mac makes it easy to create formulas for cells. You could always do it before, but now with the new Formula Builder feature, building formulas just got one step closer to simple. The Microsoft Office for Mac team shows you just how to build formulas by using the new Formula Builder in this how-to video.
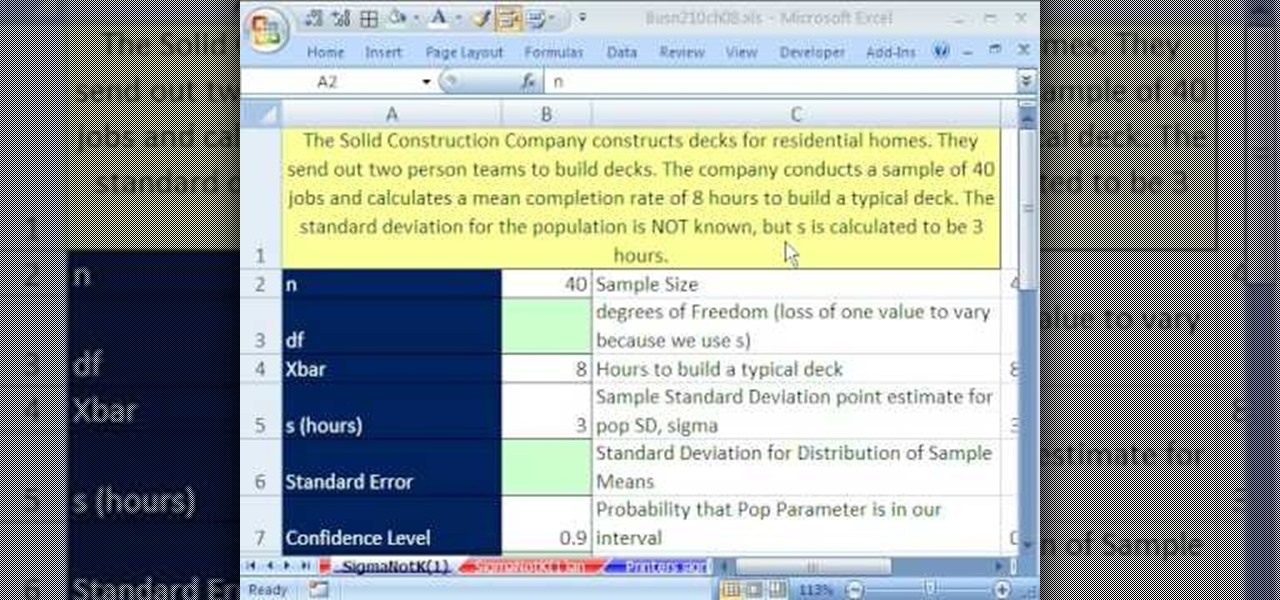
If you use Microsoft Excel on a regular basis, odds are you work with numbers. Put those numbers to work. Statistical analysis allows you to find patterns, trends and probabilities within your data. In this MS Excel tutorial from everyone's favorite Excel guru, YouTube's ExcelsFun, the 82nd installment in his "Excel Statistics" series of free video lessons, you'll learn how to construct confidence intervals when the sigma value (the population's standard deviation) in NOT Known using the TINV...
If you use Microsoft Excel on a regular basis, odds are you work with numbers. Put those numbers to work. Statistical analysis allows you to find patterns, trends and probabilities within your data. In this MS Excel tutorial from everyone's favorite Excel guru, YouTube's ExcelsFun, the very first installment in his "Excel Statistics" series of free video lessons, you'll learn how to get started doing statistical analysis in Microsoft Excel 2007.
Check out this informative video tutorial from Apple on how to create formulas with Quick Formula in Numbers '09.
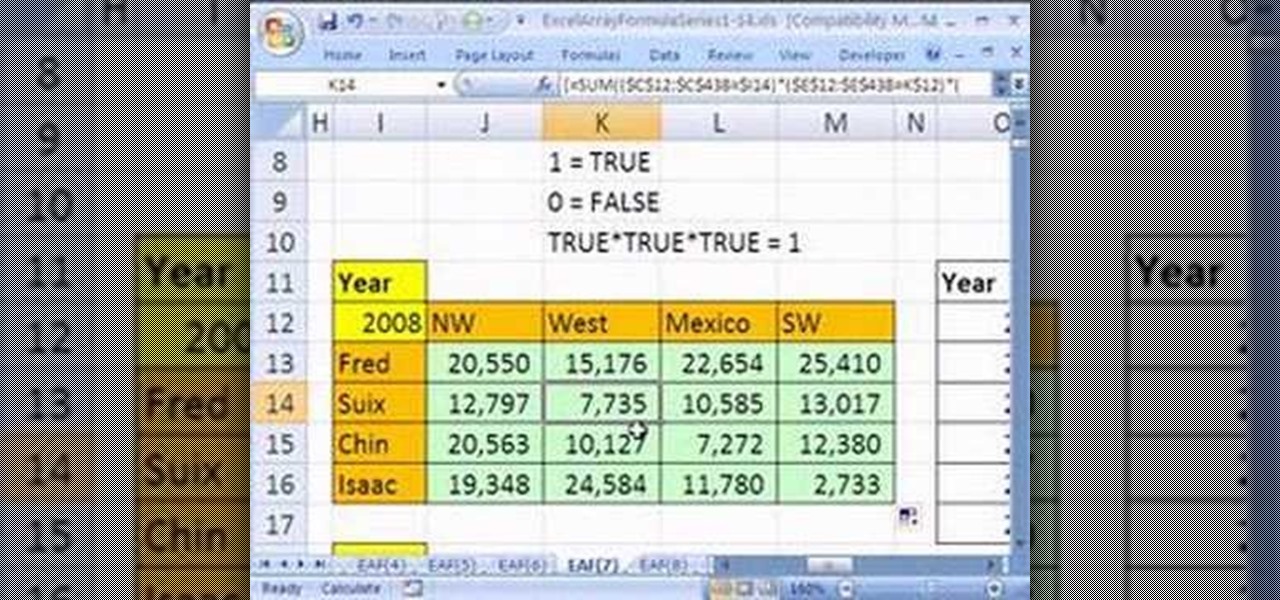
Looking for a primer on how to create and work with array formulas in Microsoft Office Excel? You've come to the right place. In this free video tutorial from everyone's favorite MS Excel guru, YouTube's ExcelIsFun, the 7th installment in his series of Excel array formula series, you'll learn how to create array formulas for summing and counting when there are multiple conditions. See how to use Boolean logic and array formulas to calculate when there are multiple conditions.
Whether you're interested in learning Microsoft Excel from the bottom up or just looking to pick up a few tips and tricks, you've come to the right place. In this tutorial from everyone's favorite digital spreadsheet guru, ExcelIsFun, the 36th installment in his "Highline Excel Class" series of free video Excel lessons, you'll learn most everything there is to know about working with array formulas in Microsoft Excel.
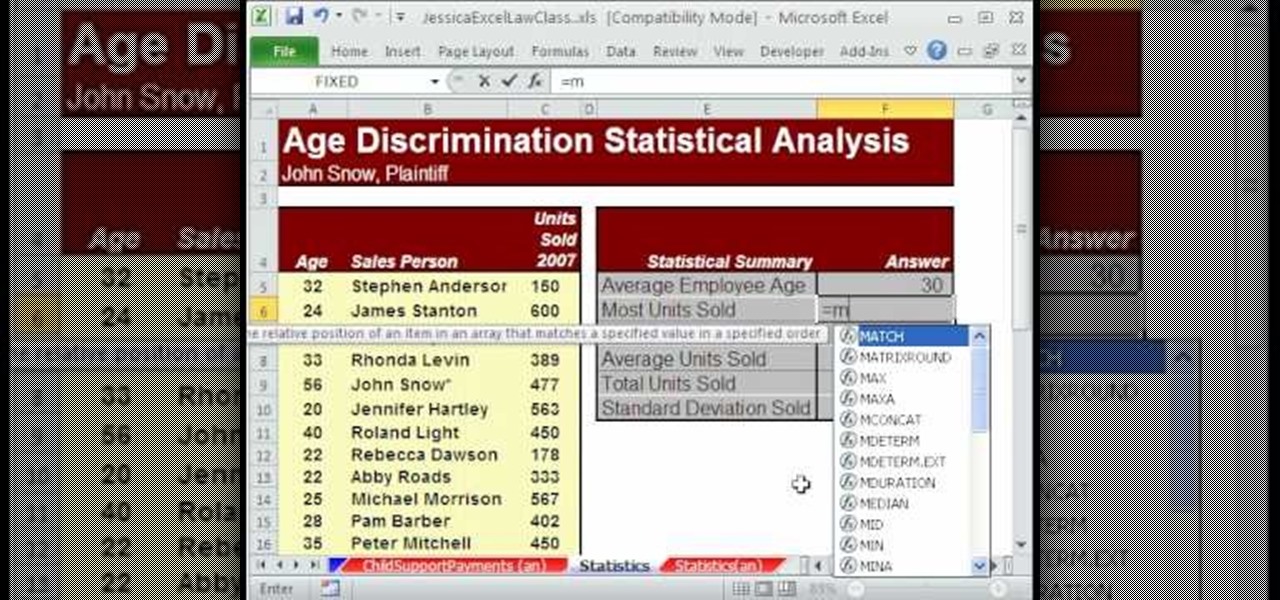
New to Microsoft Excel? Looking for a tip? How about a tip so mind-blowingly useful as to qualify as a magic trick? You're in luck. In this MS Excel tutorial from ExcelIsFun, the 532nd installment in their series of digital spreadsheet magic tricks, you'll learn how to use the AVERAGE, STDEV, MAX, MIN and SUM function to add statistical data. Specifically, this video lesson discusses how to sum and average evidence in an age discrimination case.
If you have a circular or semicircular protractor like the one used in this video, making a pie chart is as easy as – well — pie. This will teach you how to use your protractor to measure out each individual slice in your pie chart. Learn how to visualize statistical data through hand-drawn pie charts with this free video math lesson.
In this how to video, you will learn how to find the volume of a sphere and surface area. Let's say you need to find the volume of a sphere with a surface area of 200 cm cubed. You will need to know the formulas for surface area and volume of a sphere. The formula for surface area is 4 pi r squared. The formula for volume is 4/3 pi r cubed. Plug in the surface area of 200 cm cubed and plug it into the formula. You should get an answer of about 3.99 cm. Now you just have to solve for the radiu...
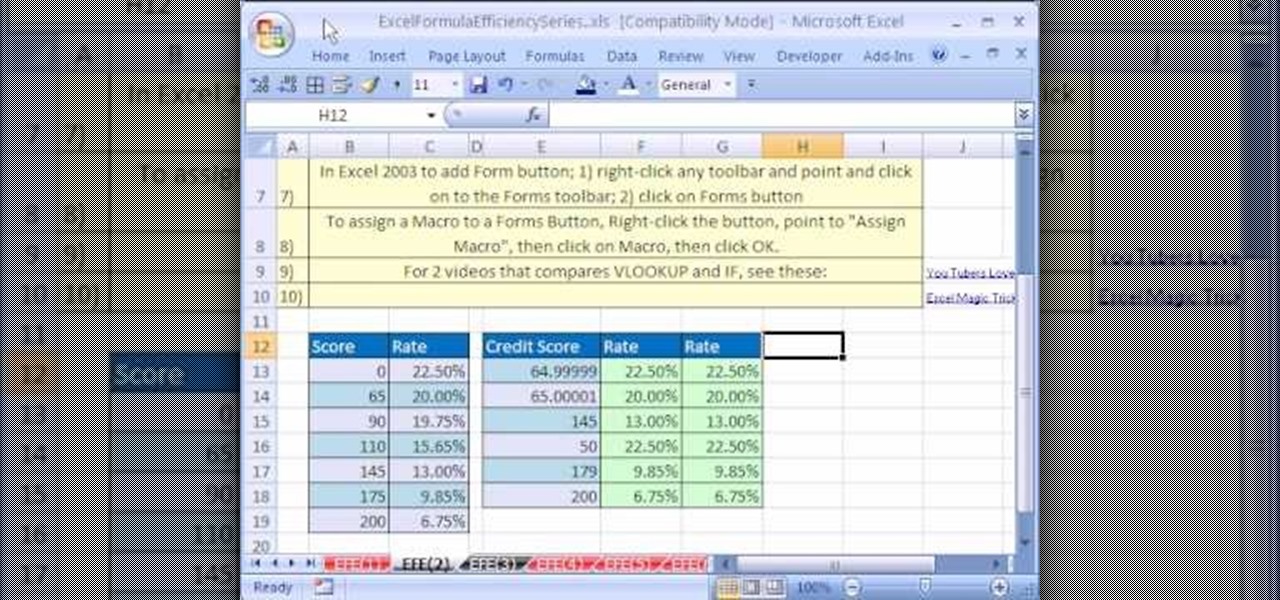
Are you looking for a way to make your Microsoft Excel formulas simpler, faster and more efficient? If so, you're in the right place. With this free video lesson from everyone's favorite digital spreadsheet guru, YouTube's ExcelsFun, the 2nd installment in his "Excel Formula Efficiency" series, you'll learn how to compare alternative formulas to see which is faster.
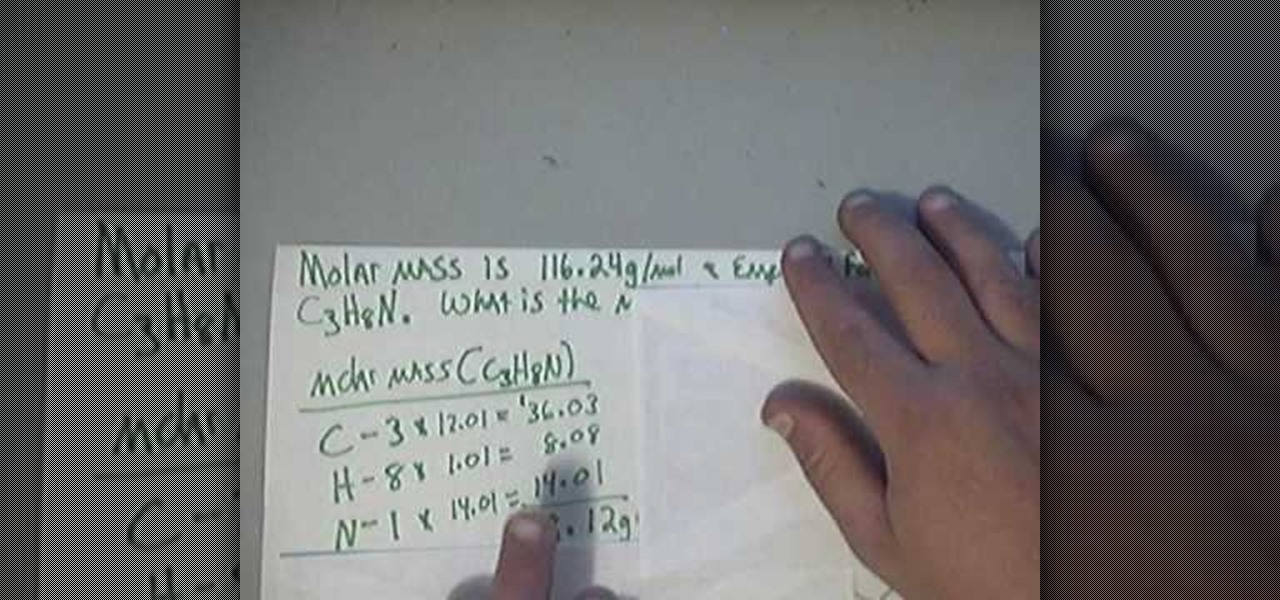
The man was requested to solve a short, basic chemistry exercise. He starts by explaining the meaning of the terms involved in the problem: molecular mass, empirical formula and molecular formula. He also explains the way the are connected, for a better understanding of the way the exercise is solved.
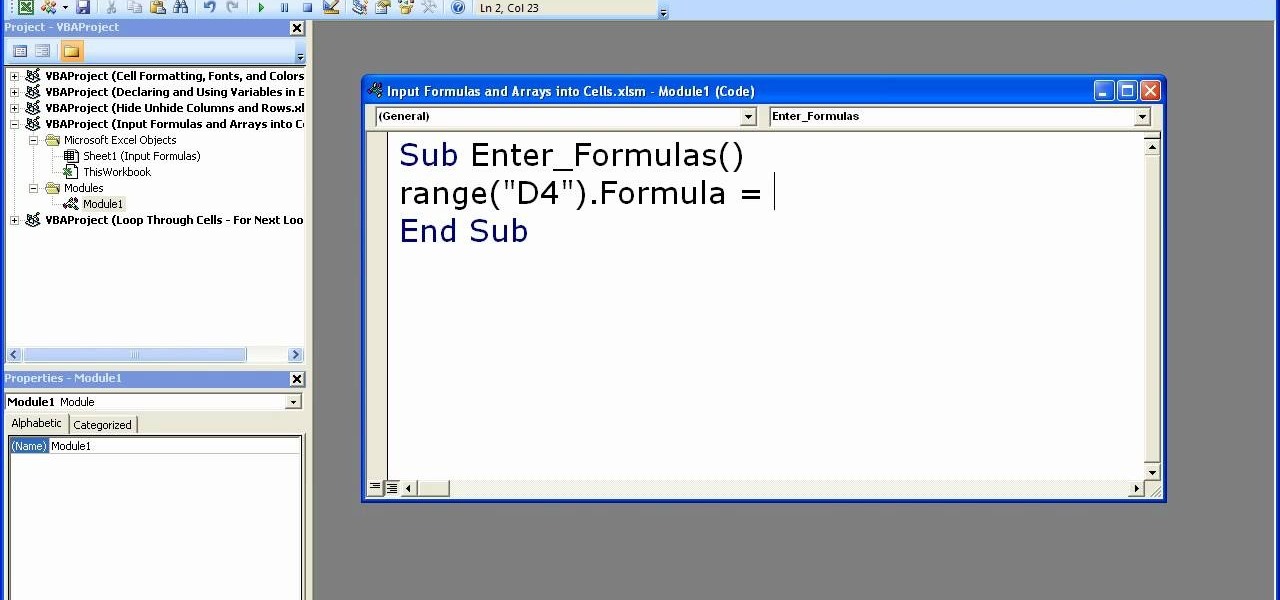
In order to enter formulas in Excels with a macro, you will need to open your spreadsheet. Formulas are used to do calculations. Go to the field, where you want to enter a formula. Type in the formula. Then, highlight the formula. Press Control + C to copy the formula. Next, delete the contents of the cell. Press Alt + F11.
This tutorial aimed at someone new to Microsoft Excel shows you how to navigate the basic functions of a spreadsheet. It goes over formulas, functions, formula inputs and cell references, all of which you'll need to master in order to use Excel effectively.
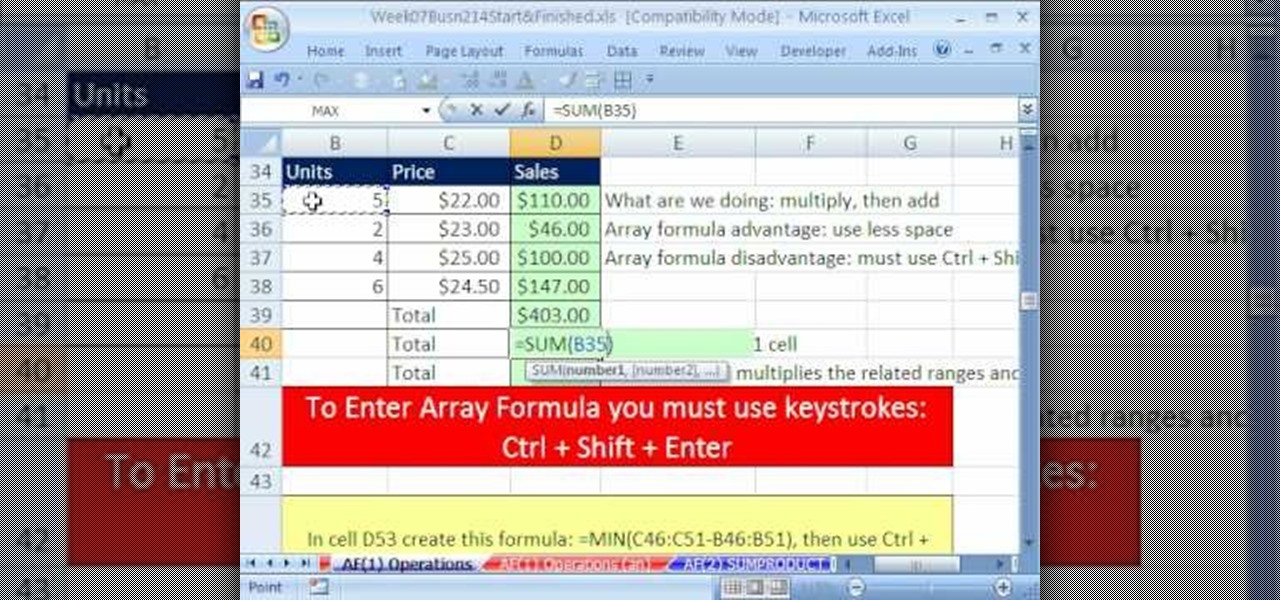
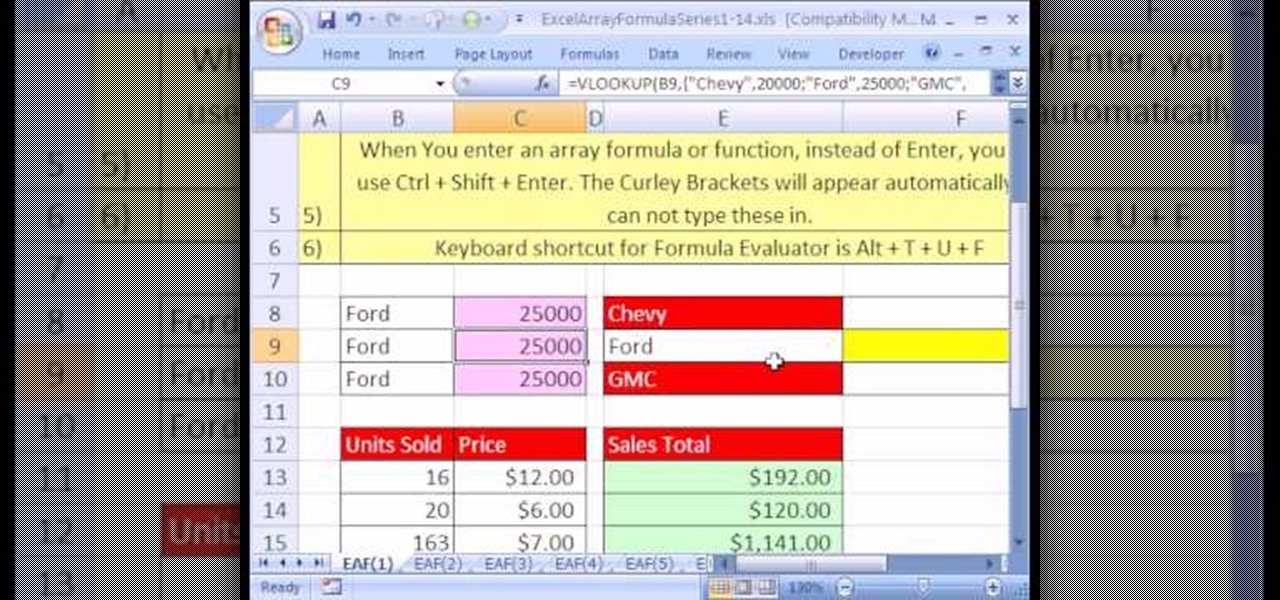
Looking for a primer on how to create and work with arrays in Microsoft Office Excel? You've come to the right place. In this free video tutorial from everyone's favorite MS Excel guru, YouTube's ExcelIsFun, the very first installment in his series of Excel array formula series, you'll learn how to create a basic array formula. Learn about the syntax, the Ctrl + Shift + Enter method of formula entry and the curly brackets that get entered automatically by Excel.
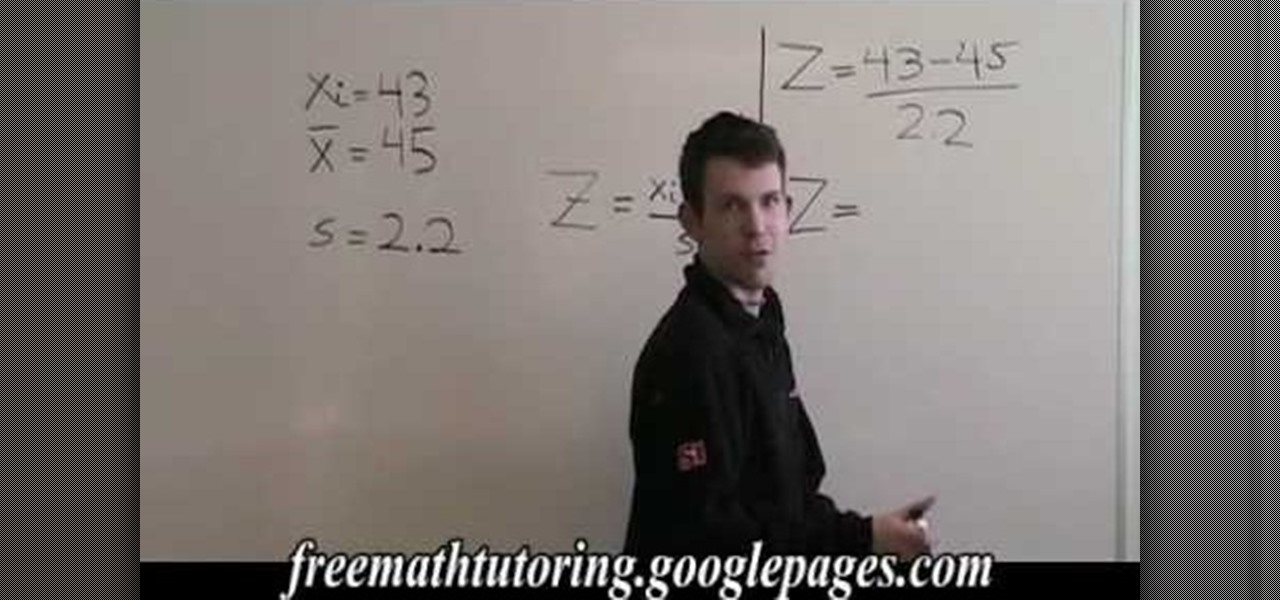
In this video tutorial the instructor shows how to find Z with the Z-Score formula. He uses a sample problem to show how to find this. He tells you the formula for z which is a real simple formula. Now he notes down the formula on the board and brings in the example problem with sample values. He substitutes the values in the z-score formula and solves it finding out the z value. This video shows how to find z using the z-score formula and also demonstrates the formula using a simple example.
In this clip, you'll learn how to view graphs of statistical data from around the world with Gapminder.com. The website, you'll find, is diverting, often thought-provoking, and easy to use. For more information, including detailed instructions on how to use the site yourself, watch this video tutorial from the folks at Tekzilla.
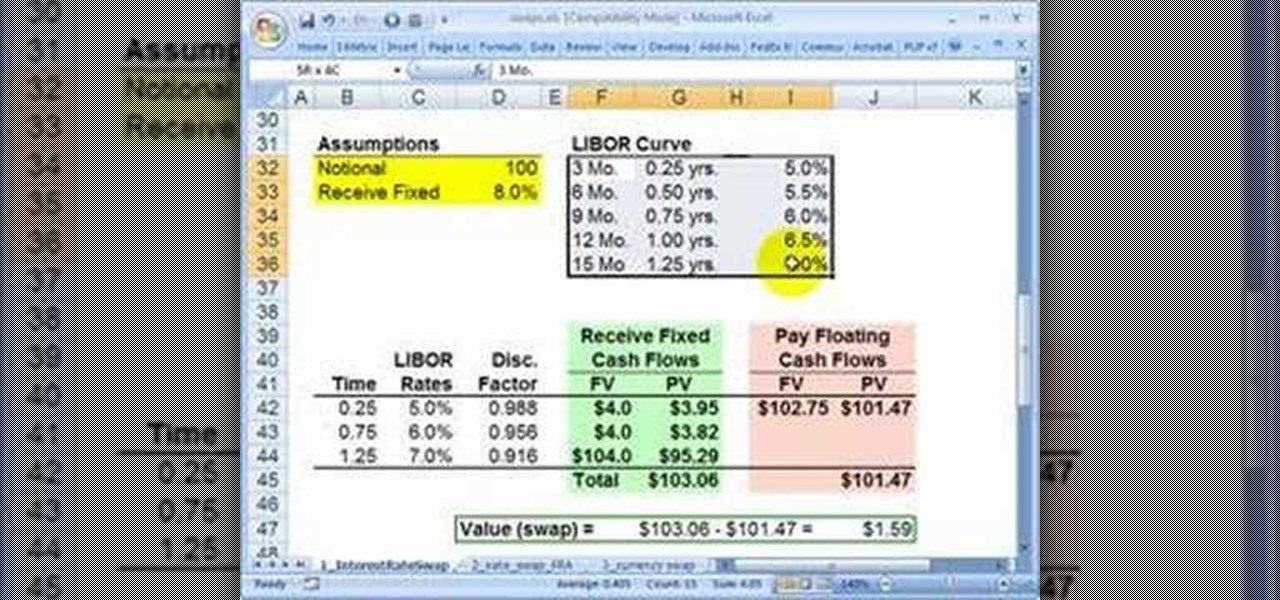
High finance and statistical analysis are too complex for most people once they forget what they learned in high school. If you are an investor or small business owner, you can't afford to forget this stuff. This video will teach you how to value an interest rate swap, good info for financial professionals and students.
If you use Microsoft Excel on a regular basis, odds are you work with numbers. Put those numbers to work. Statistical analysis allows you to find patterns, trends and probabilities within your data. In this MS Excel tutorial from everyone's favorite Excel guru, YouTube's ExcelsFun, the 45th installment in his "Excel Statistics" series of free video lessons, you'll learn how to see how to calculate a z-score.
If you use Microsoft Excel on a regular basis, odds are you work with numbers. Put those numbers to work. Statistical analysis allows you to find patterns, trends and probabilities within your data. In this MS Excel tutorial from everyone's favorite Excel guru, YouTube's ExcelsFun, the 35.2nd installment in his "Excel Statistics" series of free video lessons, you'll learn how to use Excel's GEOMEAN function to find geometric mean.
If you use Microsoft Excel on a regular basis, odds are you work with numbers. Put those numbers to work. Statistical analysis allows you to find patterns, trends and probabilities within your data. In this MS Excel tutorial from everyone's favorite Excel guru, YouTube's ExcelsFun, the 40th installment in his "Excel Statistics" series of free video lessons, you'll learn how to calculate range & interquartile range for variability using the MAX, MIN, QUARTILE functions.
If you use Microsoft Excel on a regular basis, odds are you work with numbers. Put those numbers to work. Statistical analysis allows you to find patterns, trends and probabilities within your data. In this MS Excel tutorial from everyone's favorite Excel guru, YouTube's ExcelsFun, the 87th installment in his "Excel Statistics" series of free video lessons, you'll learn how to calculate sample size (n) for confidence intervals.
If you use Microsoft Excel on a regular basis, odds are you work with numbers. Put those numbers to work. Statistical analysis allows you to find patterns, trends and probabilities within your data. In this MS Excel tutorial from everyone's favorite Excel guru, YouTube's ExcelsFun, the 27th installment in his "Excel Statistics" series of free video lessons, you'll learn how to create a quantitative data dot plot chart using the REPT and COUNTIF functions.
If you use Microsoft Excel on a regular basis, odds are you work with numbers. Put those numbers to work. Statistical analysis allows you to find patterns, trends and probabilities within your data. In this MS Excel tutorial from everyone's favorite Excel guru, YouTube's ExcelsFun, the 26th installment in his "Excel Statistics" series of free video lessons, you'll learn how to create quantitative data cumulative frequency distributions with pivot tables.
If you use Microsoft Excel on a regular basis, odds are you work with numbers. Put those numbers to work. Statistical analysis allows you to find patterns, trends and probabilities within your data. In this MS Excel tutorial from everyone's favorite Excel guru, YouTube's ExcelsFun, the 16th installment in his "Excel Statistics" series of free video lessons, you'll learn how to cross tabulate & do percentage cross tabulation for categorical data using a pivot table (PivotTable).
If you use Microsoft Excel on a regular basis, odds are you work with numbers. Put those numbers to work. Statistical analysis allows you to find patterns, trends and probabilities within your data. In this MS Excel tutorial from everyone's favorite Excel guru, YouTube's ExcelsFun, the 3rd installment in his "Excel Statistics" series of free video lessons, you'll learn how to use Excel's sorting and pivot tables (PivotTables) data analysis tools.
If you use Microsoft Excel on a regular basis, odds are you work with numbers. Put those numbers to work. Statistical analysis allows you to find patterns, trends and probabilities within your data. In this MS Excel tutorial from everyone's favorite Excel guru, YouTube's ExcelsFun, the 35th installment in his "Excel Statistics" series of free video lessons, you'll learn how to calculate weighted and geometric means and see how to use the GEOMEAN function.