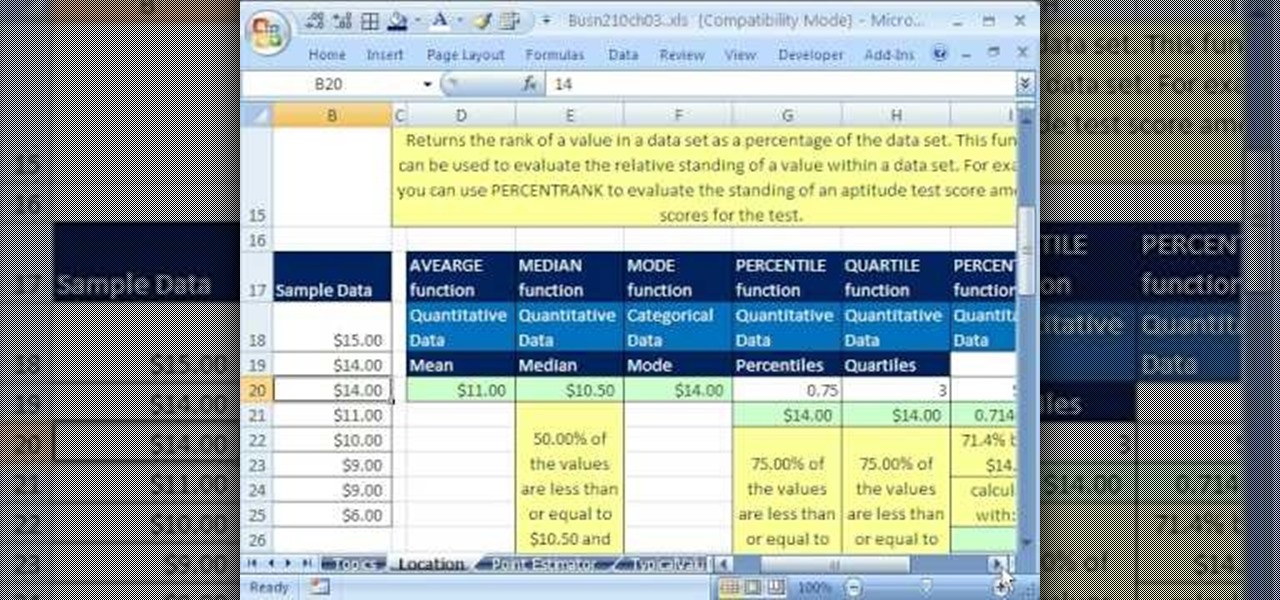
If you use Microsoft Excel on a regular basis, odds are you work with numbers. Put those numbers to work. Statistical analysis allows you to find patterns, trends and probabilities within your data. In this MS Excel tutorial from everyone's favorite Excel guru, YouTube's ExcelsFun, the 33rd installment in his "Excel Statistics" series of free video lessons, you'll learn how to use the AVEARGE, MEDIAN, MODE, PERCENTILE, QUARTILE and PERCENTILERANK functions to measure location.

If you use Microsoft Excel on a regular basis, odds are you work with numbers. Put those numbers to work. Statistical analysis allows you to find patterns, trends and probabilities within your data. In this MS Excel tutorial from everyone's favorite Excel guru, YouTube's ExcelsFun, the 4th installment in his "Excel Statistics" series of free video lessons, you'll learn how to create a frequency table and percentage frequency table using a Pivot Table (PivotTable).
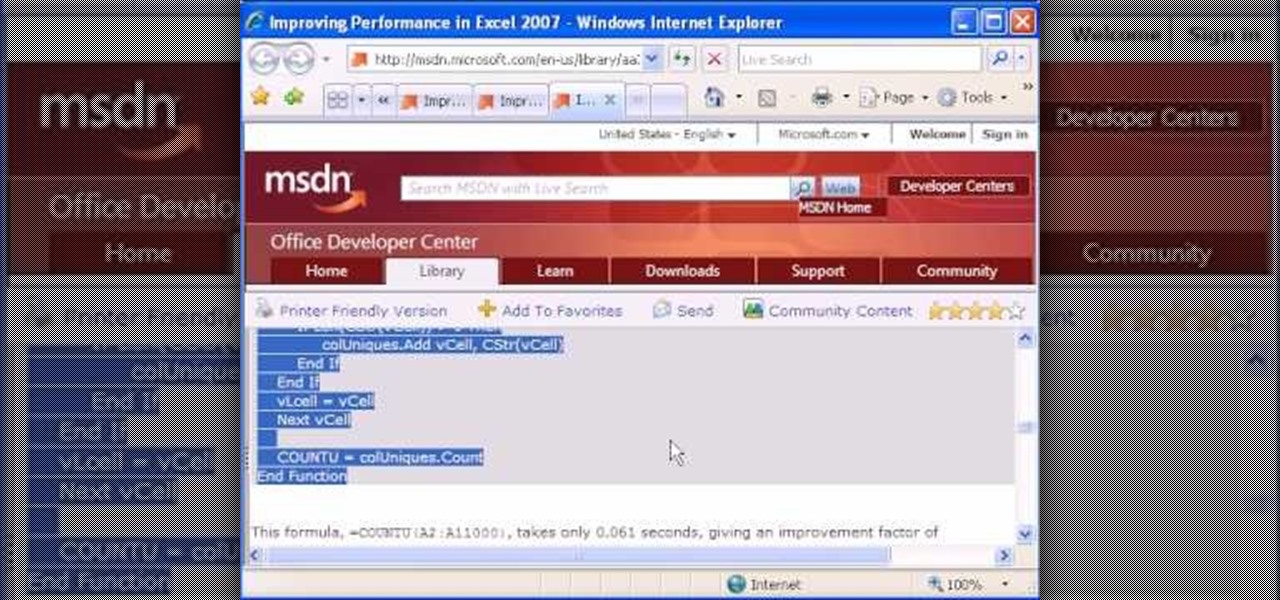
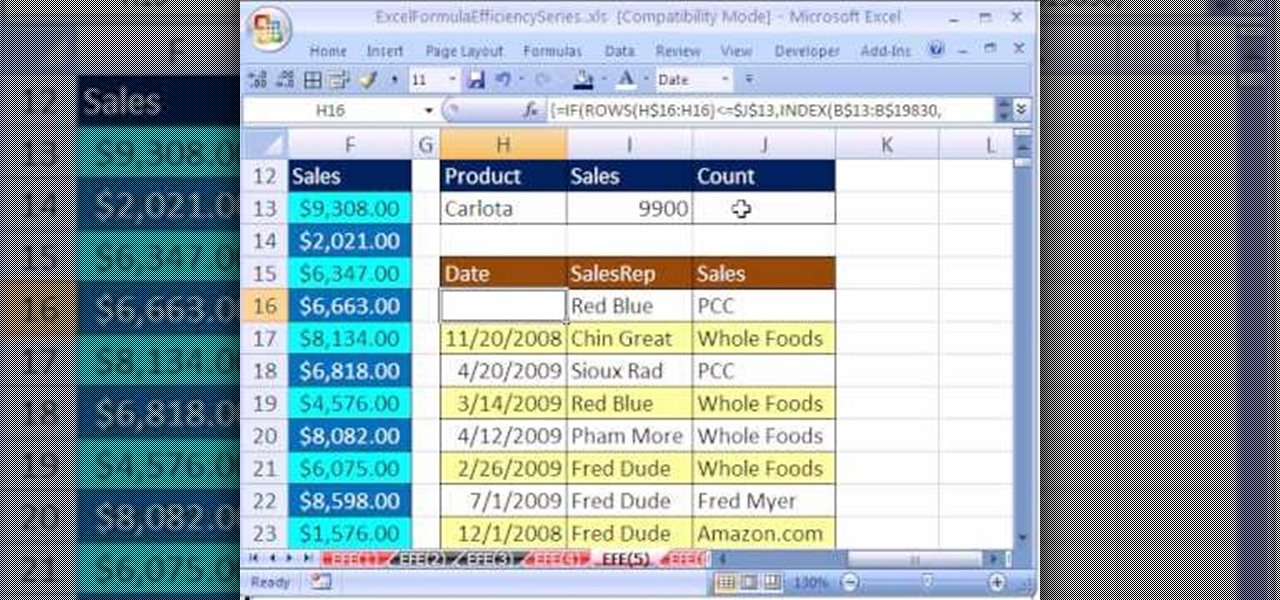
Are you looking for a way to make your Microsoft Excel formulas simpler, faster and more efficient? If so, you're in the right place. With this free video lesson from everyone's favorite digital spreadsheet guru, YouTube's ExcelsFun, the very first installment in his "Excel Formula Efficiency" series, you'll learn how a custom function (i.e., a user-defined function) can speed up calculations.
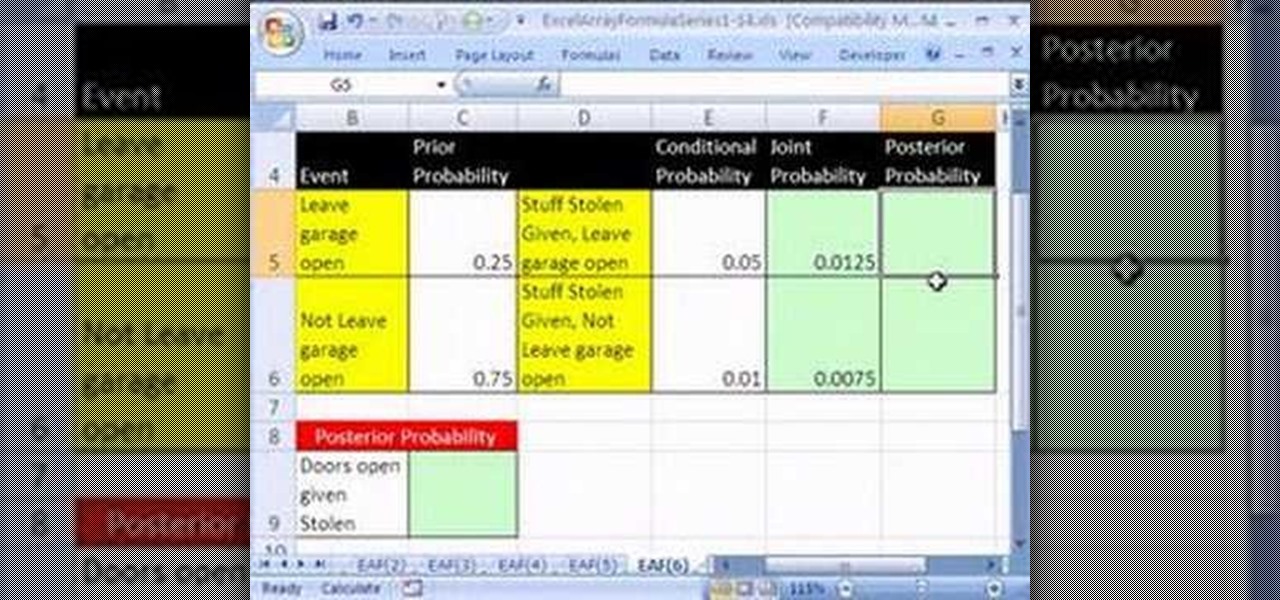
Looking for a primer on how to create and work with array formulas in Microsoft Office Excel? You've come to the right place. In this free video tutorial from everyone's favorite MS Excel guru, YouTube's ExcelIsFun, the 8th installment in his series of Excel array formula series, you'll learn how to create an array formula for Bayes' Theorem.
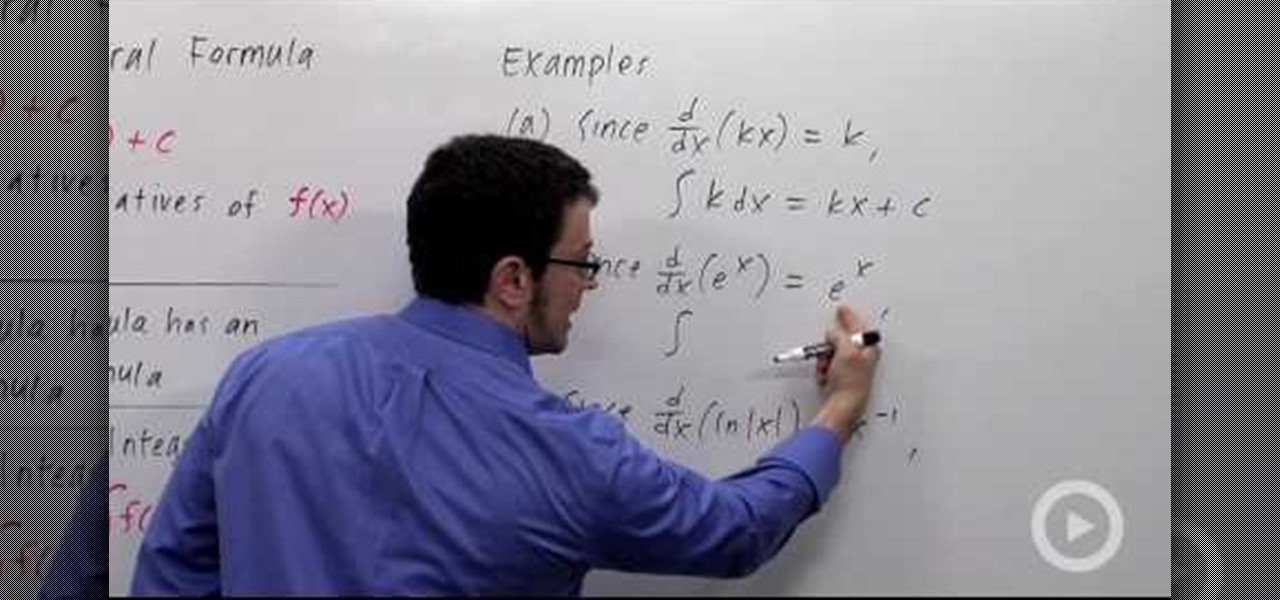
In this video the math teacher explains the meaning of the indefinite integral formula in calculus by stating it in terms of antiderivatives. He then shows in general terms how this indefinite integral formula has a related derivative formula, i.e. if the derivative of F(x) is f(x) then the indefinite integral of f(x) is F(x) plus a constant term (C). With this general relationship the teacher takes us through three related examples where he converts a derivative formula to an integral formul...
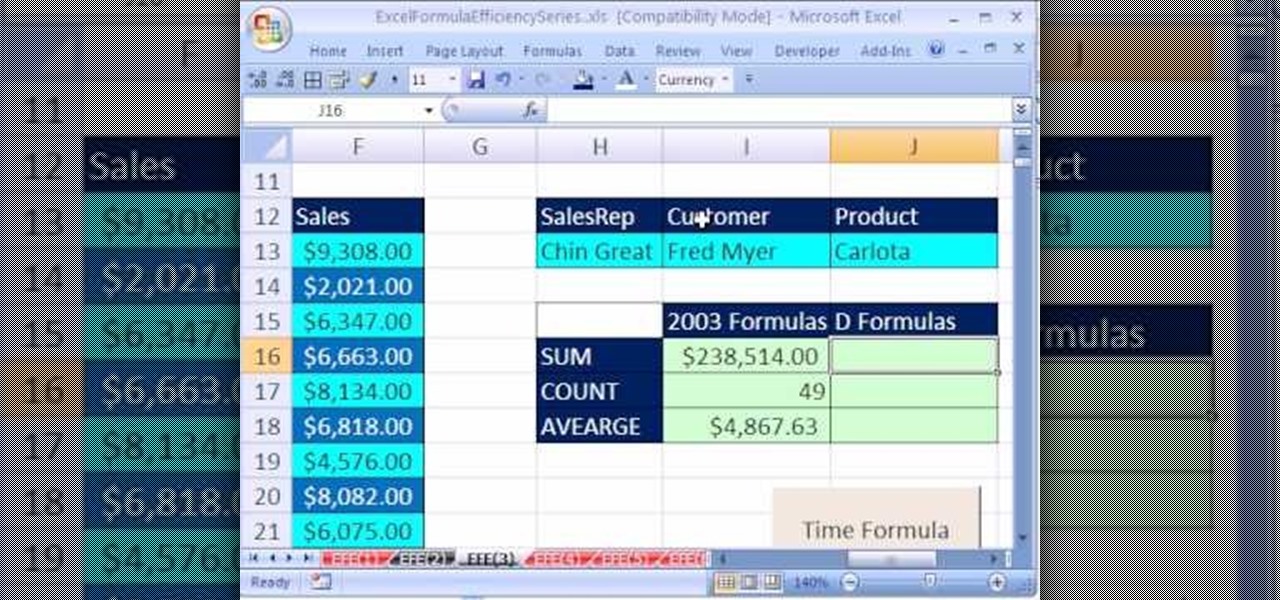
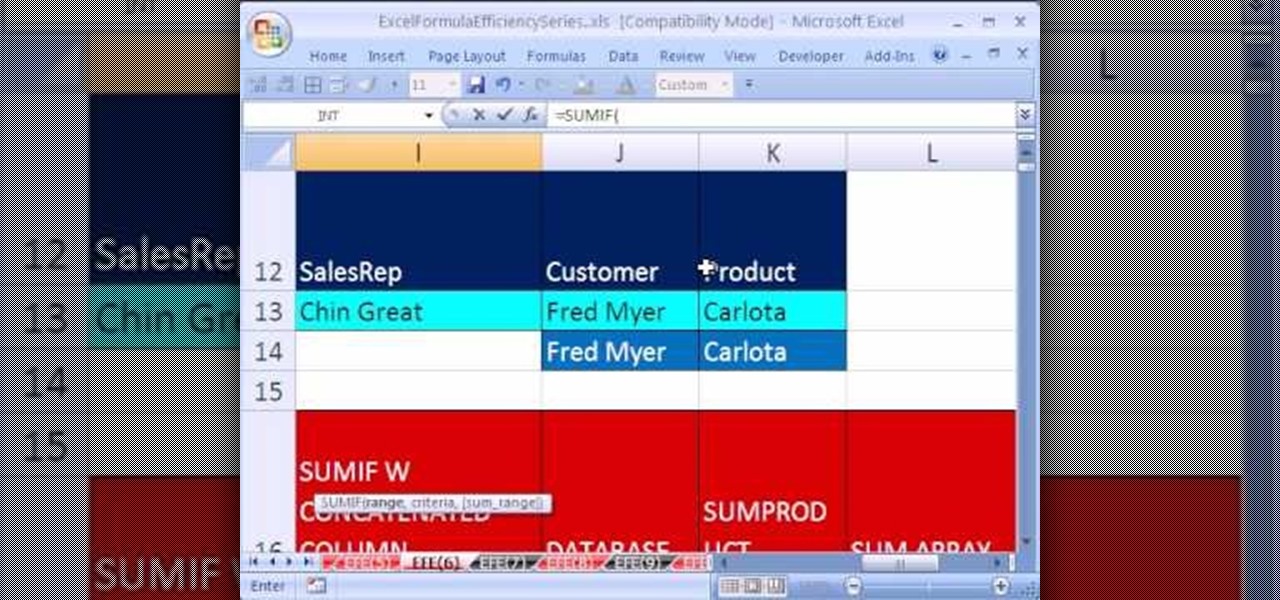
Are you looking for a way to make your Microsoft Excel formulas simpler, faster and more efficient? If so, you're in the right place. With this free video lesson from everyone's favorite digital spreadsheet guru, YouTube's ExcelsFun, the 3rd installment in his "Excel Formula Efficiency" series, you'll see how the Excel 2003, 2002, 2001, 1997 Database D functions (DSUM, DAVERAGE, DCOUNT) are much faster than SUMPRODUCT and SUM array formulas.

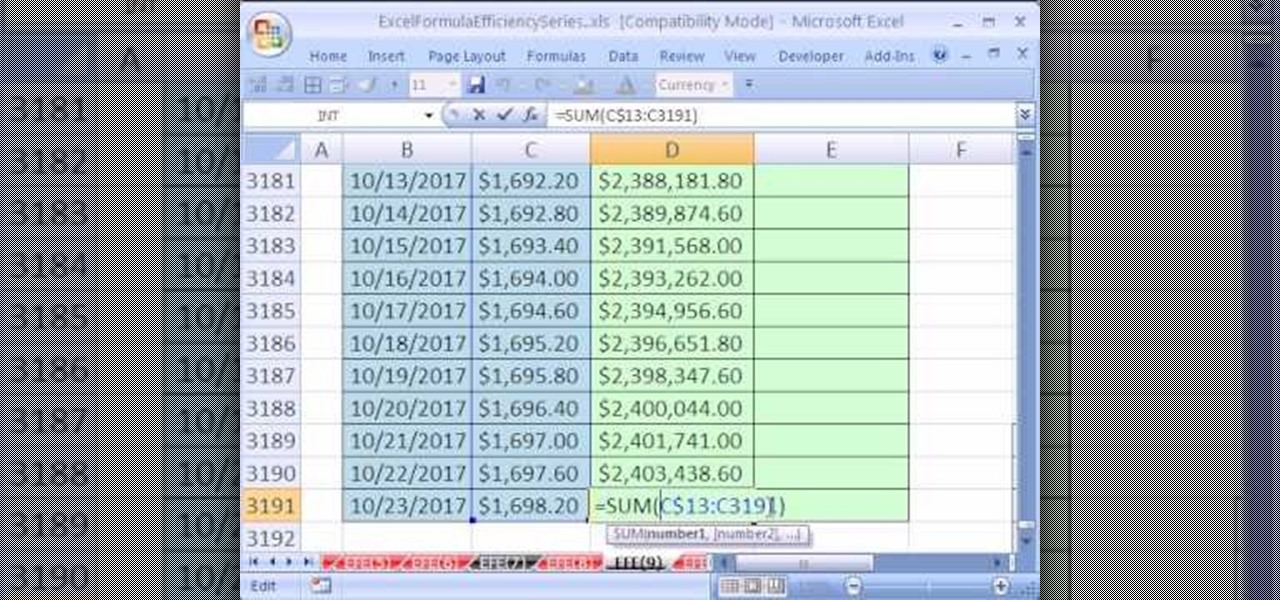
Are you looking for a way to make your Microsoft Excel formulas simpler, faster and more efficient? If so, you're in the right place. With this free video lesson from everyone's favorite digital spreadsheet guru, YouTube's ExcelsFun, the 9th installment in his "Excel Formula Efficiency" series, you'll learn see two running total formulas, one that is faster than the other.
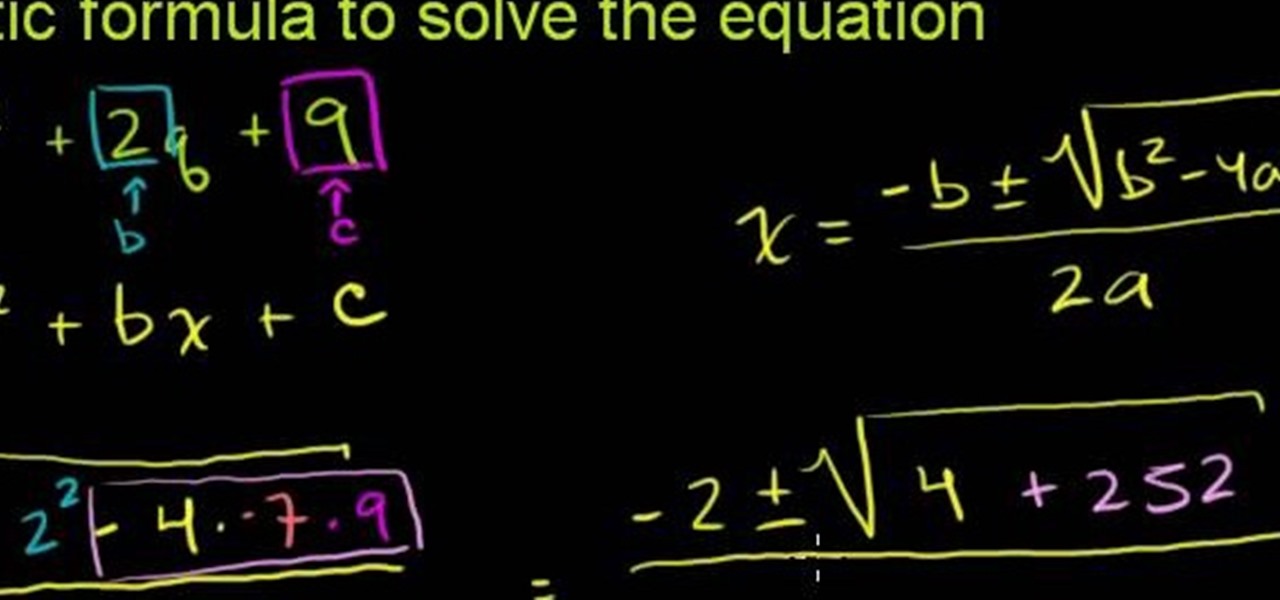
In this video the tutor shows how to simplify a quadratic formula result. You can solve a quadratic equation using the quadratic formula. The first thing you have to do when given the quadratic equation is bring all the terms to one side so that you have a zero on the other side of the equals to sign. Now the formula to calculate the roots of the quadratic equation ax*x + bx + c = 0 is x = (-b + root of(b*b - 4*a*c) ) / 2 * a. The other root can be obtained by using the minus sign before the ...
The Formula AutoComplete feature in Office Excel 2007 helps you avoid syntax or typing mistakes that can break your formula and display an error in the cell. Every step of the way, Formula AutoComplete guides you with ScreenTips that show you how to build your formula. Watch this tutorial and then try it yourself.
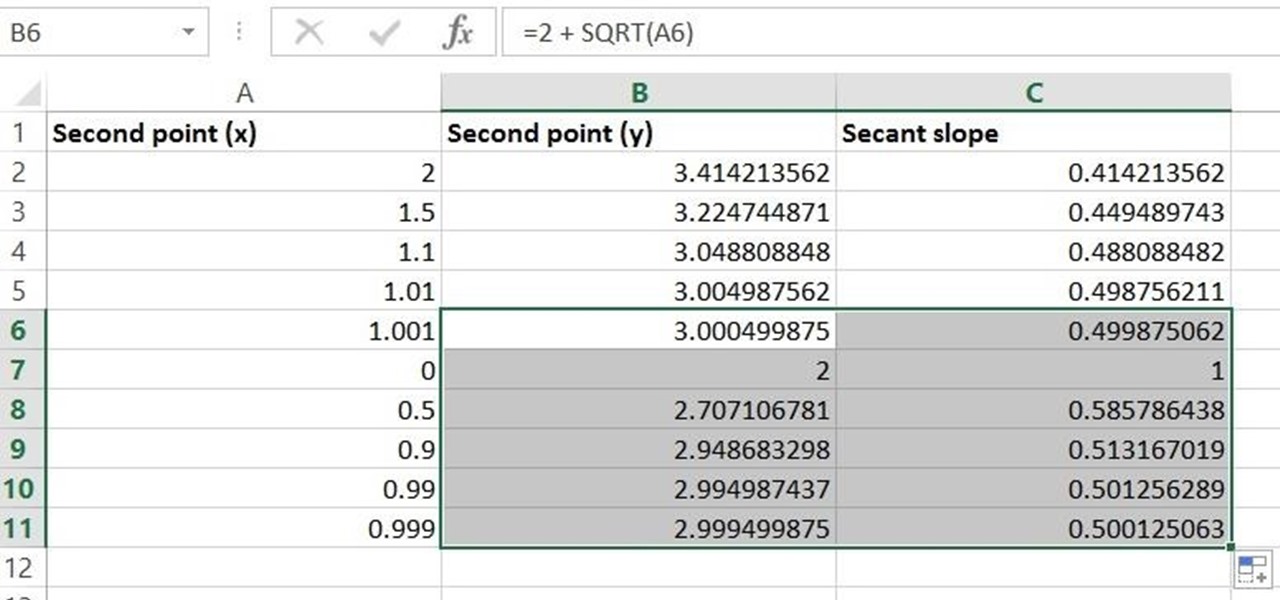
Given a function, you can easily find the slope of a tangent line using Microsoft Excel to do the dirty work. That is to say, you can input your x-value, create a couple of formulas, and have Excel calculate the secant value of the tangent slope. This is a fantastic tool for Stewart Calculus sections 2.1 and 2.2.
If you use Microsoft Excel on a regular basis, odds are you work with numbers. Put those numbers to work. Statistical analysis allows you to find patterns, trends and probabilities within your data. In this MS Excel tutorial from everyone's favorite Excel guru, YouTube's ExcelsFun, the 44th installment in his "Excel Statistics" series of free video lessons, you'll learn how to use the SKEW function to calculate the skew in a distribution of data.
f you use Microsoft Excel on a regular basis, odds are you work with numbers. Put those numbers to work. Statistical analysis allows you to find patterns, trends and probabilities within your data. In this MS Excel tutorial from everyone's favorite Excel guru, YouTube's ExcelsFun, the 37th installment in his "Excel Statistics" series of free video lessons, you'll learn how to use the PERCENTILE and QUARTILE functions.
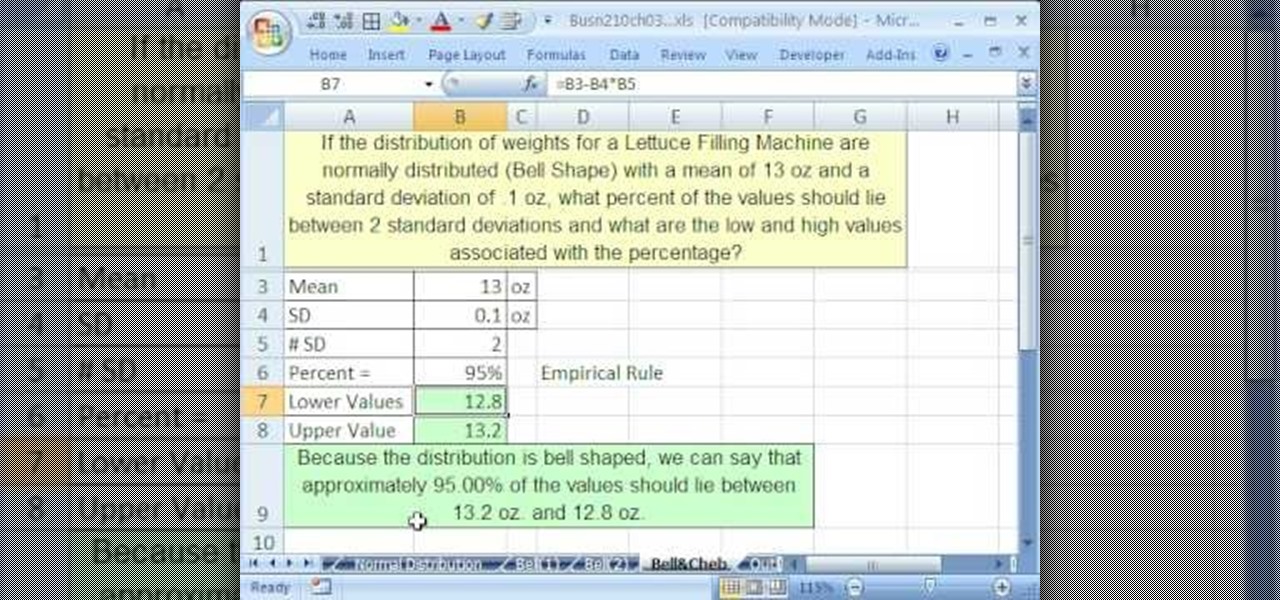
If you use Microsoft Excel on a regular basis, odds are you work with numbers. Put those numbers to work. Statistical analysis allows you to find patterns, trends and probabilities within your data. In this MS Excel tutorial from everyone's favorite Excel guru, YouTube's ExcelsFun, the 47th installment in his "Excel Statistics" series of free video lessons, you'll learn about the basics of the empirical rule (the bell curve) and how to apply it in various ways.
If you use Microsoft Excel on a regular basis, odds are you work with numbers. Put those numbers to work. Statistical analysis allows you to find patterns, trends and probabilities within your data. In this MS Excel tutorial from everyone's favorite Excel guru, YouTube's ExcelsFun, the 91st installment in his "Excel Statistics" series of free video lessons, you'll learn how to use TINV and TDIST functions to find critical values given an unknown sigma value.
If you use Microsoft Excel on a regular basis, odds are you work with numbers. Put those numbers to work. Statistical analysis allows you to find patterns, trends and probabilities within your data. In this MS Excel tutorial from everyone's favorite Excel guru, YouTube's ExcelsFun, the 80th installment in his "Excel Statistics" series of free video lessons, you'll learn how to construct confidence intervals when the sigma is known known using the CONFIDENCE and NORMSINV functions.
If you use Microsoft Excel on a regular basis, odds are you work with numbers. Put those numbers to work. Statistical analysis allows you to find patterns, trends and probabilities within your data. In this MS Excel tutorial from everyone's favorite Excel guru, YouTube's ExcelsFun, the 87th installment in his "Excel Statistics" series of free video lessons, you'll learn how to use NORMSINV to test a hypothesis with population standard deviation (sigma) known and proportions.
If you use Microsoft Excel on a regular basis, odds are you work with numbers. Put those numbers to work. Statistical analysis allows you to find patterns, trends and probabilities within your data. In this MS Excel tutorial from everyone's favorite Excel guru, YouTube's ExcelsFun, the 28th installment in his "Excel Statistics" series of free video lessons, you'll learn how to create quantitative data stem & leaf charts using the REPT and COUNTIF functions.
If you use Microsoft Excel on a regular basis, odds are you work with numbers. Put those numbers to work. Statistical analysis allows you to find patterns, trends and probabilities within your data. In this MS Excel tutorial from everyone's favorite Excel guru, YouTube's ExcelsFun, the 13th installment in his "Excel Statistics" series of free video lessons, you'll learn how to create a column chart from a frequency distribution for categorical data.
From Ramanujan to calculus co-creator Gottfried Leibniz, many of the world's best and brightest mathematical minds have belonged to autodidacts. And, thanks to the Internet, it's easier than ever to follow in their footsteps. With this installment from Internet pedagogical superstar Salman Khan's series of free math tutorials, you'll learn how to visualize statistical data with a hand-drawn stem-and-leaf chart.
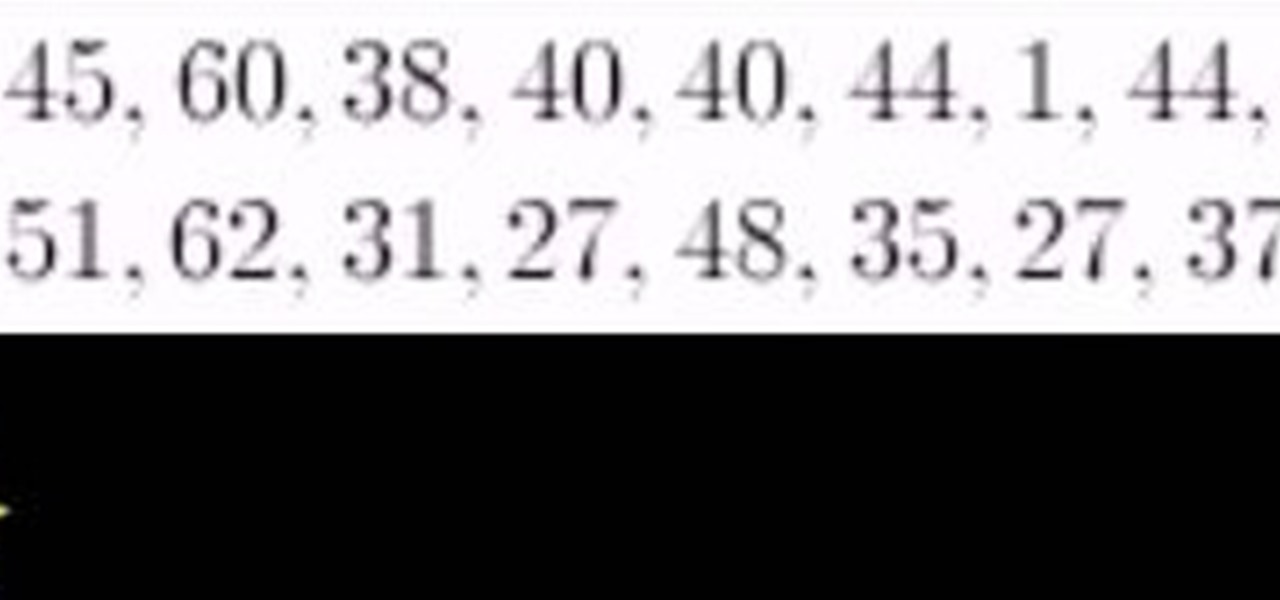
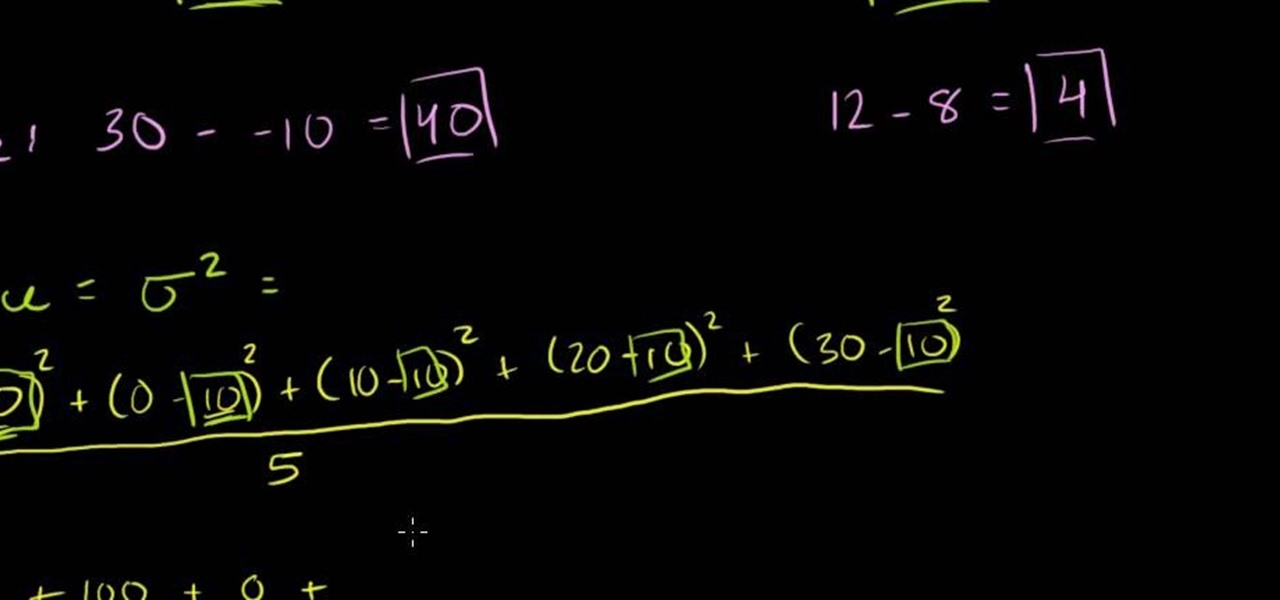
From Ramanujan to calculus co-creator Gottfried Leibniz, many of the world's best and brightest mathematical minds have belonged to autodidacts. And, thanks to the Internet, it's easier than ever to follow in their footsteps (or just study for that next big test). With this installment from Internet pedagogical superstar Salman Khan's series of free math tutorials, you'll learn how to use statistical range, variance and standard deviation to measure dispersion in a data set.
Are you looking for a way to make your Microsoft Excel formulas simpler, faster and more efficient? If so, you're in the right place. With this free video lesson from everyone's favorite digital spreadsheet guru, YouTube's ExcelsFun, the 7th installment in his "Excel Formula Efficiency" series, you'll learn how to use a helper cell to remove a time-consuming (expensive) section of your formula to speed up calculations.
Are you looking for a way to make your Microsoft Excel formulas simpler, faster and more efficient? If so, you're in the right place. With this free video lesson from everyone's favorite digital spreadsheet guru, YouTube's ExcelsFun, the 7th installment in his "Excel Formula Efficiency" series, you'll see how a helper column with concatenated fields can dramatically reduce the time a formula takes to calculate.
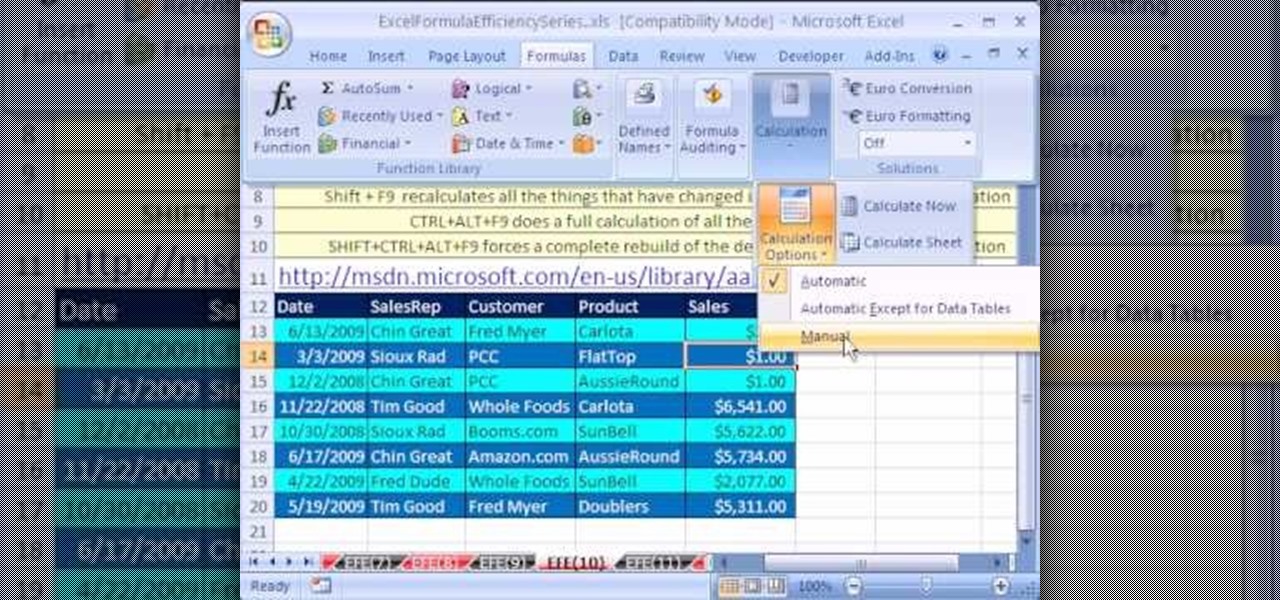
Are you looking for a way to make your Microsoft Excel formulas simpler, faster and more efficient? If so, you're in the right place. With this free video lesson from everyone's favorite digital spreadsheet guru, YouTube's ExcelsFun, the 10th installment in his "Excel Formula Efficiency" series, you'll learn how to use Manual Calculation for huge spreadsheets so that recalculation only occurs when you want it to occur.
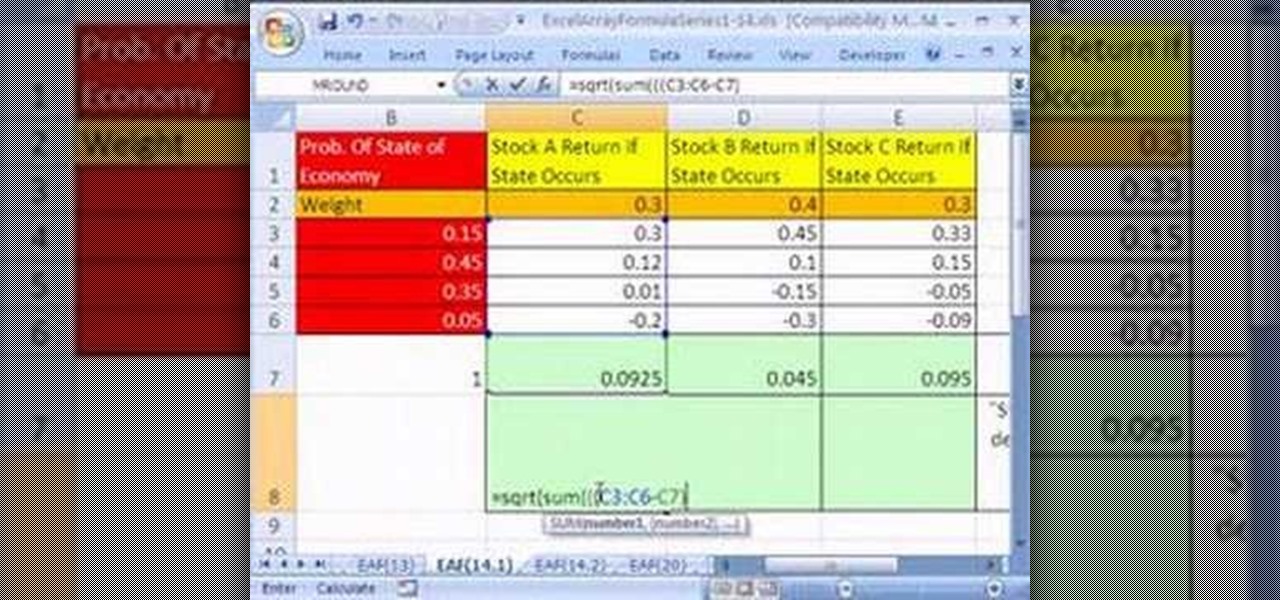
Looking for a primer on how to create and work with array formulas in Microsoft Office Excel? You've come to the right place. In this free video tutorial from everyone's favorite MS Excel guru, YouTube's ExcelIsFun, the 14th installment in his series of Excel array formula series, you'll learn how to create array formulas for individual stock return and standard deviation given different assumed states of the future economy.
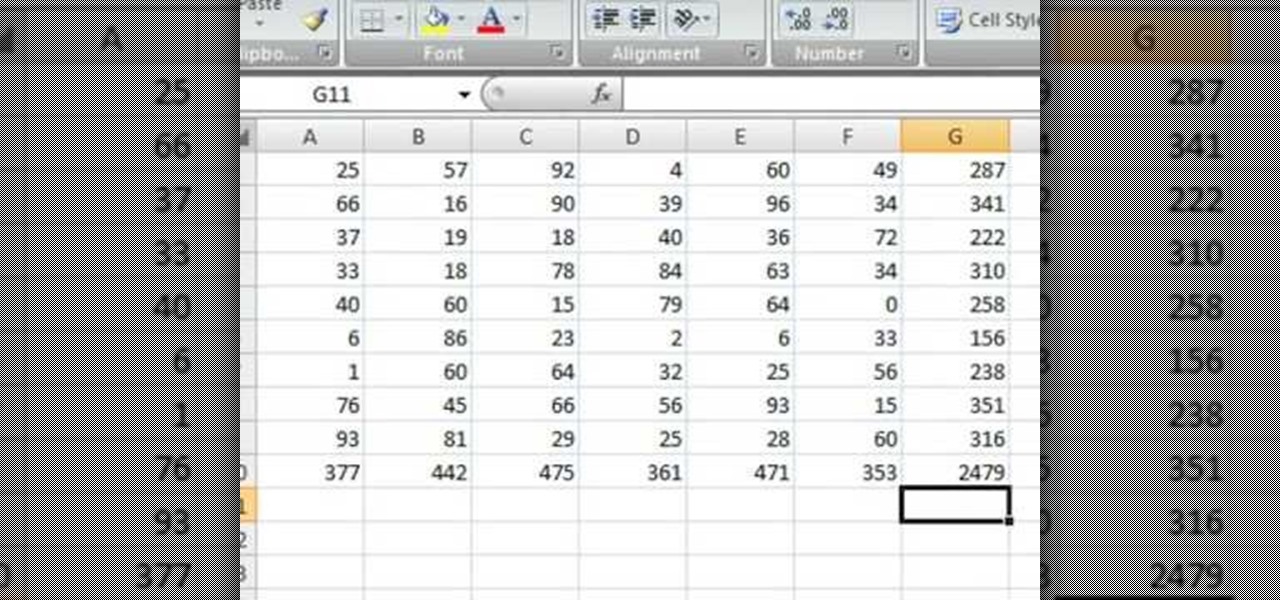
Robert demonstrates how to quickly insert formulas into Excel. To create a sum, highlight your selected cells and press the sum key. Expand the formula by clicking on the fill handle. Double click on the fill handle to expand the formula. To sum vertical columns, highlight all the cells and click the sum button. Press and hold down the control key for another shortcut to work in accordance with the auto sum button. You can also select the average for the area. You can also select the area and...
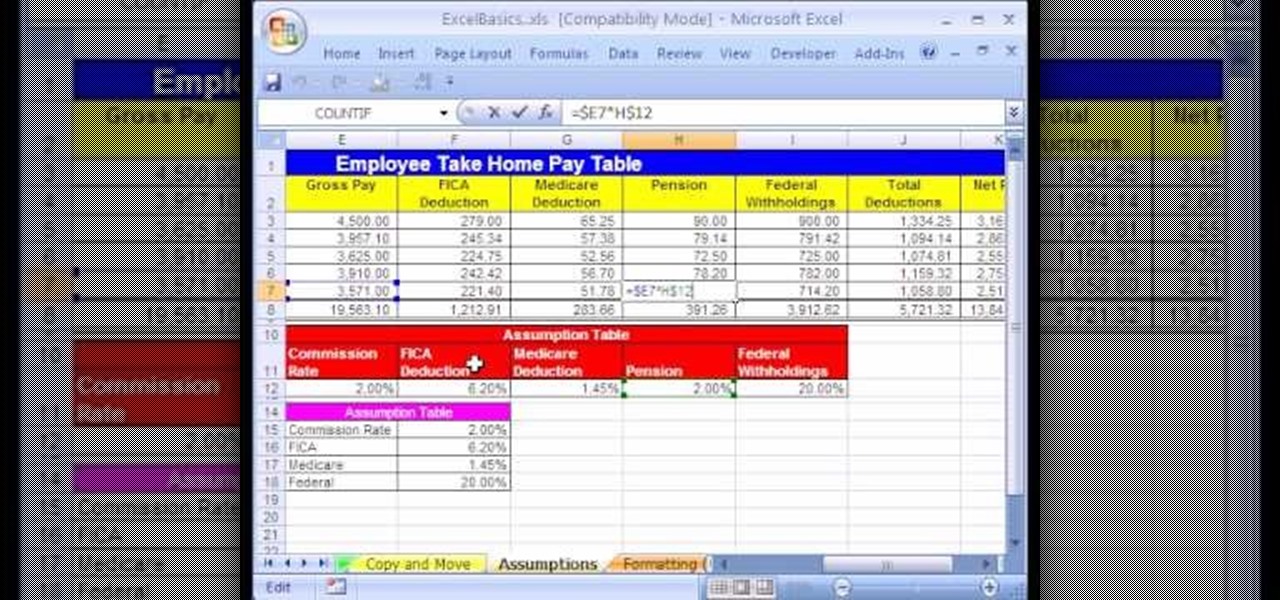
In this Excel basic video the instructor shows how to setup a spreadsheet and use cell references. Cell references are used in Excel to refer to other cells in a formula. When a formula contains data based on the cell reference the formula auto generates the result each time the value in the cell changes as the formula contains only the reference to the cell and not the actual data present in it. In this video the tutor goes on and shows how to write a few basic formulas using cell references...
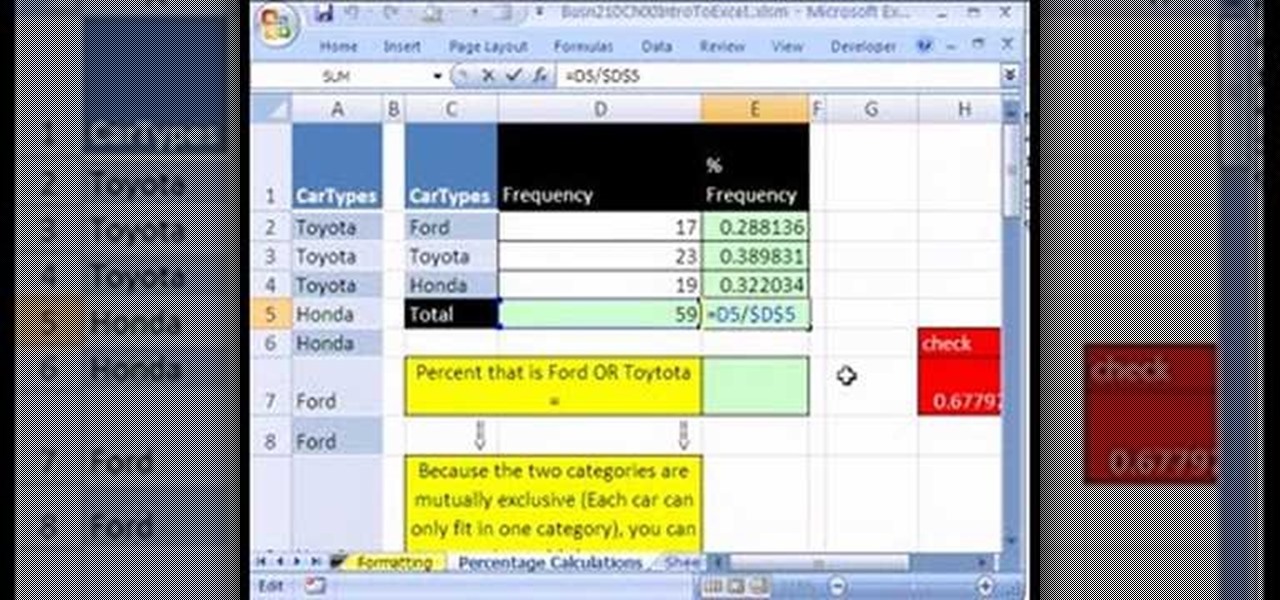
This Excel Statistics series of video shows how to calculate proportions and percentages in Microsoft Excel. This video shows how to do percentage calculations using formulas in Microsoft Excel. To make a formula for a percentage, you need to first make a formula to calculate the total sum of objects you are going to use. To do that, use the sum formula. Now, divide the current object's value with the previously generated sum formula, which gives you the frequency. When you multiply this by 1...
Need a little help in your Trig class? In this two-part math tutorial, learn how to use the SOH (sine = opposite over hypotenuse) formula in high school Trigonometry. If you'd like to practice with exercises and answer sheets, you can go here.
A beginner's Microsoft Excel tutorial that covers working with formulas, formatting, auto-formatting, dates, and more in Microsoft Excel.
Learn about the New Formula Features in Microsoft's Office 2007 and how to use them to do calculations in MS Office and Excel documents.
Learn how to convert a formula to a value in a Microsoft Excel 2010 spreadsheet. Whether you're new to Microsoft's popular digital spreadsheet application or a seasoned business professional just looking to better acquaint yourself with the Excel 2010 workflow, you're sure to be well served by this video tutorial. For more information, and to get started converting formulas in your own MS Excel 2010 projects, watch this free video guide.
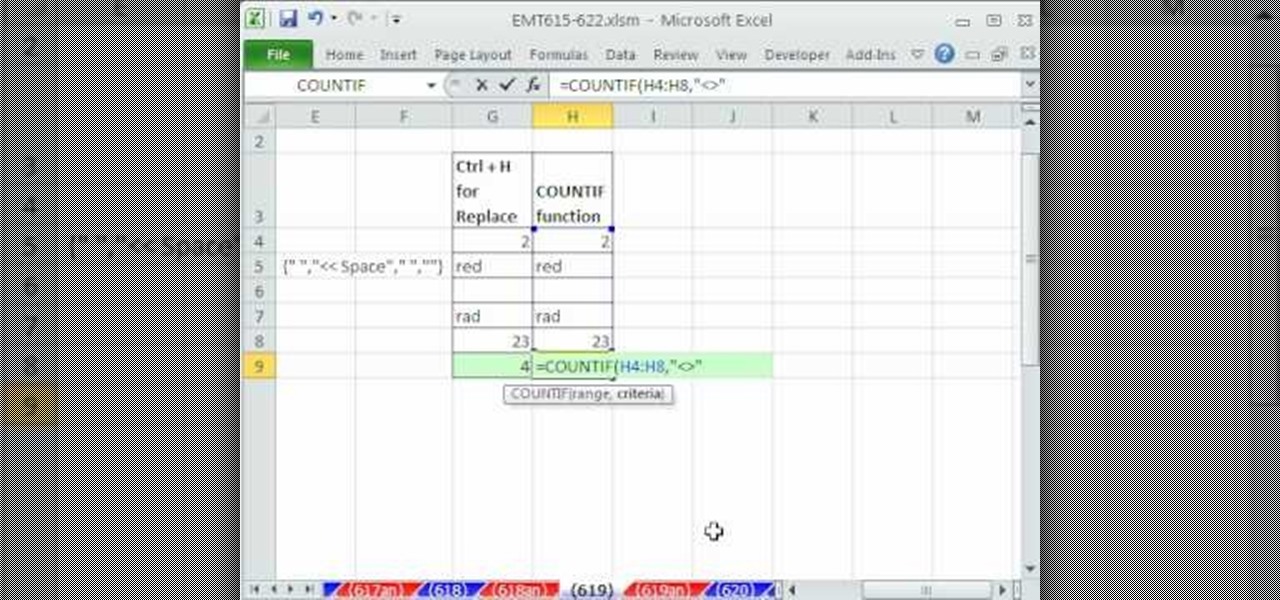
New to Microsoft Excel? Looking for a tip? How about a tip so mind-blowingly useful as to qualify as a magic trick? You're in luck. In this MS Excel tutorial from ExcelIsFun, the 619th installment in their series of digital spreadsheet magic tricks, you'll see how spaces in cells cause trouble in formulas and learn how to use the REPLACE, COUNTIF, CLEAN & TRIM functions to solve space-related formula problems.
Learn how to create linkage formulas in MS Excel 2007. Whether you're new to Microsoft's popular spreadsheet application or a seasoned business professional just looking to better acquaint yourself with the unique features of Excel 2007, you're sure to be well served by this video tutorial. For more information, and to get started using linkage formulas in your own 2007 workbooks, watch this free video guide.
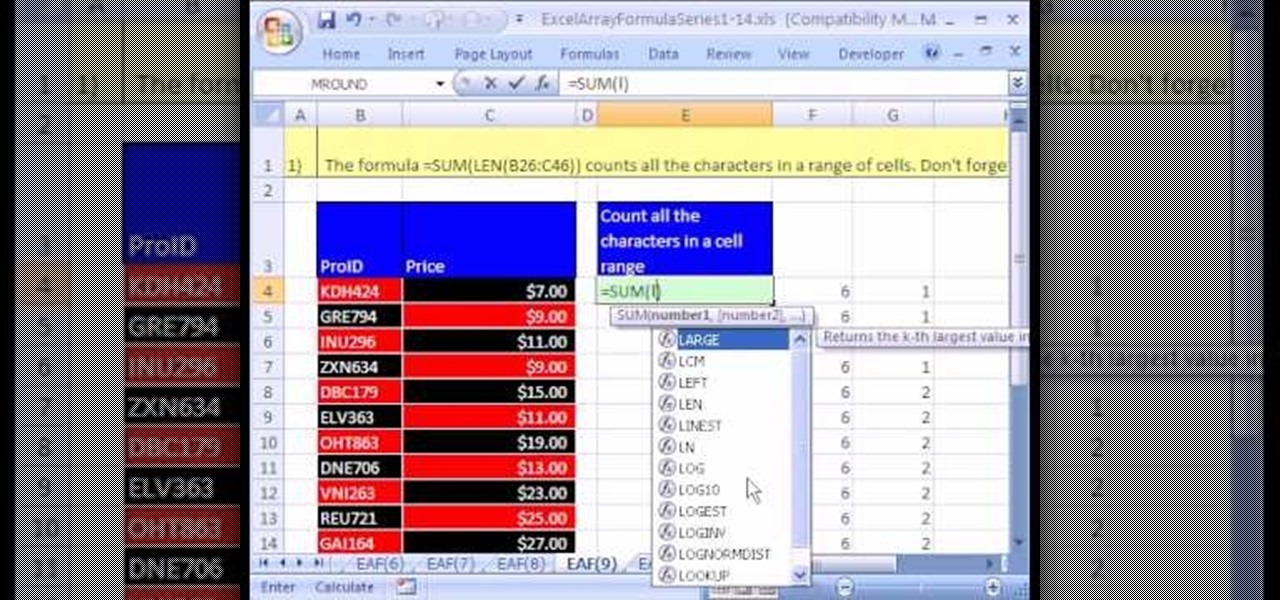
Looking for a primer on how to create and work with array formulas in Microsoft Office Excel? You've come to the right place. In this free video tutorial from everyone's favorite MS Excel guru, YouTube's ExcelIsFun, the 9th installment in his series of Excel array formula series, you'll learn create array formula that counts all the characters in a range of cells.
From Ramanujan to calculus co-creator Gottfried Leibniz, many of the world's best and brightest mathematical minds have belonged to autodidacts. And, thanks to the Internet, it's easier than ever to follow in their footsteps (or just finish your homework or study for that next big test). With this installment from Internet pedagogical superstar Salman Khan's series of free math tutorials, you'll learn how to solve quadratic equations by applying the quadratic formula.
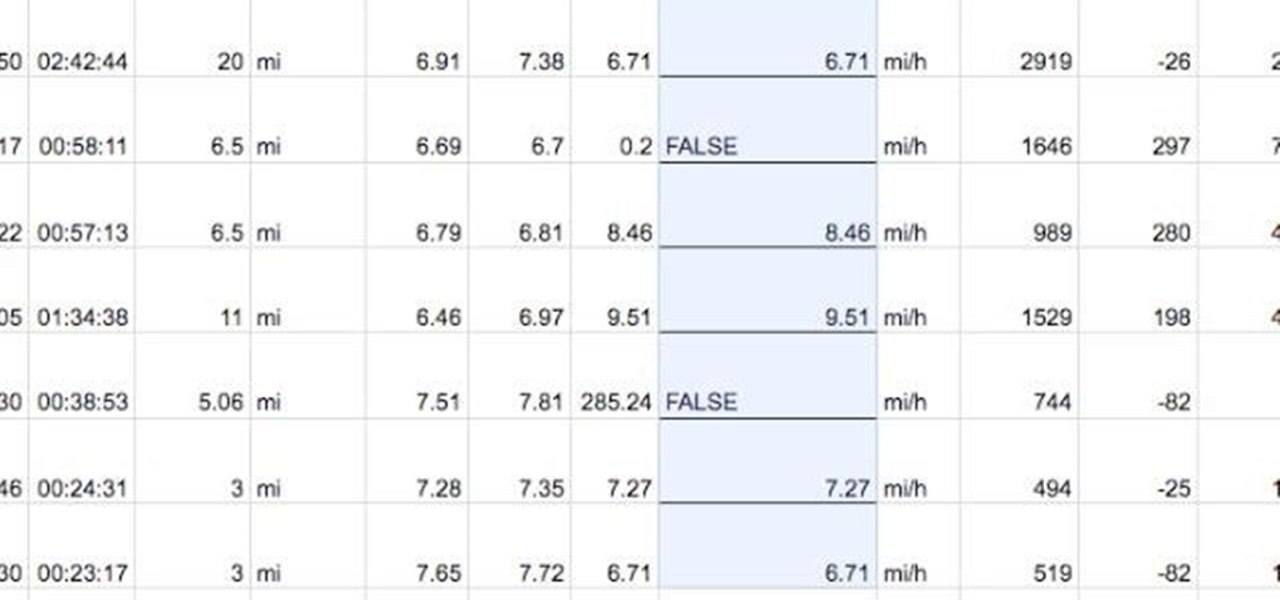
Need a primer on how to discount outliers when calculating a statistical average within Google Spreadsheets? It's easier than you might think. And this free video tutorial presents an easy-to-follow, step-by-step guide of the entire process. For detailed instructions, and to get started lopping off outliers in Spreadsheets yourself, take a look!
If you use Microsoft Excel on a regular basis, odds are you work with numbers. Put those numbers to work. Statistical analysis allows you to find patterns, trends and probabilities within your data. In this MS Excel tutorial from everyone's favorite Excel guru, YouTube's ExcelsFun, the 48th installment in his "Excel Statistics" series of free video lessons, you'll see comparison of Chebyshev's Theorem and the Empirical Rule (bell curve) and learn when to apply which.
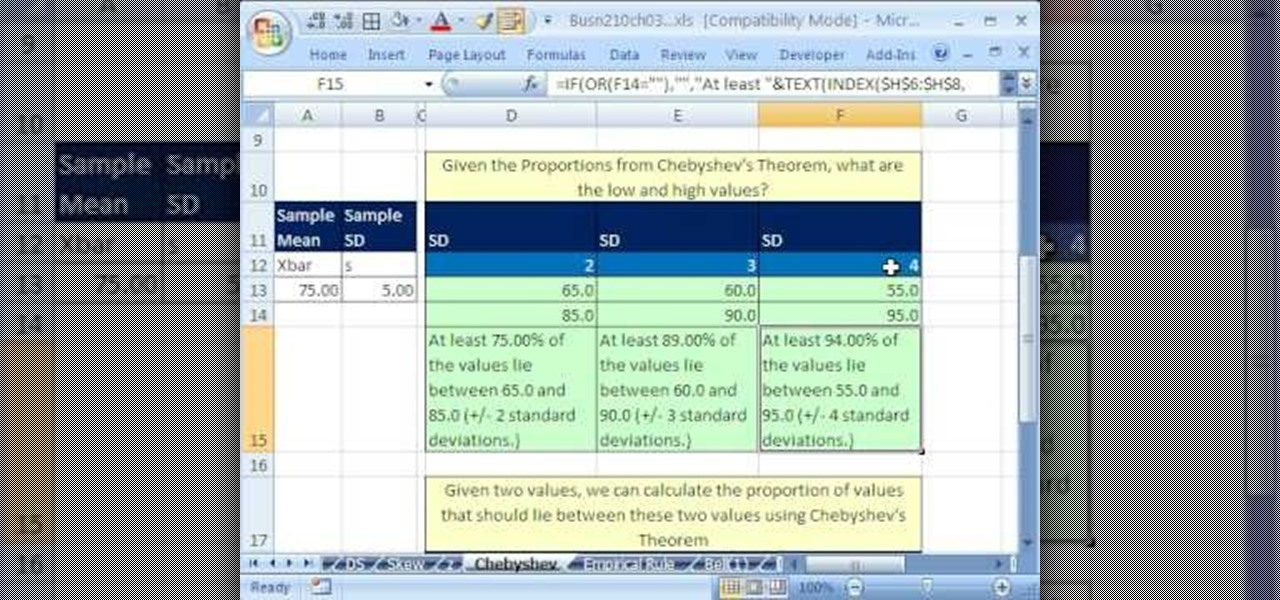
If you use Microsoft Excel on a regular basis, odds are you work with numbers. Put those numbers to work. Statistical analysis allows you to find patterns, trends and probabilities within your data. In this MS Excel tutorial from everyone's favorite Excel guru, YouTube's ExcelsFun, the 46th installment in his "Excel Statistics" series of free video lessons, you'll learn about Chebyshev's Theorem and how to apply it in three different ways.
If you use Microsoft Excel on a regular basis, odds are you work with numbers. Put those numbers to work. Statistical analysis allows you to find patterns, trends and probabilities within your data. In this MS Excel tutorial from everyone's favorite Excel guru, YouTube's ExcelsFun, the 43rd installment in his "Excel Statistics" series of free video lessons, you'll learn how to use the Excel Data Analysis add-in descriptive statistics tool.
If you use Microsoft Excel on a regular basis, odds are you work with numbers. Put those numbers to work. Statistical analysis allows you to find patterns, trends and probabilities within your data. In this MS Excel tutorial from everyone's favorite Excel guru, YouTube's ExcelsFun, the 42nd installment in his "Excel Statistics" series of free video lessons, you'll learn how to calculate the coefficient of variation.