The foreign exchange, or forex, market is a relatively safe place to invest money, but like with any investment research and understanding indicators are key to making profits. Watch this video to learn how to use forex trading spreads to read the market and make sound investments.

Forex— what is it? Any investor could tell you a complicated description of what Forex is, but the basics of the FX currency markets is— an over-the-counter financial market for trading currencies. The foreign currency exchange market has no central exchanges like the stock market and little regulatory oversight. With this beginner’s guide, learn the trading basics.

This video is teaching you how to have proper Risk Management when trading. Not managing your risk will eventually kill your capital, whether you are trading stocks, forex, futures or indices. After explaining the concepts instructions are provided for you to adopt the principles mentioned.
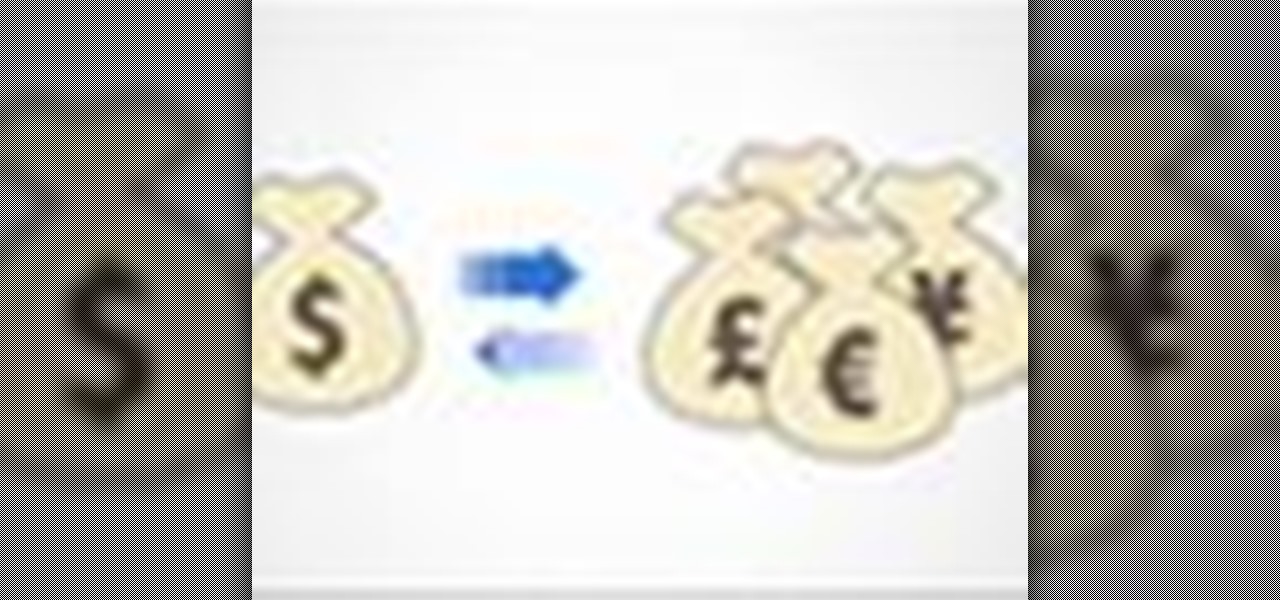
As with any investment, putting your money in foreign markets requires due diligence and the willingness to take risks.
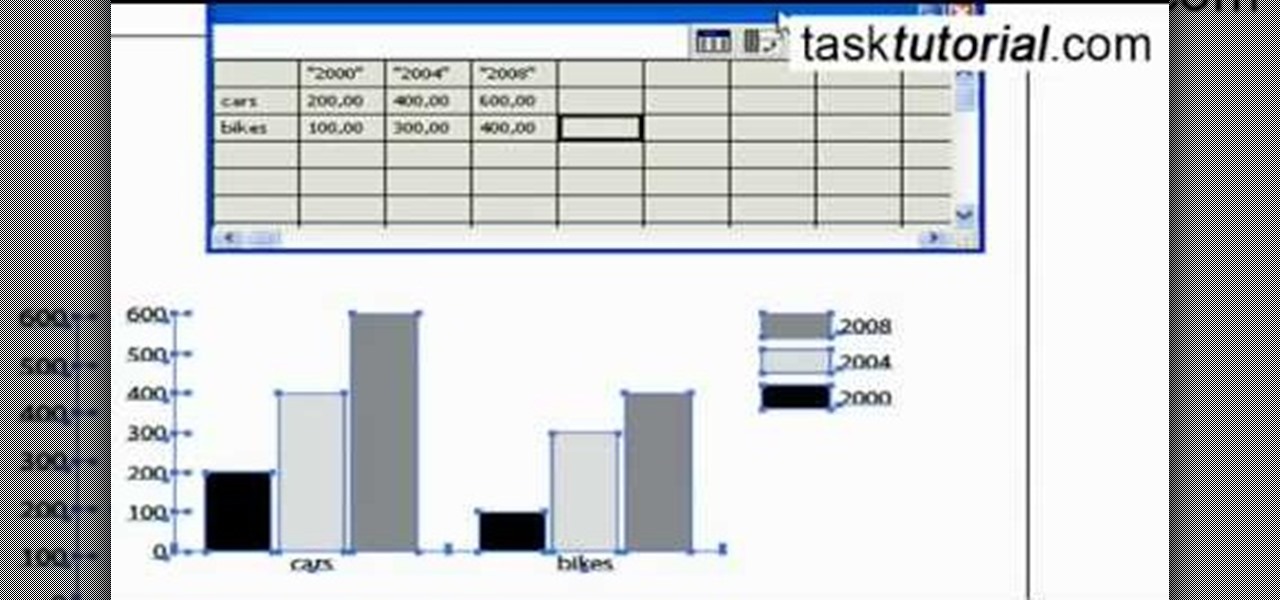
You will learn to create graphs in Illustrator. The best way to visualize data is a graph, and there are several different graph choices in this program. He chooses a column graph to show how he creates his graphs. Holding the left mouse button and dragging, he creates a rectangle which will be our graph. This brings up an input screen beside the rectangle for the graph; he puts information into the screen which shows up on the graph when he is finished.

This test can be used to determine whether the given graph is a function or not.

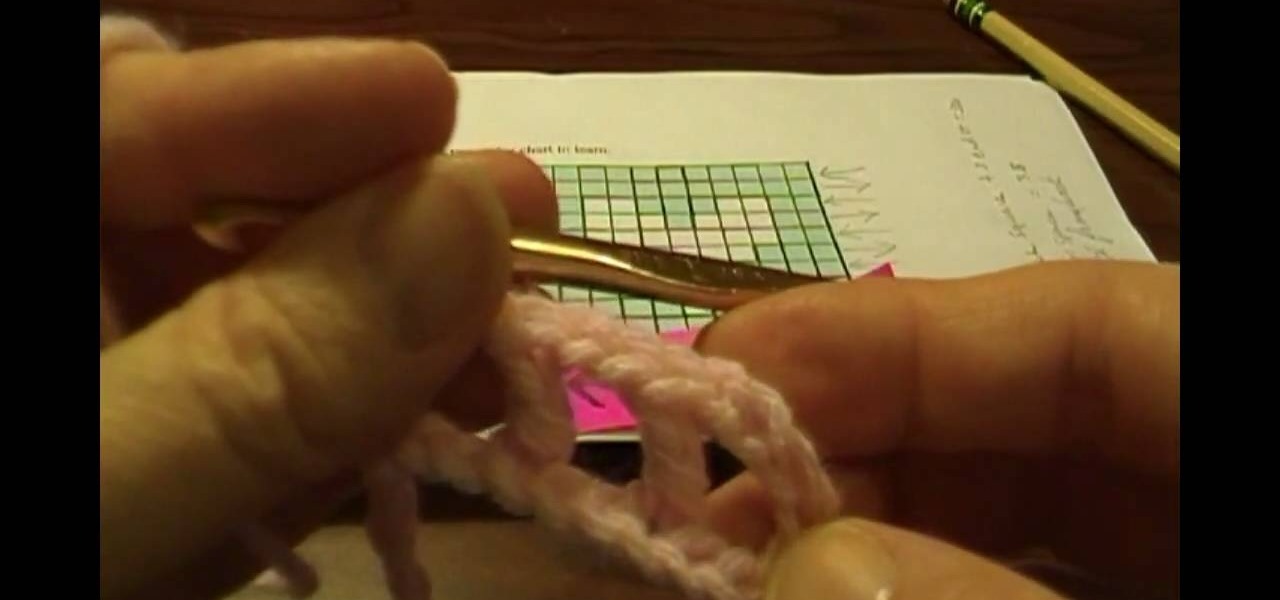
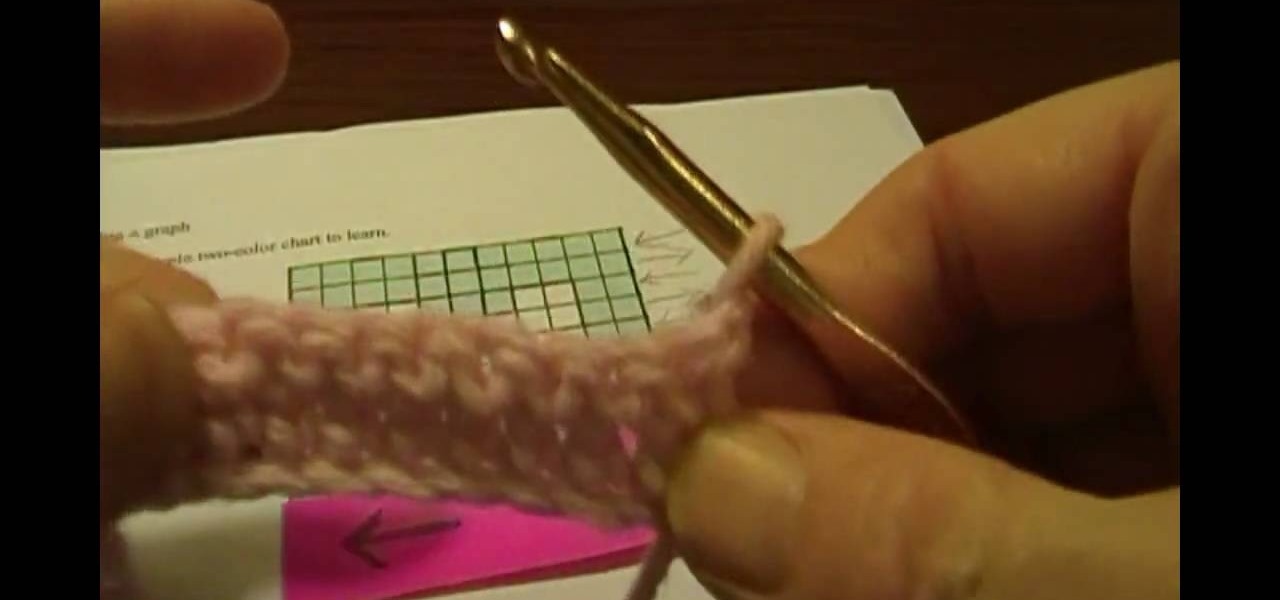
Learn how to crochet using a graph or chart in this six part vieo tutorial series. Filet crochet is lacy stitch - an easy technique - that can have beautiful results. Filet crochet patterns are usually made up of open meshes & solid meshes. Get the free simple heart chart used in this video here.
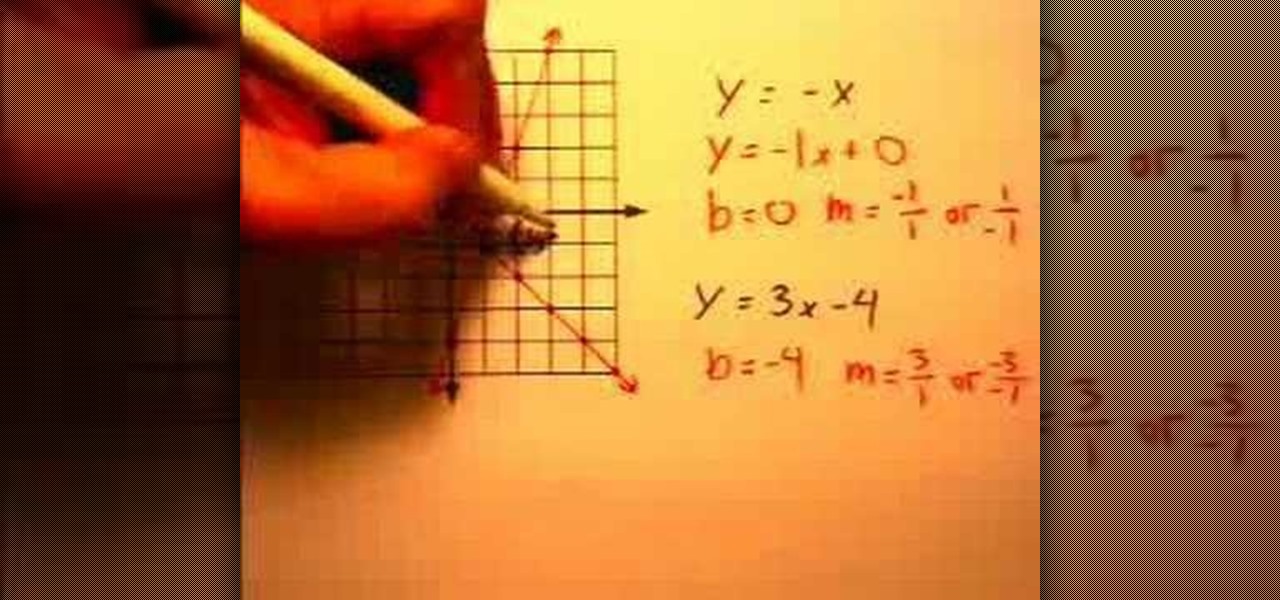
A basis of algebra, slope intercept form can easily bring your equation to a graph with ease. This video will show you exactly how to graph equations using the slope intercept form.
Lawrence Perez, from Saddleback College, and his assistant Charlie, give this beginning-algebra two-part lesson on graphing linear equations. This stuff is hard, yet it looks so simple, thanks to this video.
In this five-part video tutorial, learn how to double crochet intarsia using a graph or chart. Intarsia knitting is an advanced knitting method, used to knit with several colors of yarn. The simple heart chart used in this video is available here.
In this video the instructor shows how to graph a piecewise defined function. A piecewise defined function is a function that is defined in separate pieces. In these kind of functions, for different ranges of the value of x, you are given different small functions, all of which together make the whole function. This means your equation of the function is given in the form of smaller functions. Now to graph these kind of equations all you have to do is graph the individual equations in the sam...
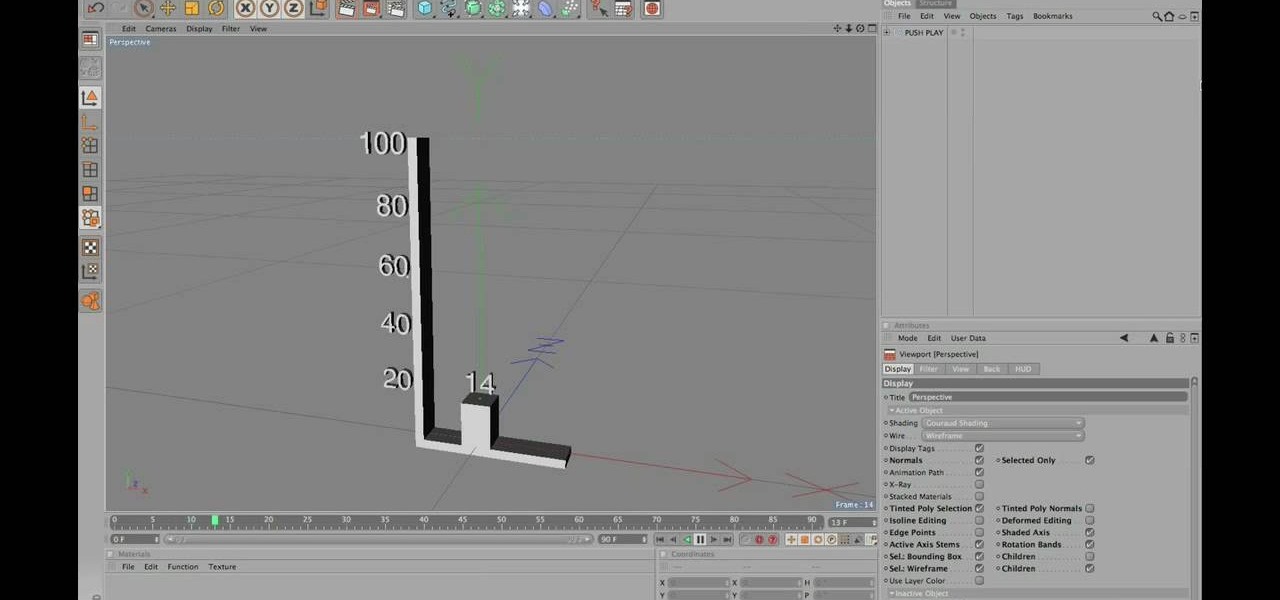
Creating 3D bar graphs using Cinema 4D can be challenging and boring, but is an essential part of many who use the software's professional lives. This video will teach you how to do so quickly and easily. This should make the process of preparing business presentations or any other project involving bar graphs much easier and less headache-inducing.
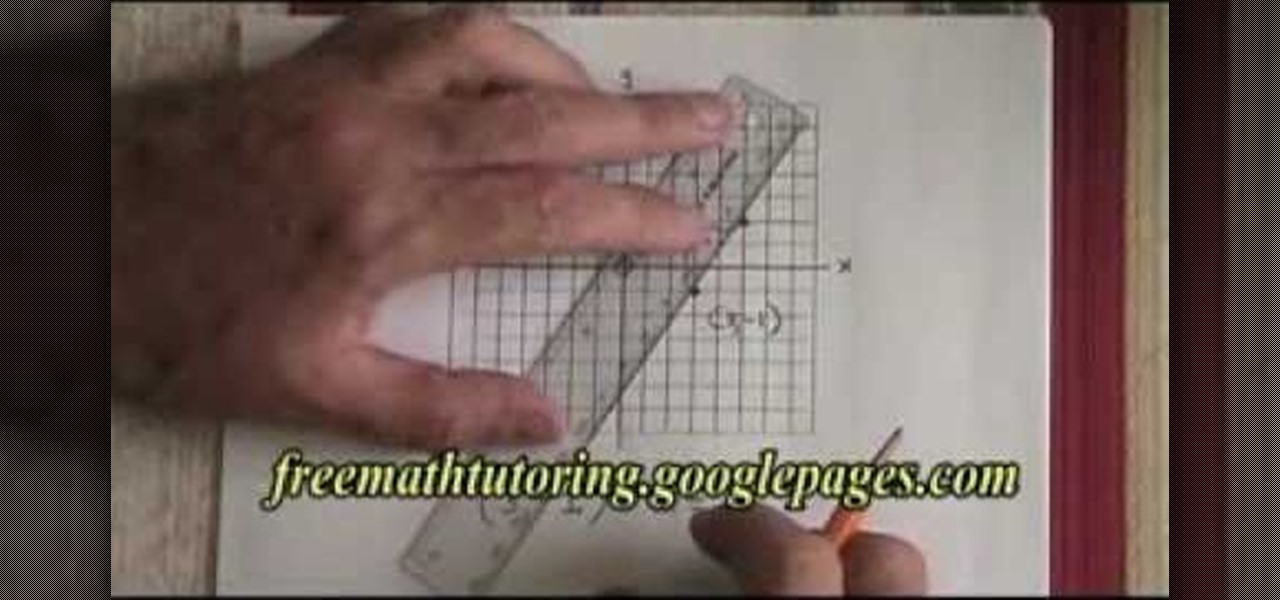
In this video the tutor shows how to graph a straight line using the rise over run method. The rise over run trick allows you to graph a straight line as long as you have a starting point and a slope value in the form of a fraction. The first step is to graph the starting point. In the second step he states that the numerator of the slope is rise and the denominator of the slope is run. He says that the rise is vertical and the run is horizontal and shows how do rise and run using those value...
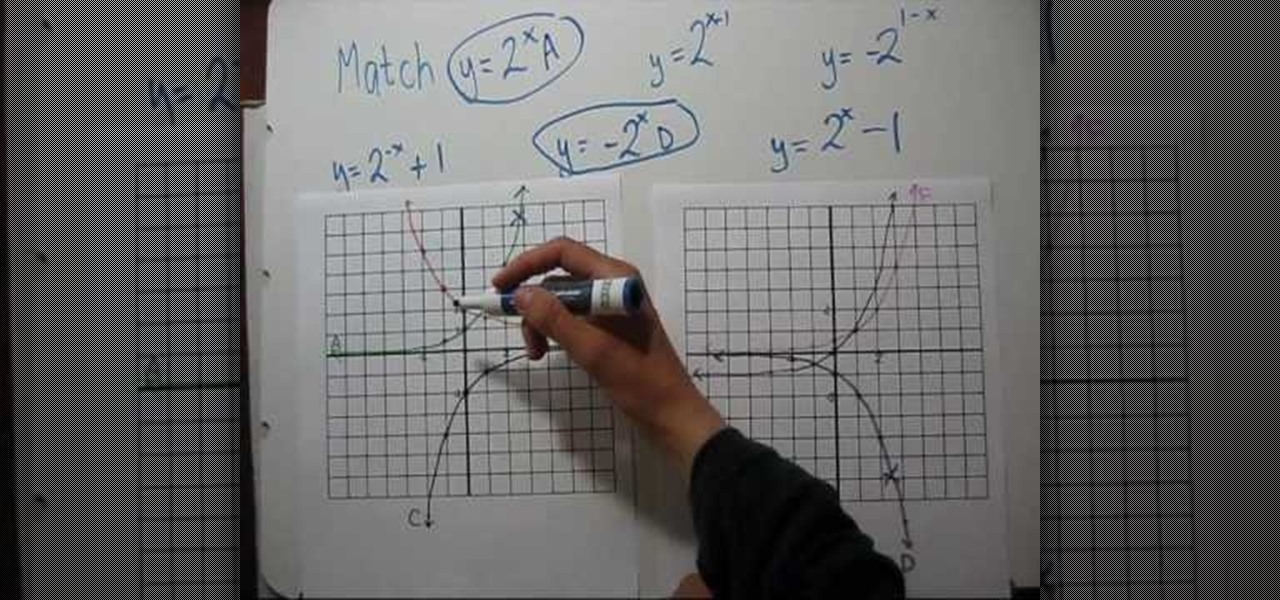
This video tutorial belongs to the Education category which is going to show you how to match exponential graphs. The video shows two graph sheets with three graphs marked A to F on each sheet and six equations. It starts off with matching the basic function, y = 2 to the power x. If you plug in zero for x, you get '2 to the power 0' which is 1. Hence, the equation becomes; y = 1. So, the graph that passes through y = 1 is the matching one. In the video it is graph A. You can watch the video ...
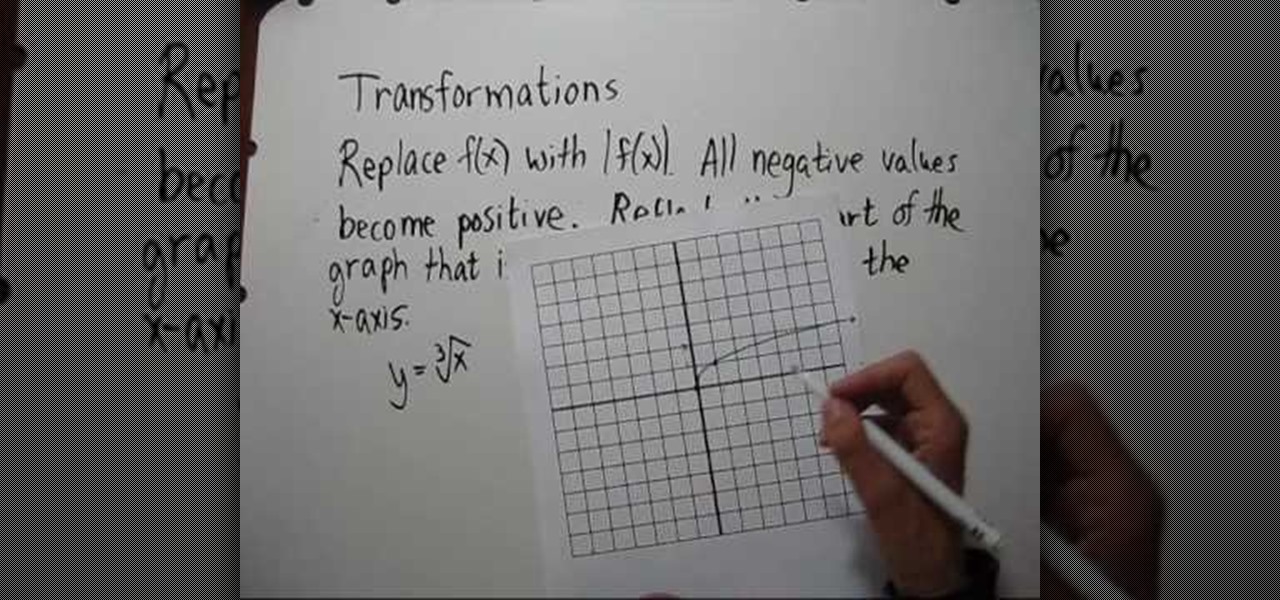
This video shows the method to plot the graph of the absolute value of a function. The video shows the example of the function of cube root of 'x'. The demonstrator first plots the graph of a cube root function. This is done by taking the reference point of positive one and positive eight. The graph is drawn for both negative and positive values of 'x'. After this the graph of absolute function is drawn by taking the absolute value of the cube root function. The resultant graph comes out to b...
Learn intarsia knitting using a graph in this five part video tutotial series. When knitting intarsia, blocks of color are worked with separate balls or bobbins of yarn, producing a sweater only one layer thick. Get the free simple heart chart used in these videos, here.
Check out this instructional math video that demonstrates how to calculate mathematical functions and graphs. In this 9th lesson, learn how to solve on SAT Algebra problems using the Official SAT Study Guide (as always). Here are the math problems and their page numbers that this video covers:
How To Filet Crochet - Part 1 We we first heard the term "filet crochet," an image popped up in our minds of chicken fillets from McDonald's, only made from crochet yarn (yes, we were also quite hungry at the time). Well, we'll have to save the yarn foods for another time, because a filet crochet is actually a very complex, difficult crocheting pattern that requires a graph in order to get the stitches right.
From Ramanujan to calculus co-creator Gottfried Leibniz, many of the world's best and brightest mathematical minds have belonged to autodidacts. And, thanks to the Internet, it's easier than ever to follow in their footsteps (or just finish your homework or study for that next big test). With this installment from Internet pedagogical superstar Salman Khan's series of free math tutorials, you'll learn how to find answers to quadratic function problems in intermediate algebra by graphing.
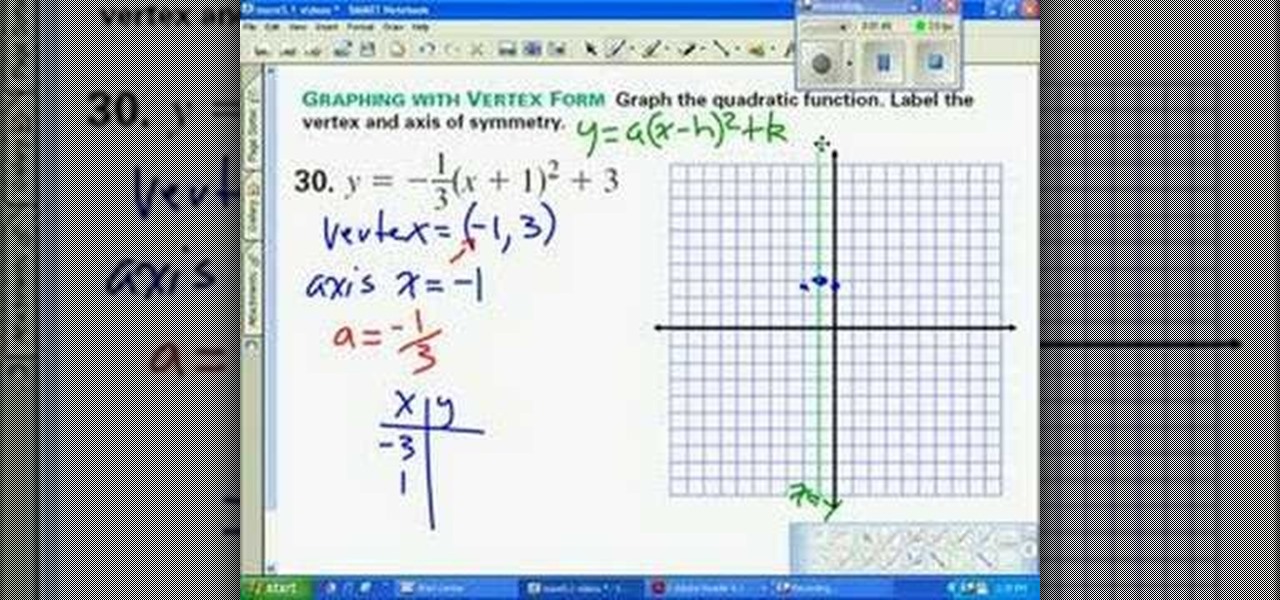
This video shows viewers who are interested in mathematics how to graph a parabola whose formula is displayed in vertex form, or the form y=a(x-h)^2+k, where the vertex is (h, k). After determining the vertex, plot it on your graph. After graphing your vertex, your axis of symmetry would be x= h, or the x-coordinate of your vertex. The a value in your equation will act as your slope in this case, and your should graph the two points which correspond to this slope on your plot 1 unit away on e...
From Ramanujan to calculus co-creator Gottfried Leibniz, many of the world's best and brightest mathematical minds have belonged to autodidacts. And, thanks to the Internet, it's easier than ever to follow in their footsteps (or just finish your homework or study for that next big test). With this installment from Internet pedagogical superstar Salman Khan's series of free math tutorials, you'll learn how to graph and solve a system of linear inequalities in algebra.
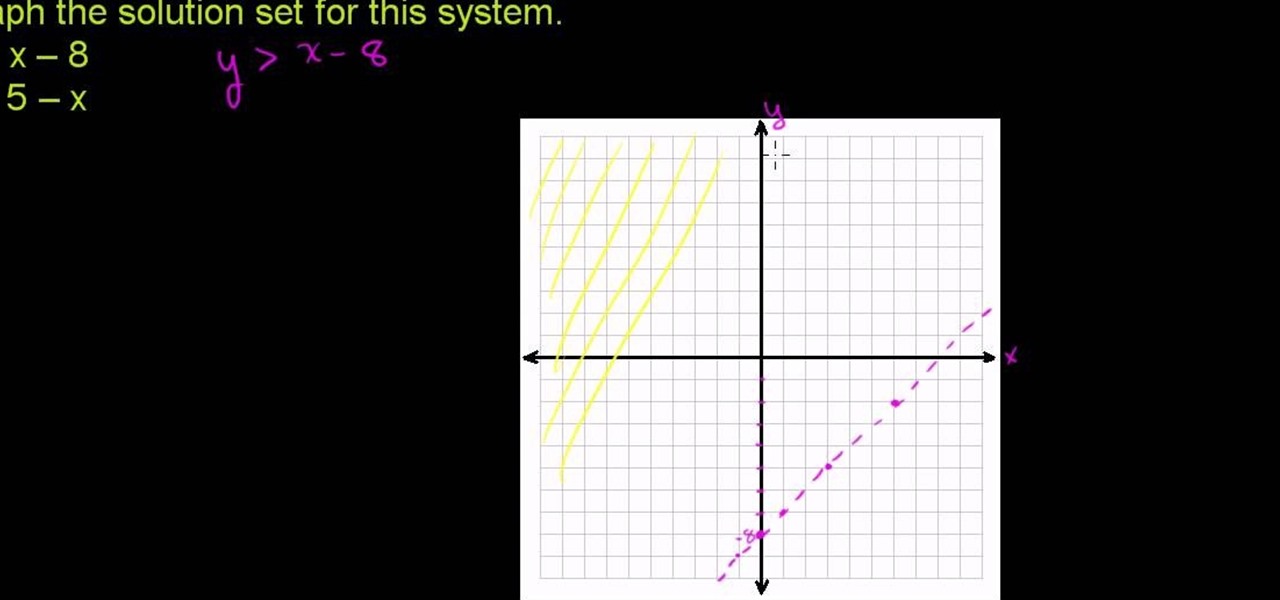
From Ramanujan to calculus co-creator Gottfried Leibniz, many of the world's best and brightest mathematical minds have belonged to autodidacts. And, thanks to the Internet, it's easier than ever to follow in their footsteps (or just finish your homework or study for that next big test). With this installment from Internet pedagogical superstar Salman Khan's series of free math tutorials, you'll learn how to graph and solve linear inequalities in two variables in algebra.
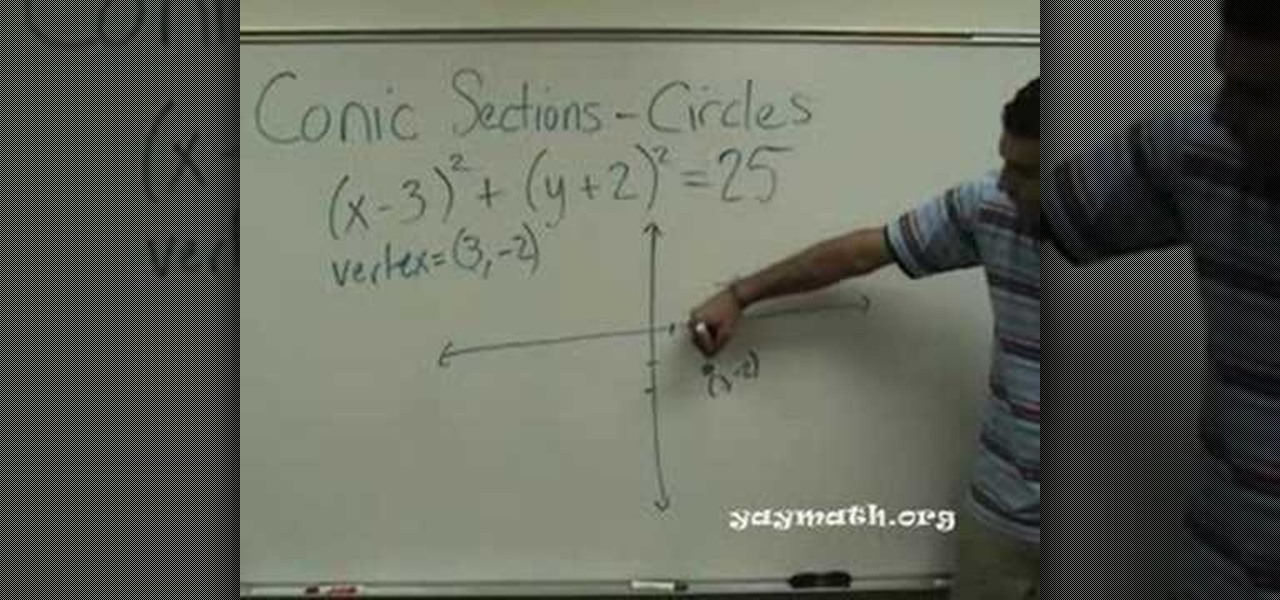
In this tutorial, we learn how to graph a circle. When given an equation to graph the circle, you will first need to find the vertex of the circle. Once you find this, you can use those coordinates to mark the vertex on the graph. Follow the negatives and positives to go up, down, left, and right on the graph. Next, you will need to find the 'r' value of the equation. After this, you will use this to continue to graph the rest of the points around the vertex. When finished, draw the outline o...
See how to calculate velocity from a distance time graph, how to calculate acceleration from a velocity time graph and how to calculate distance covered from a velocity time graph! From Ramanujan to calculus co-creator Gottfried Leibniz, many of the world's best and brightest mathematical minds have belonged to autodidacts. And, thanks to the Internet, it's easier than ever to follow in their footsteps (or just finish your homework or study for that next big test).
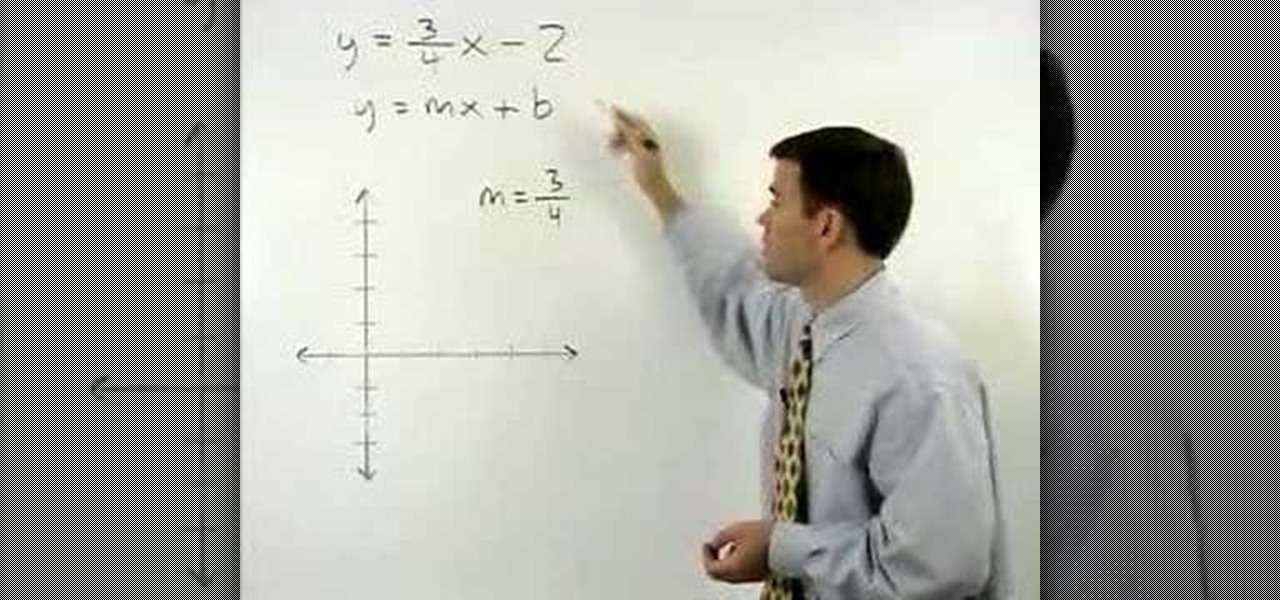
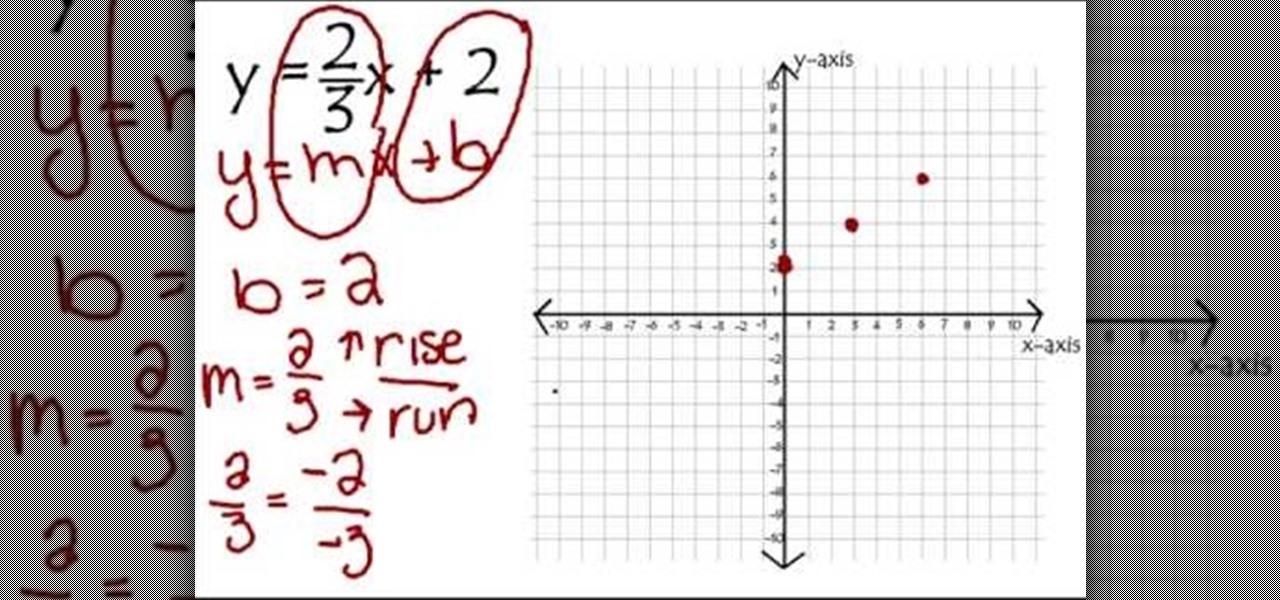
This video is an instructional guide about Graph Linear Equations presented in algebraic form. It is an easy to follow, step by step guide to solving such equations using the graph intercept formula. The first example equation is Y = 2x -1 over y = mx + b. The video then shows you how to breakdown the equation into manageable sums using fractions to represent the data, and then presents the formula for interpreting the answer from these sums onto the graph co-ordinates. The second and third e...
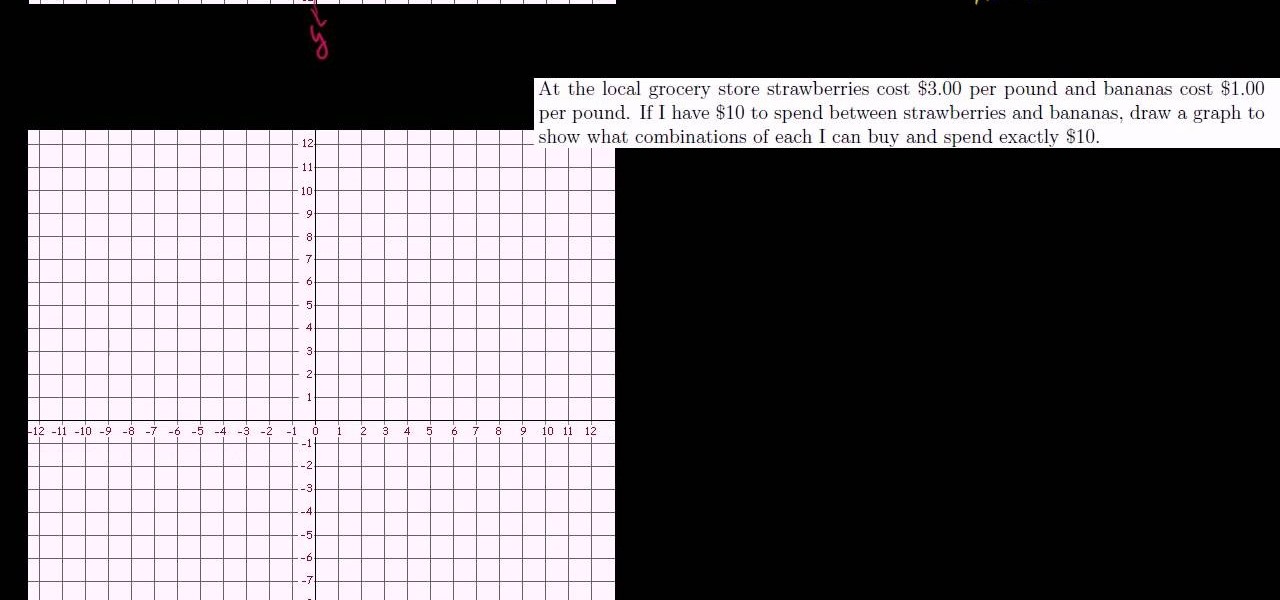
This video shows the viewer how to solve simultaneous equations using a graph or ‘graphing’ as it is referred to. This is done by first rearranging both equations so that y is the object of both equations. The equations can then be solved via substitution – the video does not cover this. Using graphing the next step is to plot both of the lines onto the graph. This can be done by substituting varying values of x to give the y co-ordinates. The solution to the linear equation should be the poi...
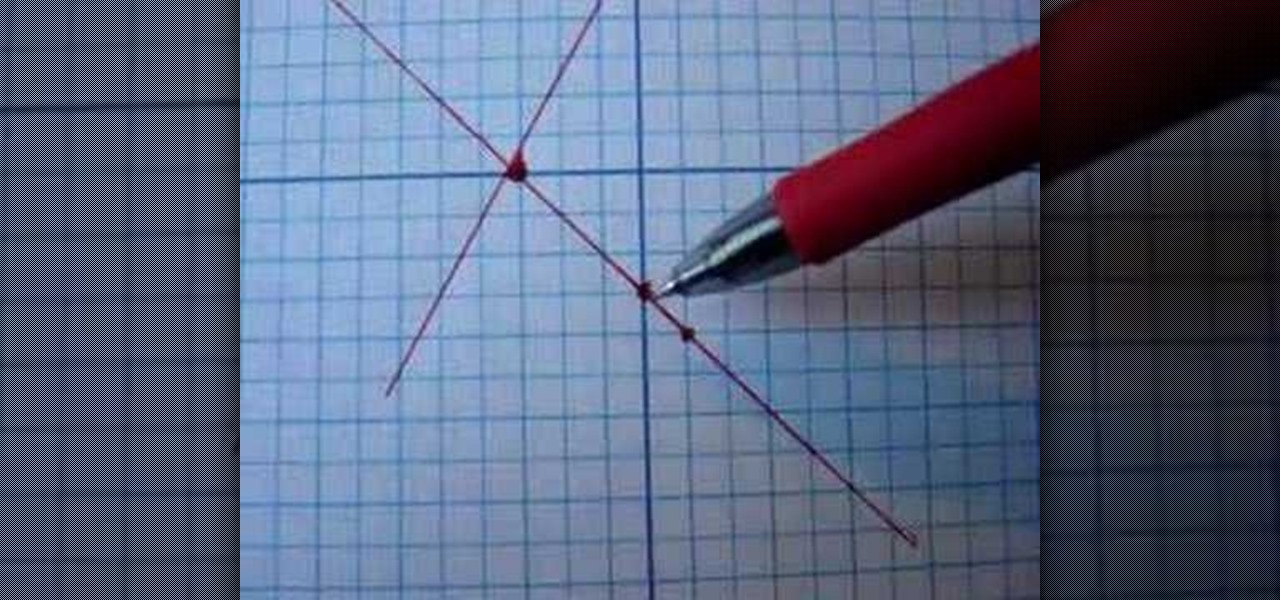
A line is defined by two connecting points on a graph, and intercepts are the points on both the x- and y-axis, where the line intersects. This video tutorial demonstrates how to graph lines using x and y intercepts in a given area. This instructional video also graphs various examples of equations and explains the associated methodology.
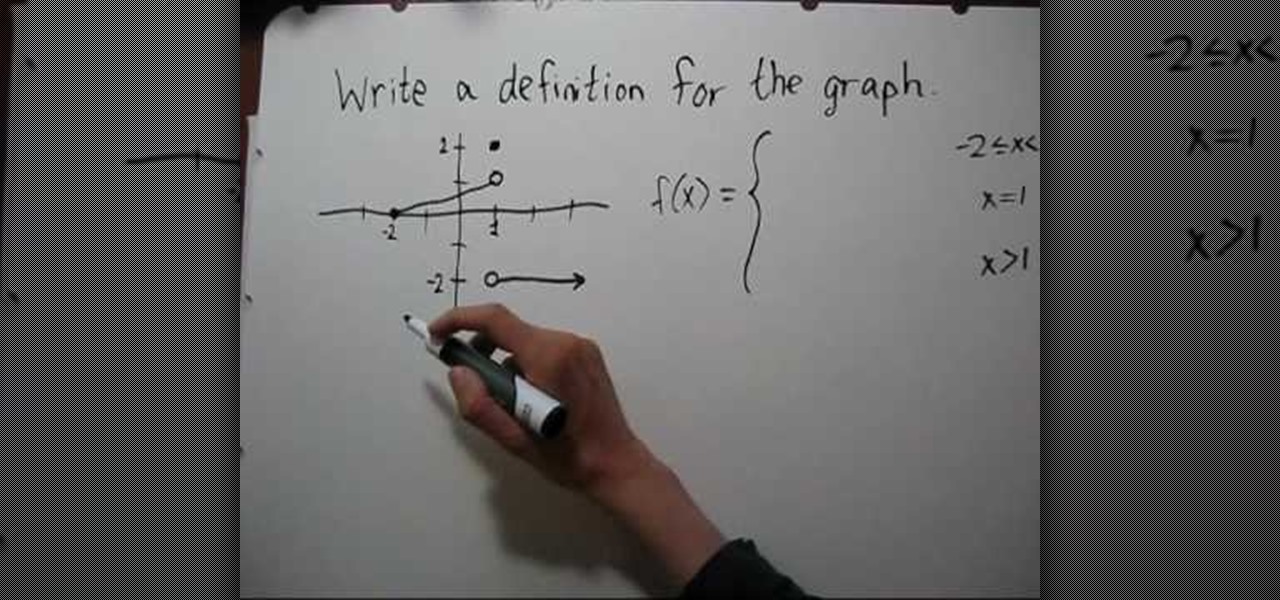
This video shows how to find the formula of a piecewise function when given a graph. The first step is to write a definition for the graph, which is done by identifying the different domains shown in the graph. The second step is writing formulas for each domain specified by the lines in the graph. The point-slope formula is used to identify the slope and y-intercept for the leftmost domain, which has a sloped line. A point and horizontal line make for simpler equations in the other pieces of...
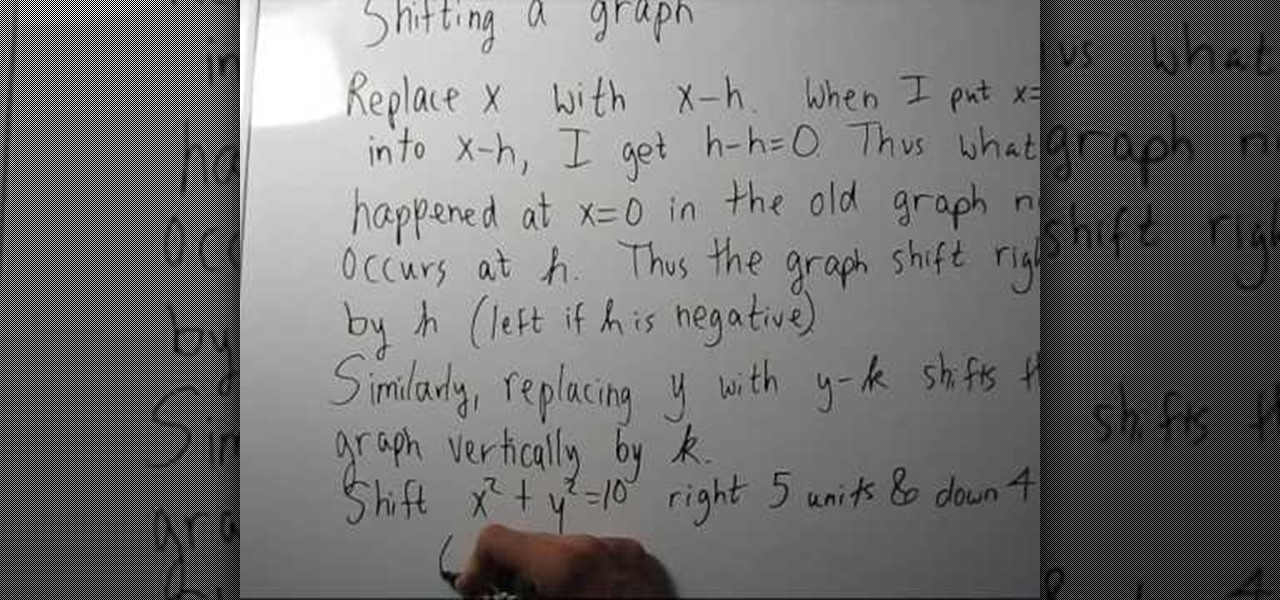
This video will demonstrate exactly how to shift a graph on a x,y axis. When shifting a graph on the x axis you will need to replace x with x-h; where h is the variable to shift the graph. No matter how far you need to shift a graph, h is always the number of units you are shifting; shifting up or right is represented as a positive and down or left is negative. Just plug in your units into your equation and you will have your shifted graph.
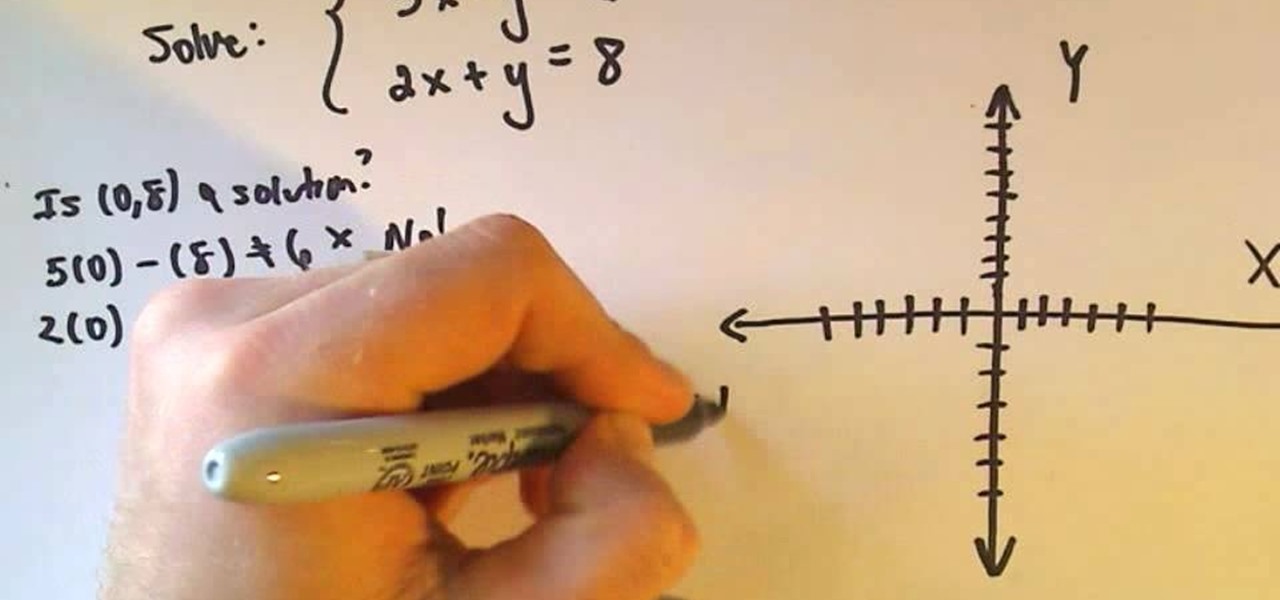
This video shows the method to solve a pair of linear equations by plotting their graph. Look for points of intersection of the two graphs which is the solution. Let us solve 5x-y=6 and 2x+y=8. Writing the equations of lines in slope intercept form, we get y=5x-6 and y=-2x+8. Now we plot the two lines. For the slope 5 or 5/1, we go up 5 units and left 1 units from the point of intersection on the y axis. For -2 or -2/1, we go down 2 units and left 1 units from the point of intersection on the...
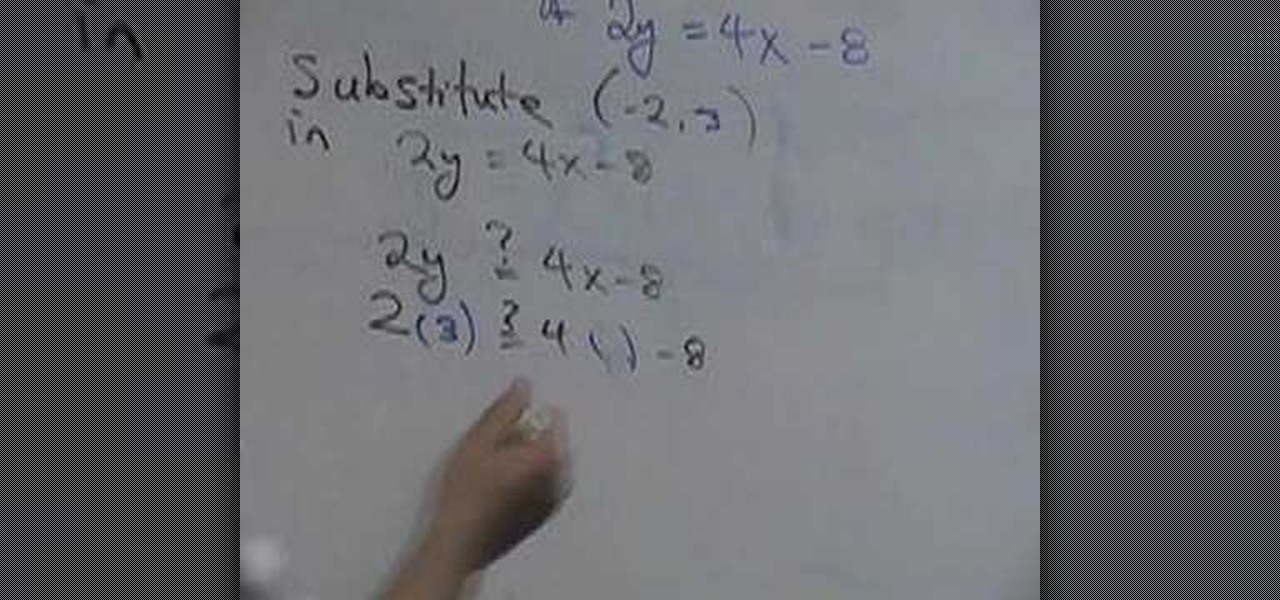
In this video, we learn how to graph an equation. First, pick a point out of the equation and see if it's a solution to the equation. This equation shows where two lines cross in the math problem. See if the two coordinates are part of the line that is on the equation. The two numbers are going to be the 'x' and 'y' that you plug into the equation. Once you have these written out, you will be able to graph them using the coordinates on the graph. Once finished, you will have graphed the equat...
With this tutorial, we learn how to graph a parabola. The way you can tell it's parabola is that the 'x' value will be squared. With a line, 'y' and 'x' are not squared. The 'a' is the number in front, which will also be the coefficient in the graph. 'B' will be the number following that and 'c' will be the last number. Once you identify these, remember that they are always numbers. From here, you can draw out your graph. Follow the numbers that you just listed and then you can graph it out c...
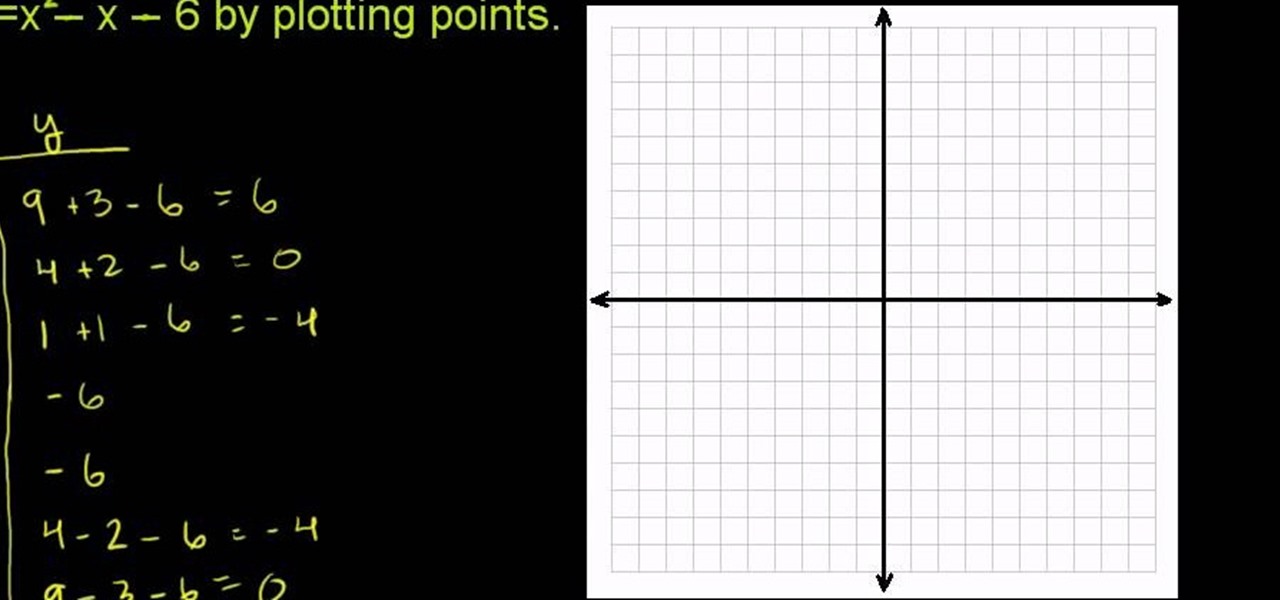
In this tutorial, we learn how to graph a parabola. Quadratic functions are parabolas. To graph these, you will first need to look at the function, which is the set of outputs for a set of inputs. Write this out on a t-chart to find what your 'x' and 'y' values are. Once you find these, you will plug in the coordinates to a graph. After you have written down the coordinates, you can graph your parabola. This is easy to do if you are familiar with quadratic functions and good at math. Just pra...
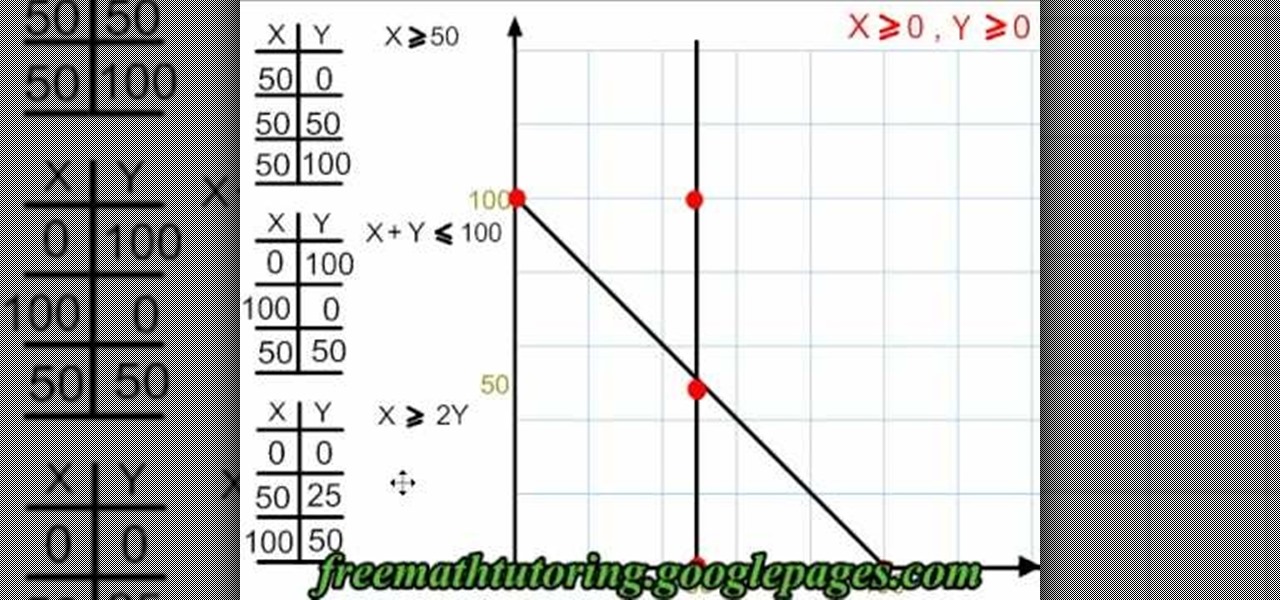
This video shows us how to graph & shade a polygon of constraints. Start out by finding the non zero constraints and the other constraints and inequalities. You will need to know how to graph before you begin to do this equation. Look at the first constraint and then fill in the X and Y sign in your table. Continue on to do this for the other two constraints that you have. Once you have these written down and in front of you, it's just a matter of graphing. Start to graph with the given coord...
In this video tutorial, we learn how to use the Graph Your Inbox! extension for the Google Chrome web browser to visualize Gmail usage over time. For all of the details, and to get started using Graph Your Inbox! yourself, watch this home-computing how-to from Tekzilla.
See how to create a graph for a derivative in calculus. From Ramanujan to calculus co-creator Gottfried Leibniz, many of the world's best and brightest mathematical minds have belonged to autodidacts. And, thanks to the Internet, it's easier than ever to follow in their footsteps (or just finish your homework or study for that next big test). With this installment from Internet pedagogical superstar Salman Khan's series of free math tutorials, you'll learn how to graph derivatives in calculus.
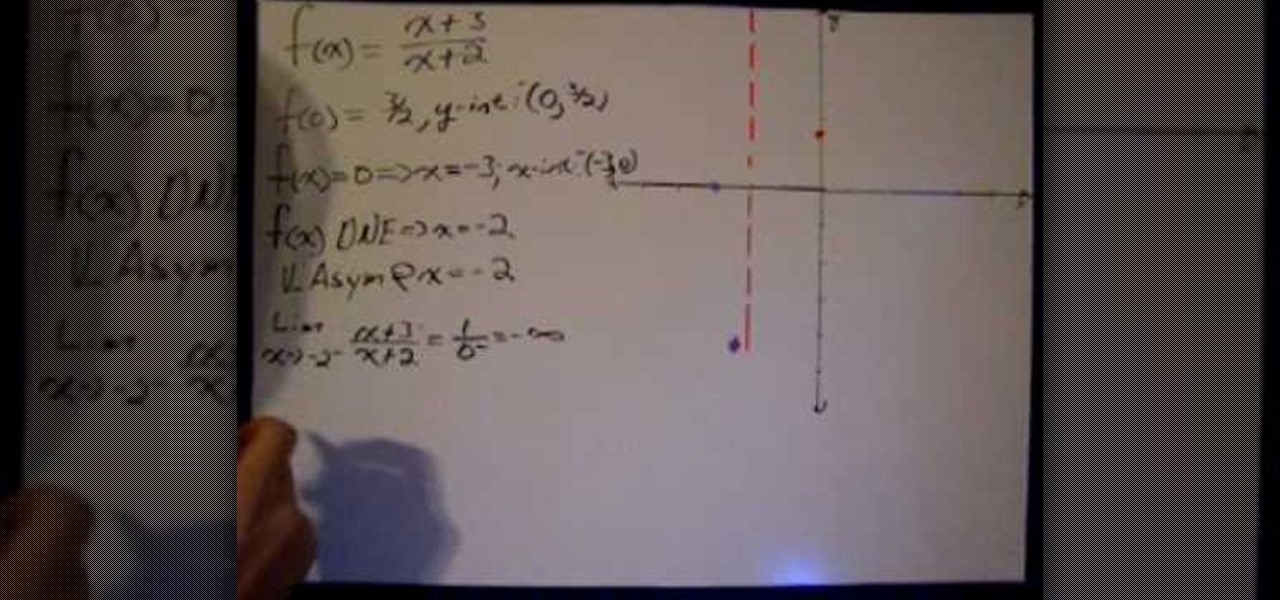
Need help figuring out how to graph a rational function with limits? Learn how to graph a rational function using limits to find discontinuities and functional asymptotes with this free video lesson. From Ramanujan to calculus co-creator Gottfried Leibniz, many of the world's best and brightest mathematical minds have belonged to autodidacts. And, thanks to the Internet, it's easier than ever to follow in their footsteps (or just finish your homework or study for that next big test).
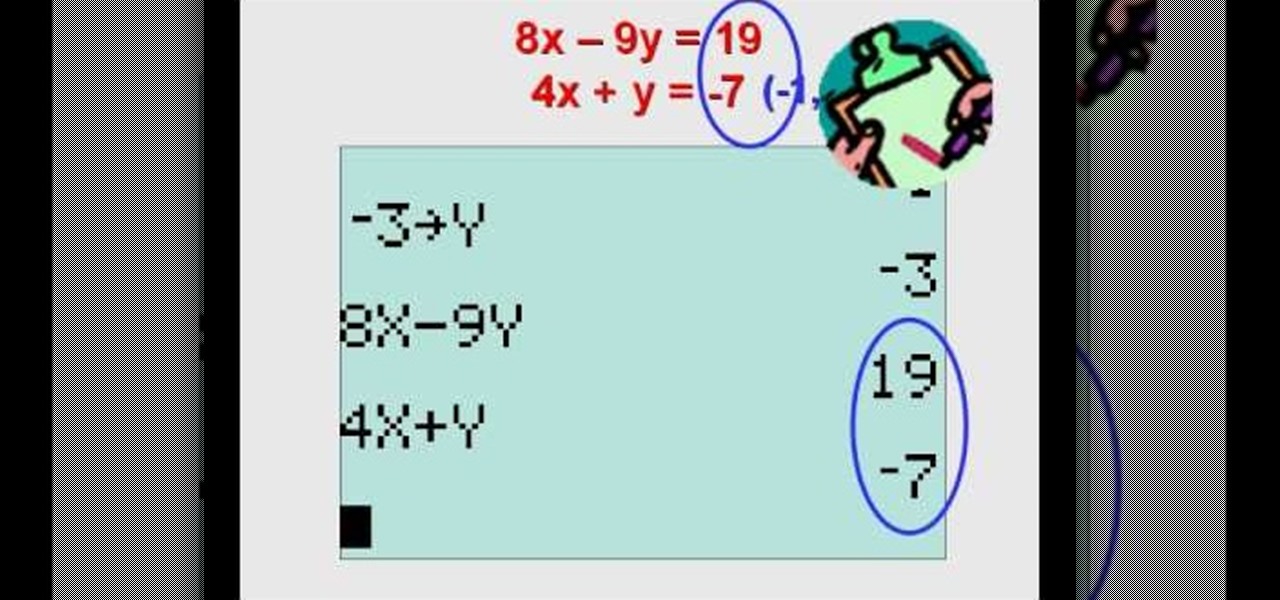
gdawgenterprises.com The video shows how to solve systems of linear equations on a TI83 or TI84 series graphing calculator. Emphasis is given to solving for y in order to graph and also checking the answers.
In this video the instructor shows how to sketch the graph of x squared and square root of x. The first equation is the x squared which is y = x * x. Now to sketch this take a sample values of x and substitute in the equation to get the value of y. Similarly find the set of points for the equation. Finally plot these points and sketch this graph which is in the form of a parabola. The curve is in the form of alphabet 'U' with its vertex at the bottom. Now similarly take the square root of x e...
In this video the instructor shows how to solve systems of linear equation by graphing. A system of linear equation is equations of two lines that are to be graphed on the same coordinate axes. Now take the first equation and write it to form y = mx + b. Now extract the value of slope m and graph the line as shown in the video. Similarly graph the equation of the second line as shown in the video. Now if the two lines intersect at a point, that point is the solution to the system of that line...