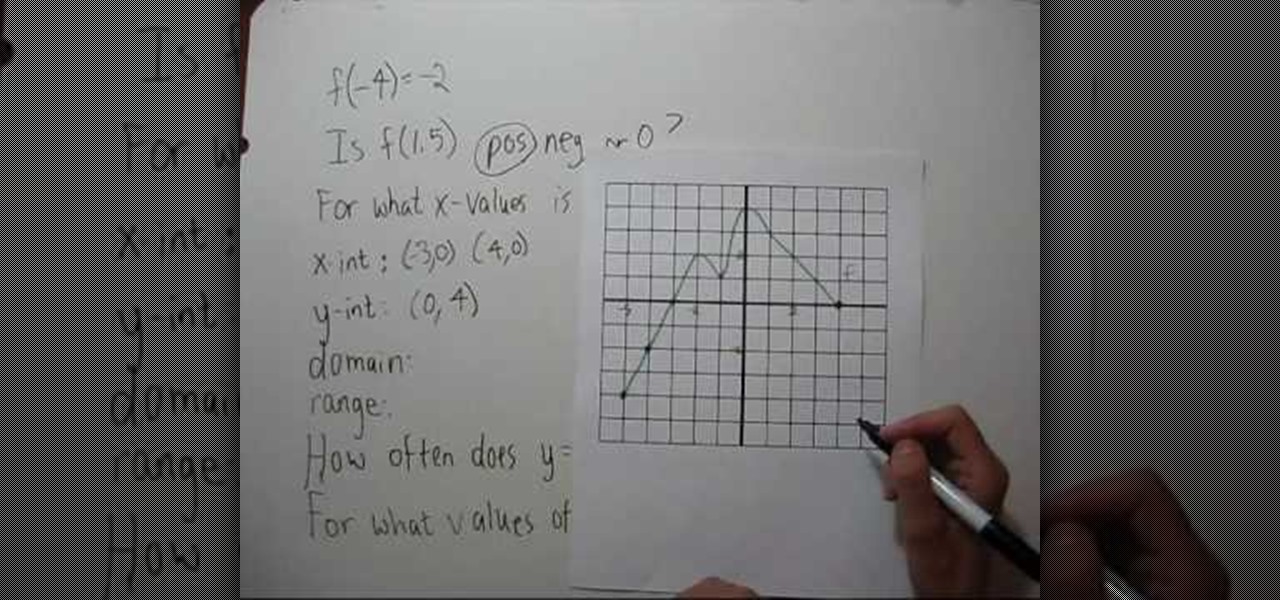
YouTube user NotesCollegeAlgebra teaches you how to interpret a graph. You will learn how to read it and extract information. You go to the graph to see that f(-4)=-2. f(1.5)=2, so it's positive. You then have the question: For what x-values is f(x)<0? You go to the graph and see that you come up with (-5,3). The x-int is (3,0) (4,0). The y-int is (0,4). The domain is (-5,4) and the range is (-4,4). You then have the question: how often does y=7/5 intercept the graph? The answer is 4 times. T...
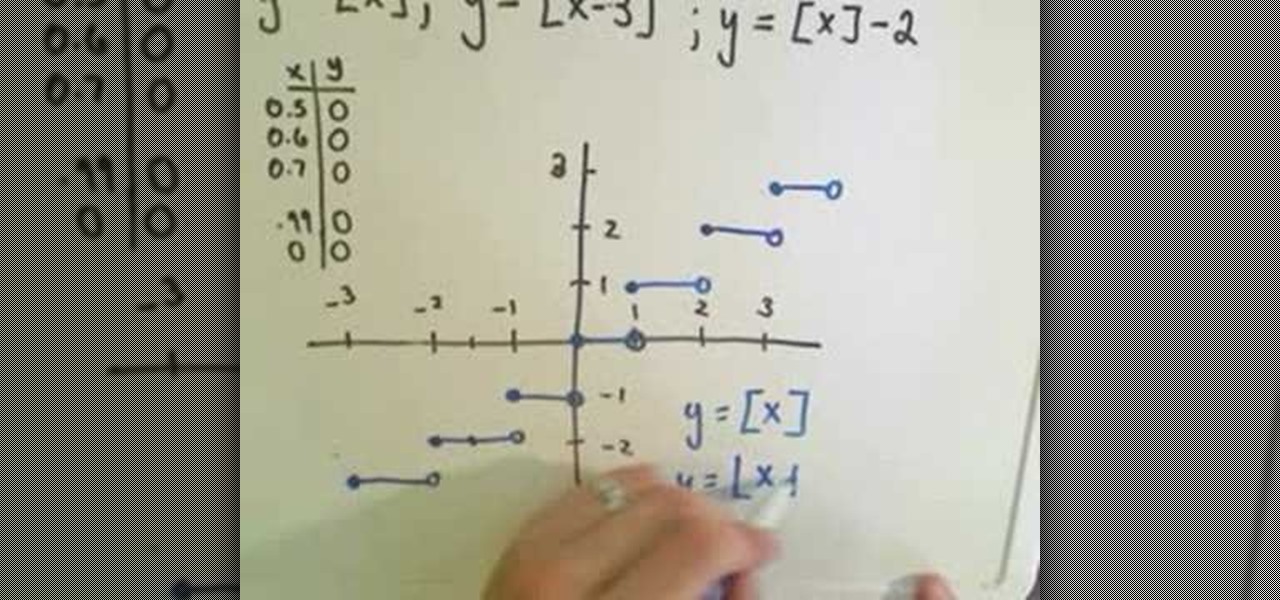
The video shows the explanation of greatest integer function. This video explains this with the help of graphs. The video first describes the basic greatest integer function. This means the greatest integer less than or equal to the number gave. The graph of this function is drawn. The video then shows the variations of this function. The first variation shows the function that replaces the 'x' coordinate with it subtracted by three. This shifts the graph to the right by three units. The seco...
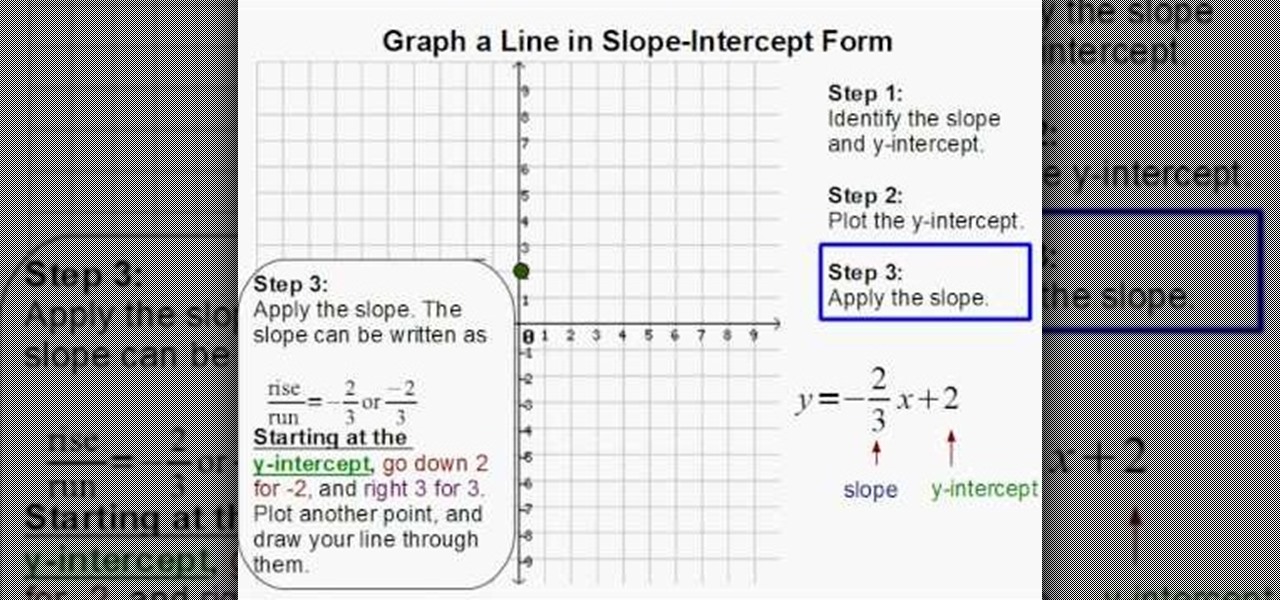
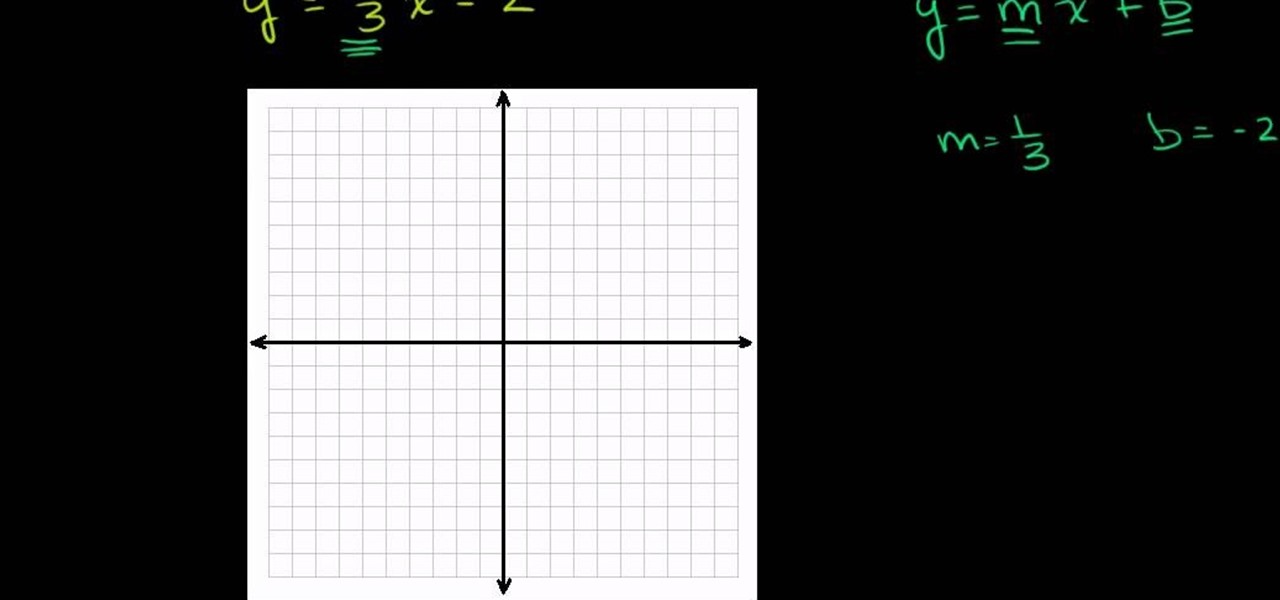
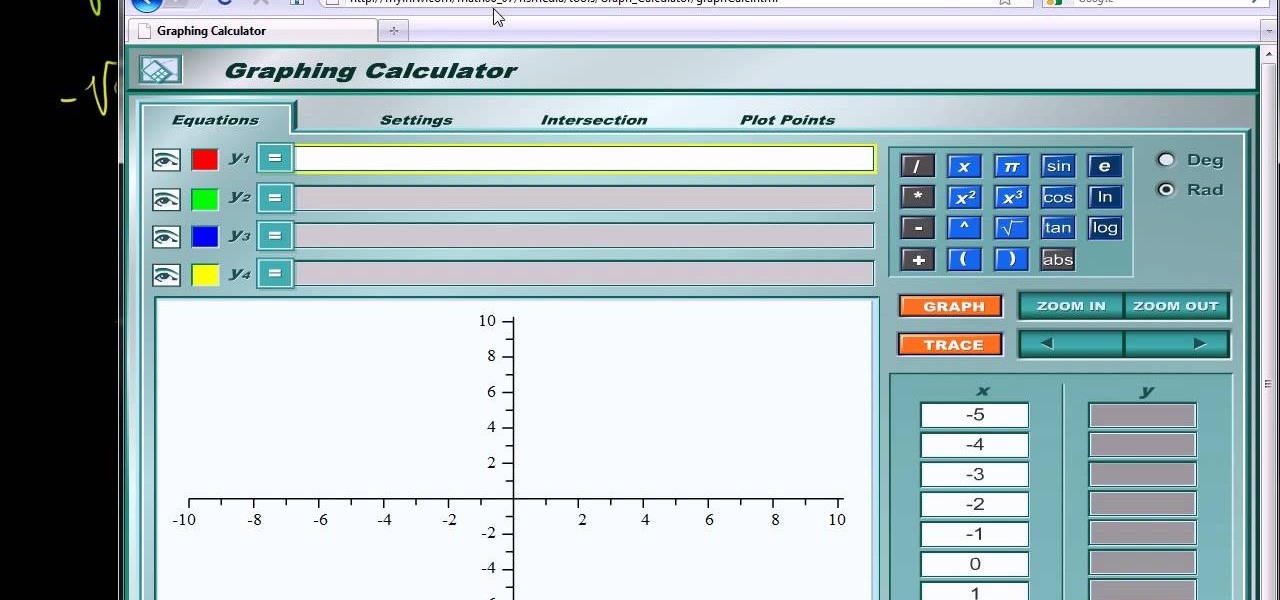
Graphing a line in slope-intercept form is easy in simple after watching this video. In this math tutorial, you'll be guided step-by-step how to graph a line from an equation in the y=mx+b format. The steps include determining the slope and the y-intercept, plotting the y-intercept on the graph, and finally applying the slope to connect the points. The video guides you through the entire process by illustrating and demonstrating all the necessary steps, thus making graphing a snap.

Texas Instruments is one of the best known companies for creating graphing calculators. In this video tutorial you will see how to use a little known feature that lets you create pretty elaborate drawings on it. This is a great time-waster in math class! Who needs algebra or geography anyways? Art class is what you need, art class on a graphing calculator.
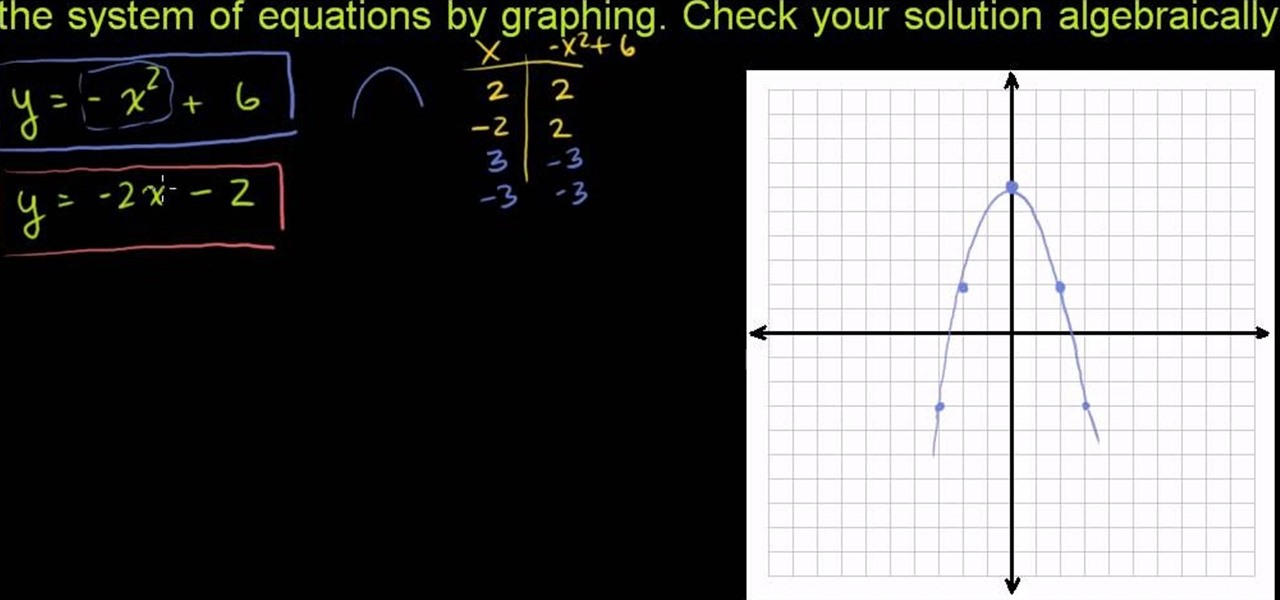
From Ramanujan to calculus co-creator Gottfried Leibniz, many of the world's best and brightest mathematical minds have belonged to autodidacts. And, thanks to the Internet, it's easier than ever to follow in their footsteps (or just finish your homework or study for that next big test). With this installment from Internet pedagogical superstar Salman Khan's series of free math tutorials, you'll learn how to solve non-linear systems of equations in algebra.
Given a equation of a line, you can graph the line. A system of equations is nothing but equations of more than one line. In a single equation all the points that lie on the line, satisfy the equation of the line. Similarly a solution of a system of equations is points that satisfy each and every equation of that system. A system of equations can have a single point as solution when the lines intersect at a common point, or have a unlimited points in solution when the lines overlap on each ot...

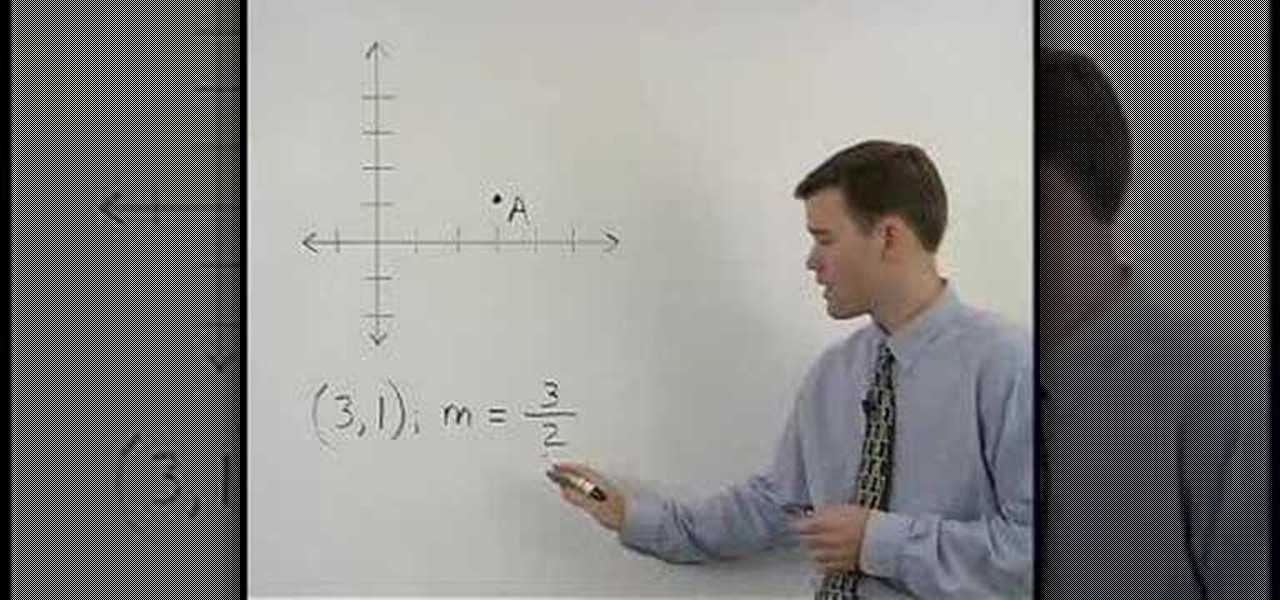
Given a point through which a line passes and the value of its slope you can graph the line. To do this first plot the given line. Now taking the slope and using the rise over run method plot a second point. Connect these two points and this gives you the graph of the line. Extend this line further on both sides to get the complete line. The point where this line cuts the x-axes is called the x-intercept and the point where this line cuts the y-axes is called the y-intercept. The important po...
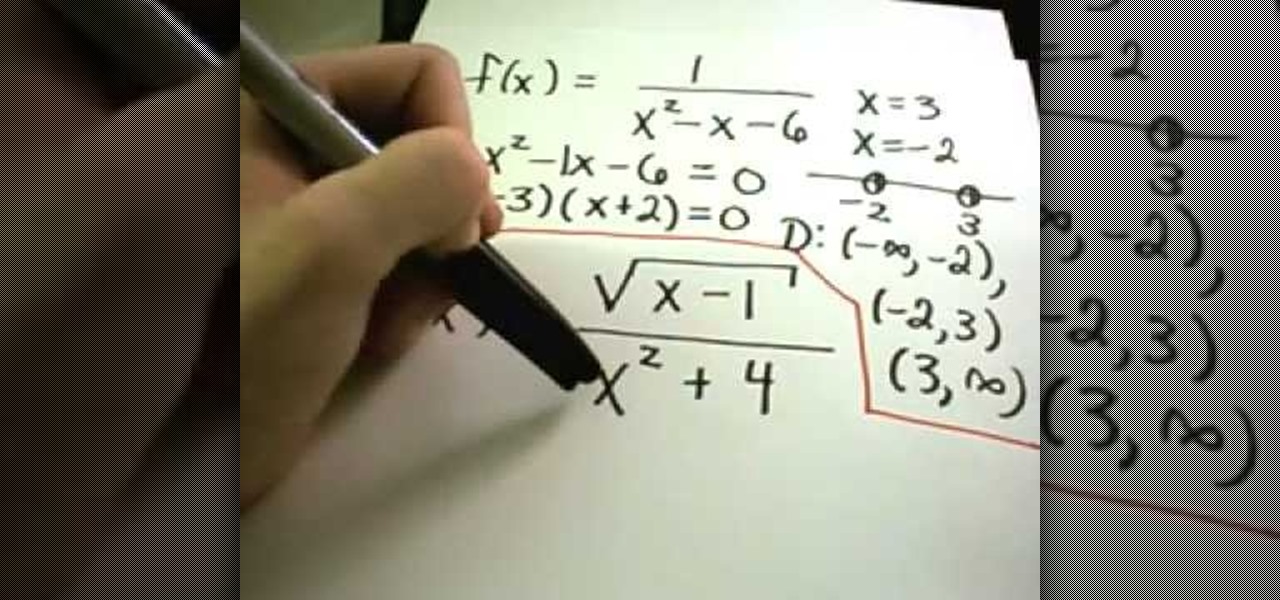
From Ramanujan to calculus co-creator Gottfried Leibniz, many of the world's best and brightest mathematical minds have belonged to autodidacts. And, thanks to the Internet, it's easier than ever to follow in their footsteps (or just study for that next big test). With this two-part installment from Internet pedagogical superstar Salman Khan's series of free math tutorials, you'll learn how to graph a rational function in college-level algebra.
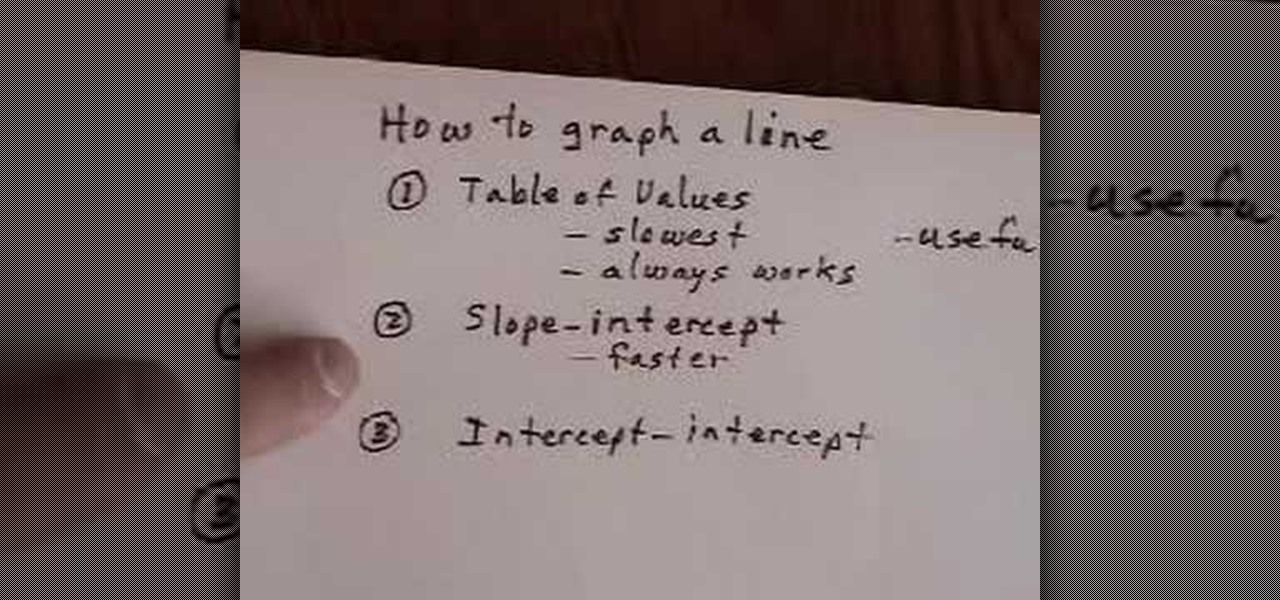
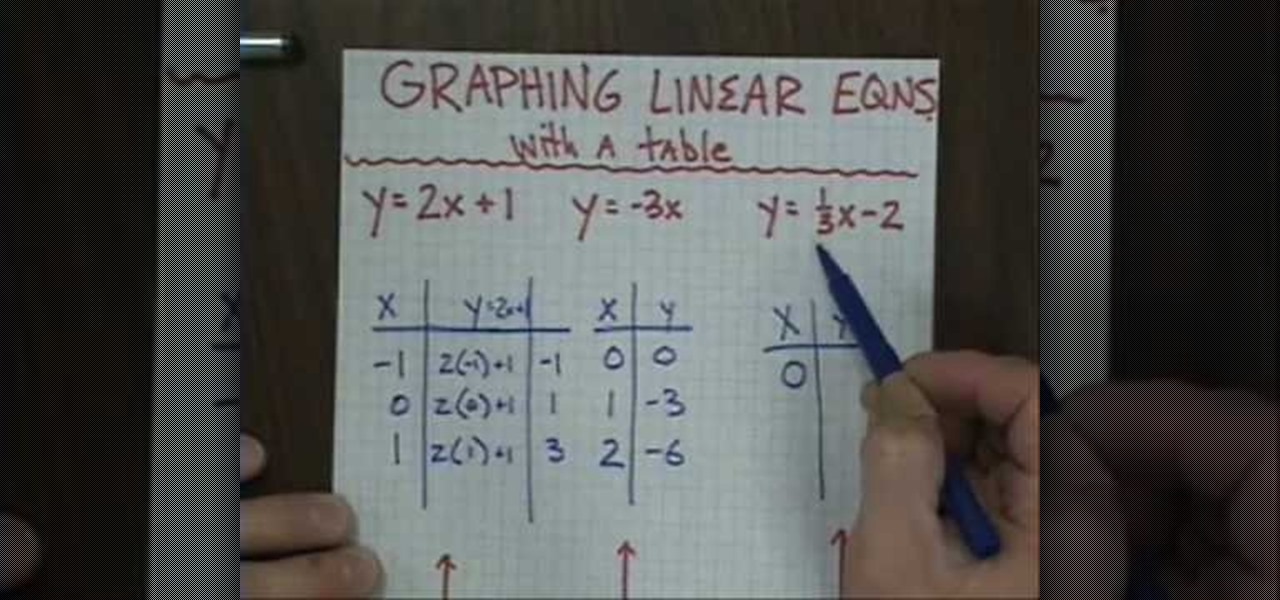
In this video tutorial, viewers learn how to graph a linear equation in 3 different ways. The first way is to use the table of values. It is the slowest method but it always work. It is the most useful. The second way is to use the slope-intercept. It is more faster than the table of values and is very versatile. The third way is to use the intercept-intercept. It is the fastest and easiest method to do. This video will benefit those viewers who are learning about graphing in mathematics and ...
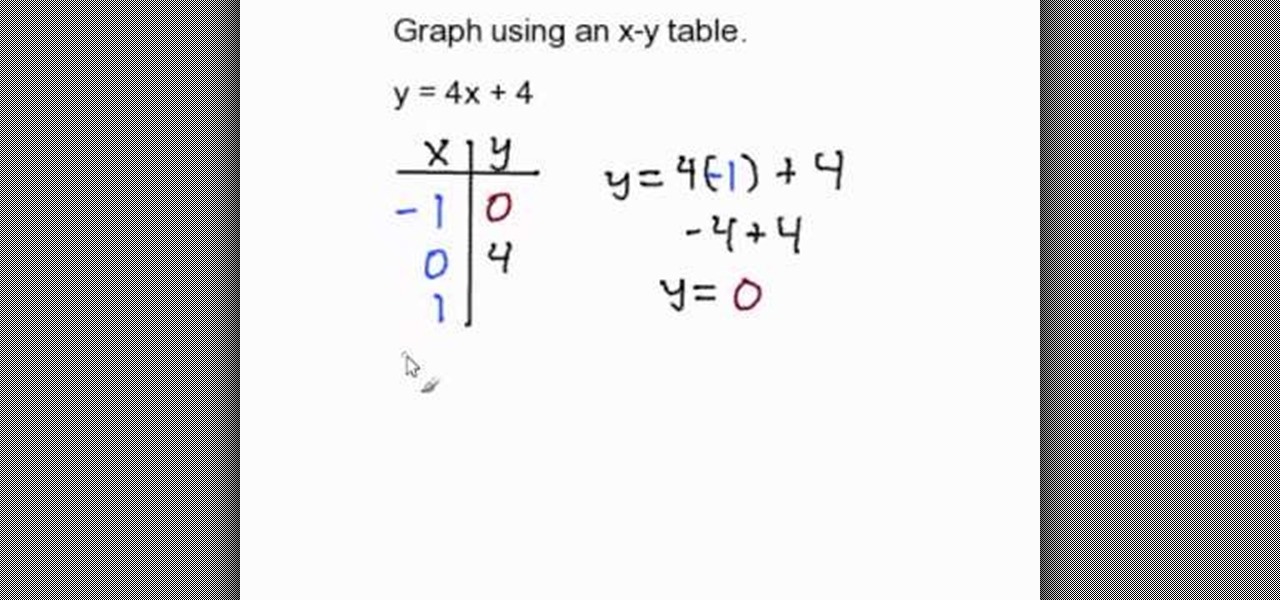
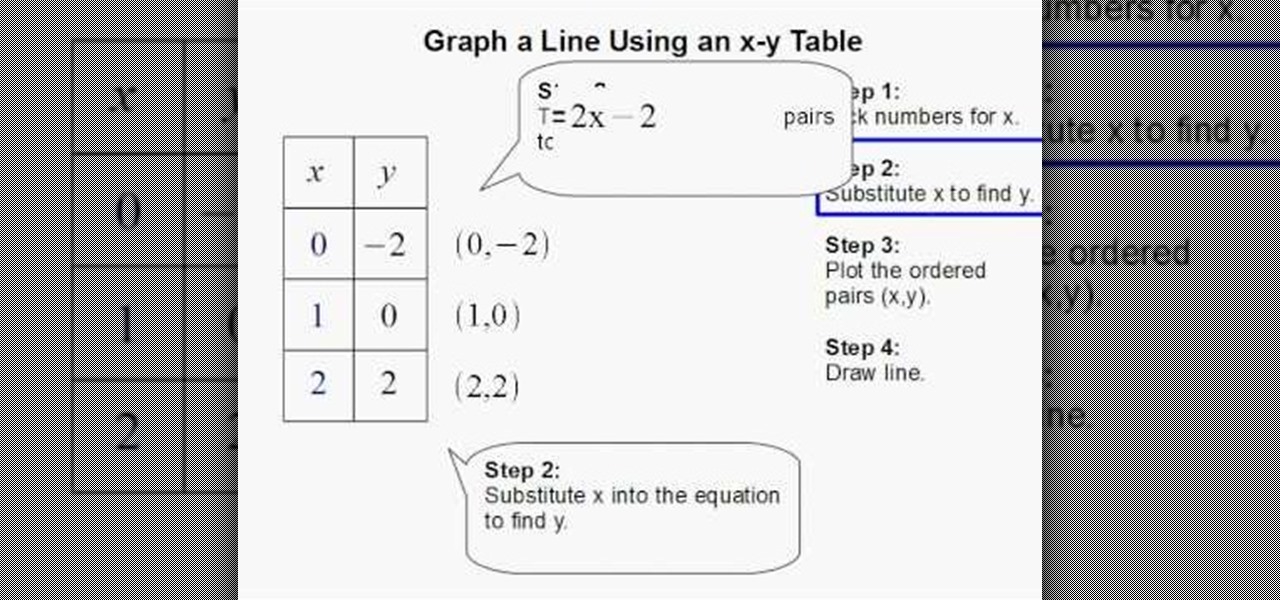
In this video the author shows how to graph using an X-Y table. He shows how to do this with a sample equation. He builds a table of x, y values where he takes sample values for x like -1, 0, 1 and now he substitutes these values in the equation of the line and obtains the corresponding y values. Now finally he has an x, y value table which now he shows how to plot it on a coordinate plane. He plots all the three pairs on the graph and connects them with a line finally obtaining the resultant...
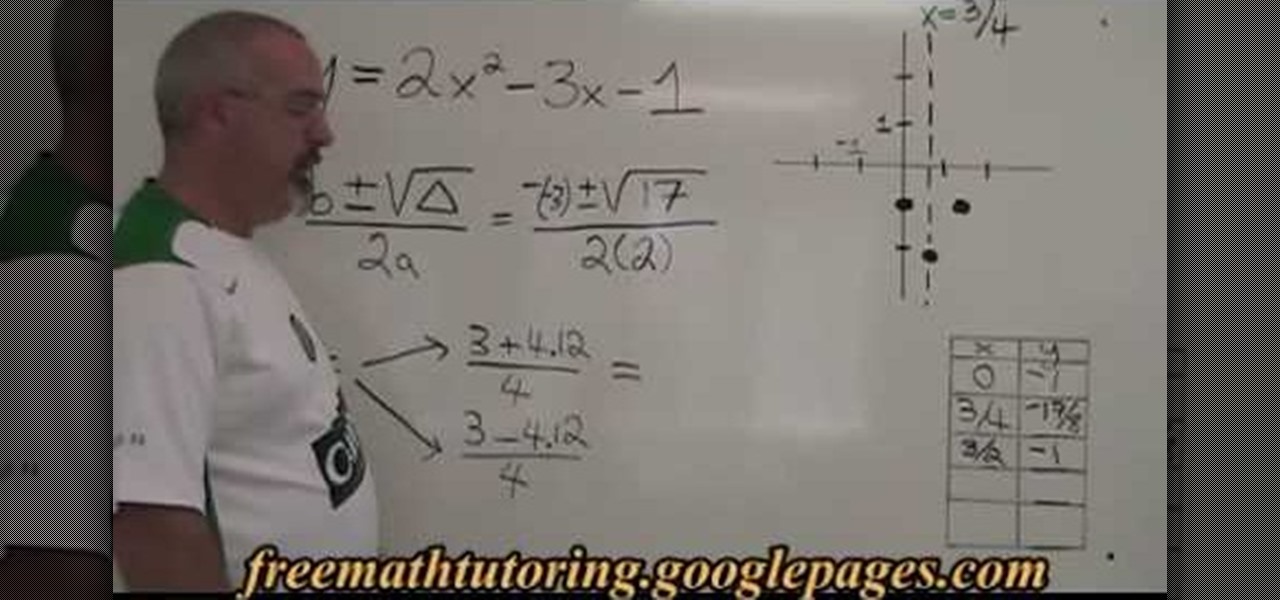
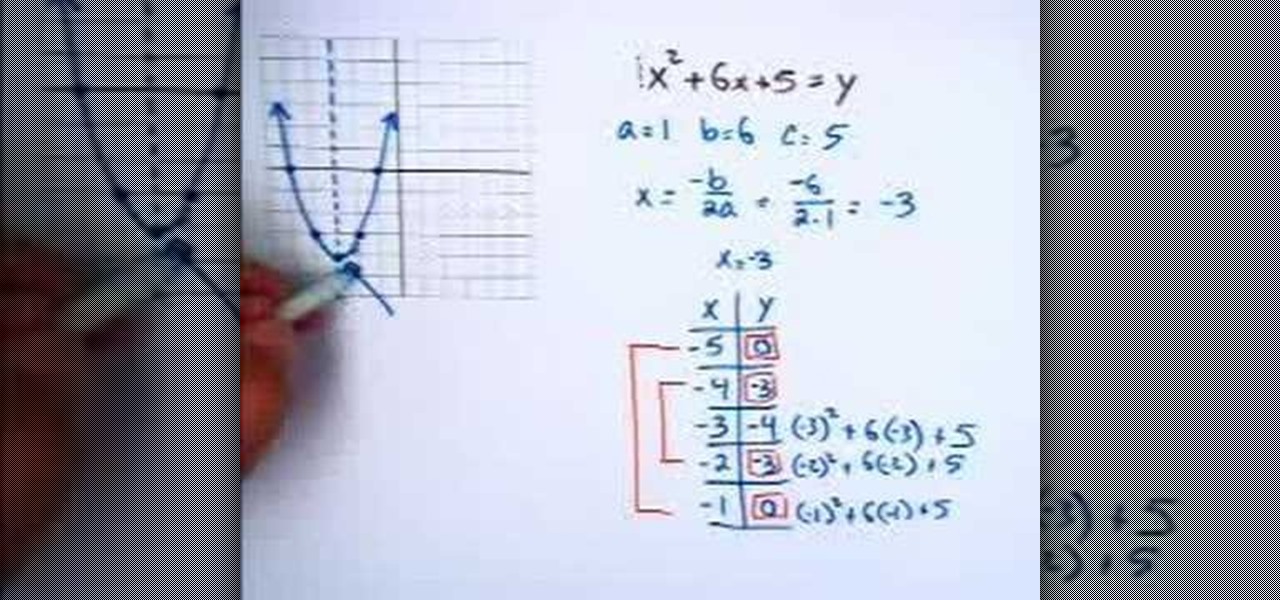
In this tutorial the instructor shows how to graph a parabola and also how to find its roots which are also known as zeroes. He gives the quadratic formula of how to find x-intercepts of a parabola. He takes an example and substitutes the values and finds out the values of the roots of the parabola. Now he substitutes these values in the equation to obtain the corresponding y coordinates. Now using these pairs of values he plots the parabola on a graph and draws it. This video shows how to fi...
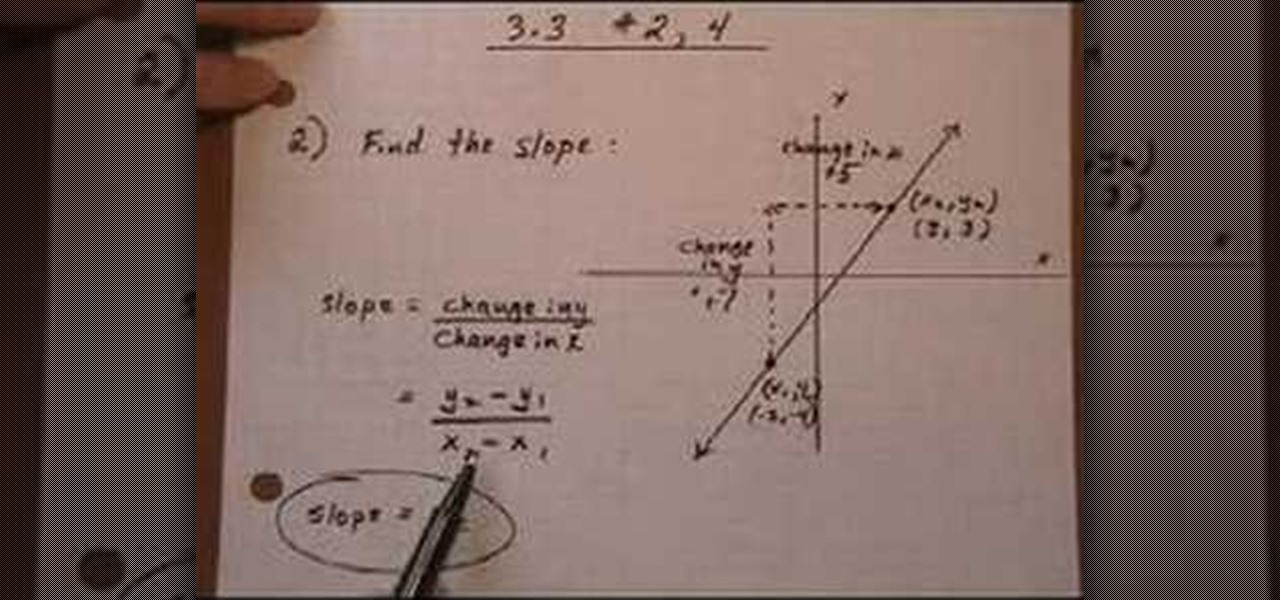
To do this, there are many ways to approach this problem. One way is to look at the change in Y over the change in X by looking at the points on the graph. Another way is to use the equation Y2-Y1 over the equation X2-X1. In other equations where you are given a graph, you may be asked if the slope is positive, negative, or zero. To determine this, look at the line in the context of moving from left to right along the graph. If the line graphed is going down as you move from left to right, th...
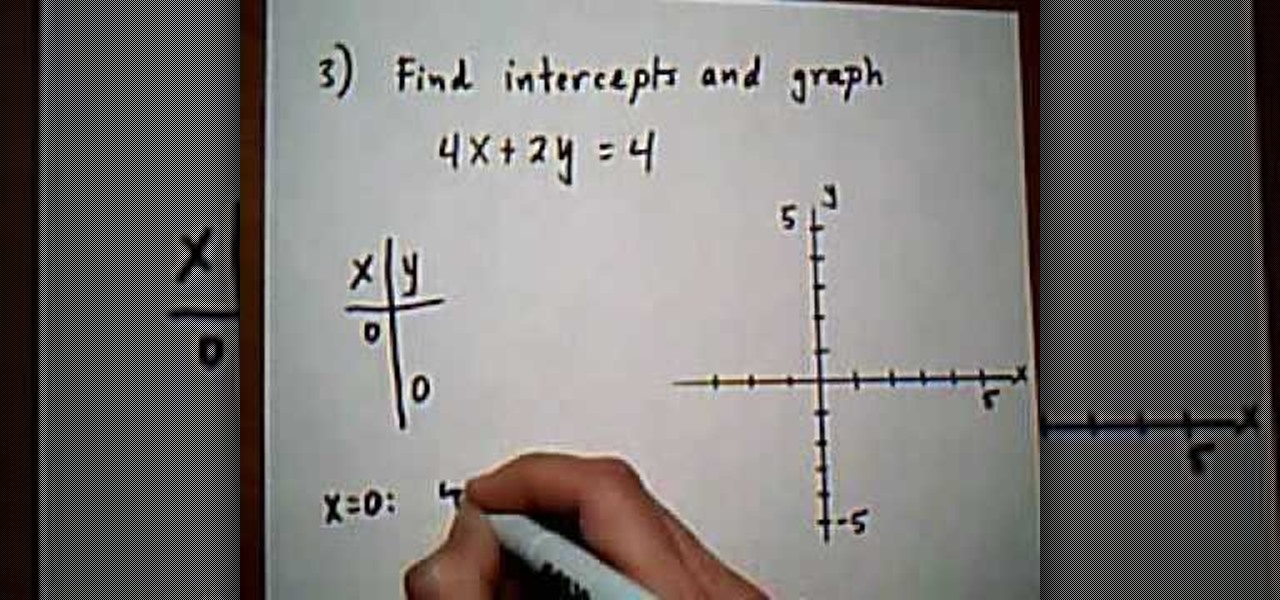
The first question asks for the intercepts x and y. To find X, you would need to set Y to zero, leaving the equation 3X=6. X then equals 2 after you divide both sides by 3. The X intercept that you found is not just the value of 2, but it is the ordered pair X=2 and Y=0 on a graph. To find Y, you would do the same thing, except this time X would be set to 0. In the second example of this video tutorial, you will actually learn how to graph the X and Y intercepts. To do that, you follow the st...
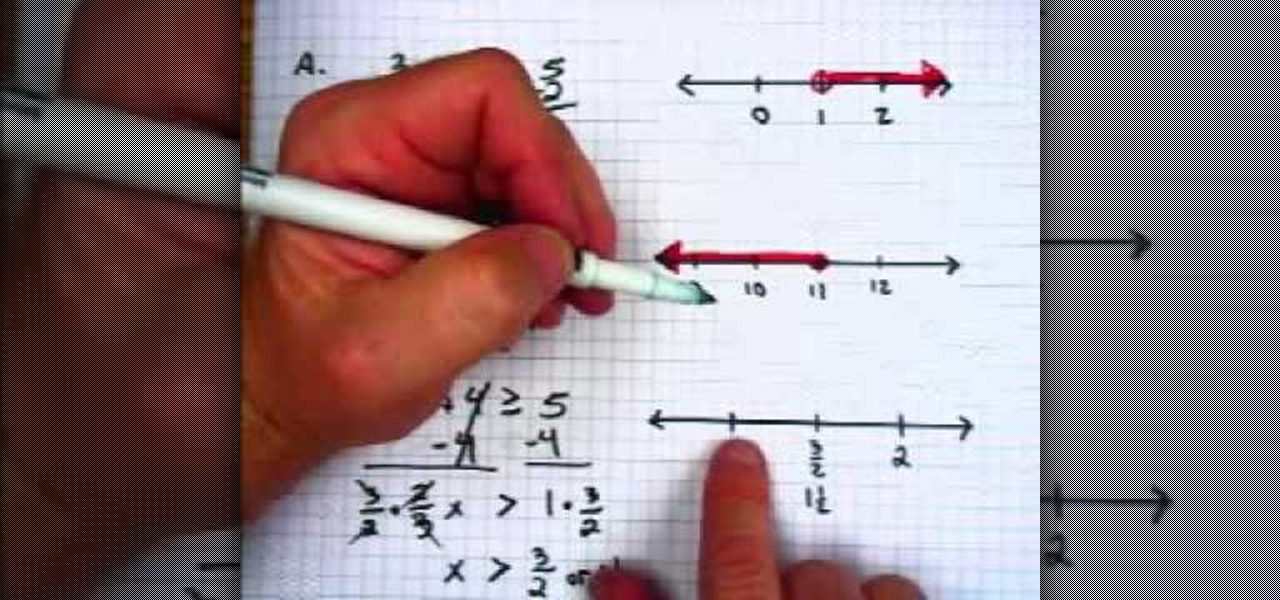
In this video, we learn how to graph inequalities on a number line. Inequalities have a greater than or less than sign instead of an equal signs. Remember that these are no different than figuring out how to graph normal equations. First, you will need to remove the single numbers from each side of the equation. Continue to do math on the equation until you figure out what 'x' is. From here, draw the numbers on your graph and then find the number that 'x' is greater to or less than. Use an op...
In this tutorial, we learn how to make your first graph in Microsoft Excel. First, open a new graph and enter in your data. Click and drag down from the original date you enter to have the other dates automatically entered in. Enter the rest of your information, then highlight all the data. Go to the menu and click "insert", then "chart". Now, go through the chart wizard to select what kind of chart you want to make. When you are finished entering all your preferences, change your values so t...
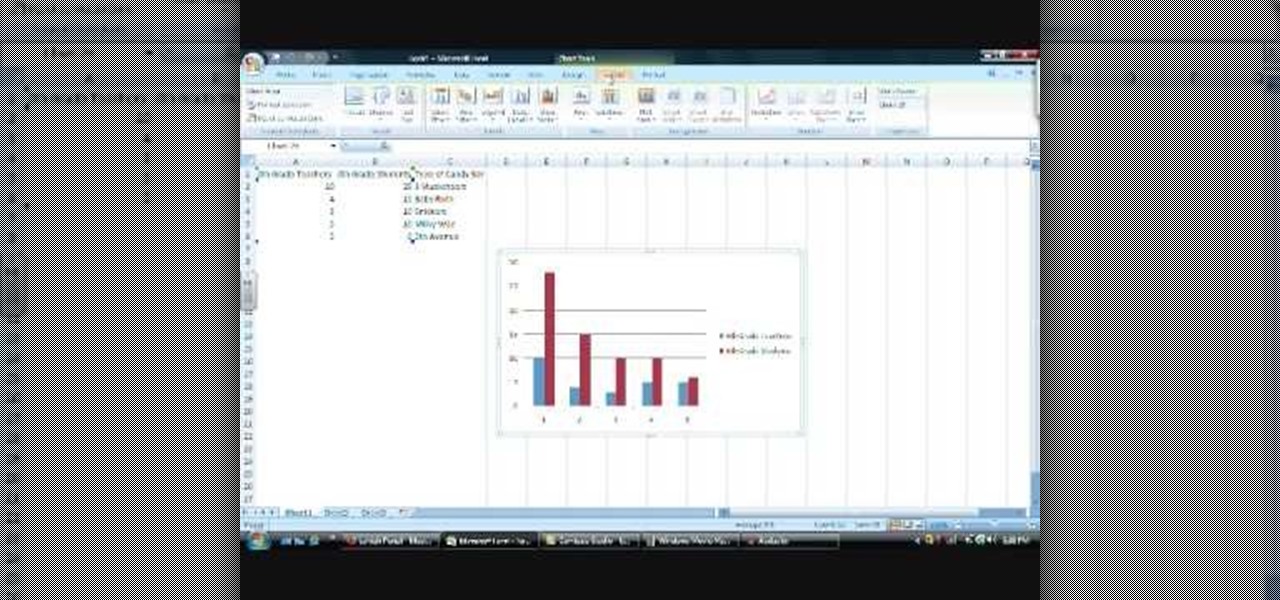
In this Software video tutorial you will learn how to make a basic bar graph in Microsoft Excel. You will also learn how to give your chart a title and how to label the axes. First you put in all your data in to an Excel spreadsheet. Then you highlight the data you want to put in your graph, select the 'insert' tab, then' column' and choose the basic column chart. Next you select the title tab, go to option and choose new title. Now you add the title to the graph. To label the axes, go on top...
This how to video shows you how to graph an inequality in slope intercept form. First, graph the line. Depending on the inequality, use a dash or solid line. Use a solid line for less than or equal to or greater than or equal to. Use a dash line for greater than or less than. If y is less than or less than or equal to, shade the bottom area of the line. If it is y is greater than or greater than or equal to, shade the top area of the line. Check your answer by substituting in any point from t...
Solving the Inequalities using graph, first you have to take the inequality equation into equal. Then convert the equation into straight line equation i-e(y=mx+c). Giving own values for 'x' like (-1, 0, 1) we would get the value for 'y'. By plotting these points in the graph, you will get an straight line. If the given equation is greater than symbol, shade towards the positive part. If the given equation is smaller than symbol, shade towards the negative part. This is an one method to solvin...
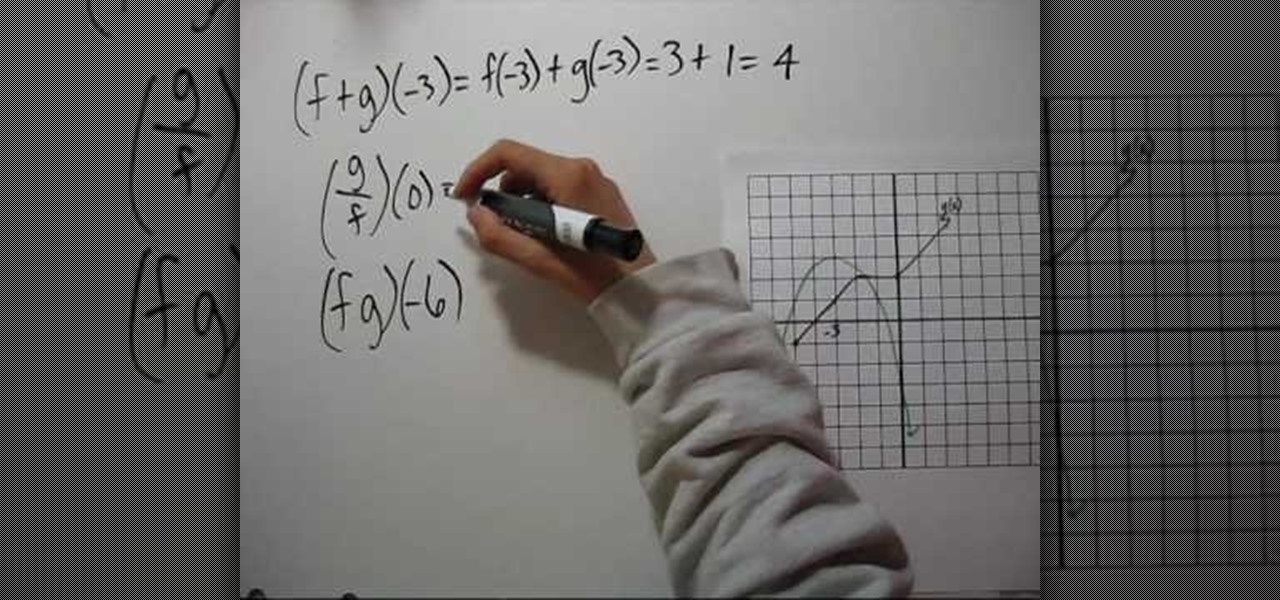
YouTube user NotesCollegeAlgebra teaches you how to evaluate combinations of functions from graphs. You start off with a graph and some functions. (f+g)(-3), (g/f)(0) and (fg)(-6). You start looking at the graph and the first line and you get (f+g)(-3)=f(-3)+g(-3)=3+1=4. (g/f)(0)=g(0)/f(0)=2/-3=-2/3. (fg)(-6)=f(-6)g(-6)=(-3). But then when you want to find out g(-6) you realize -6 is not in g's domain. So the answer to the last equation is that it doesn't exist.
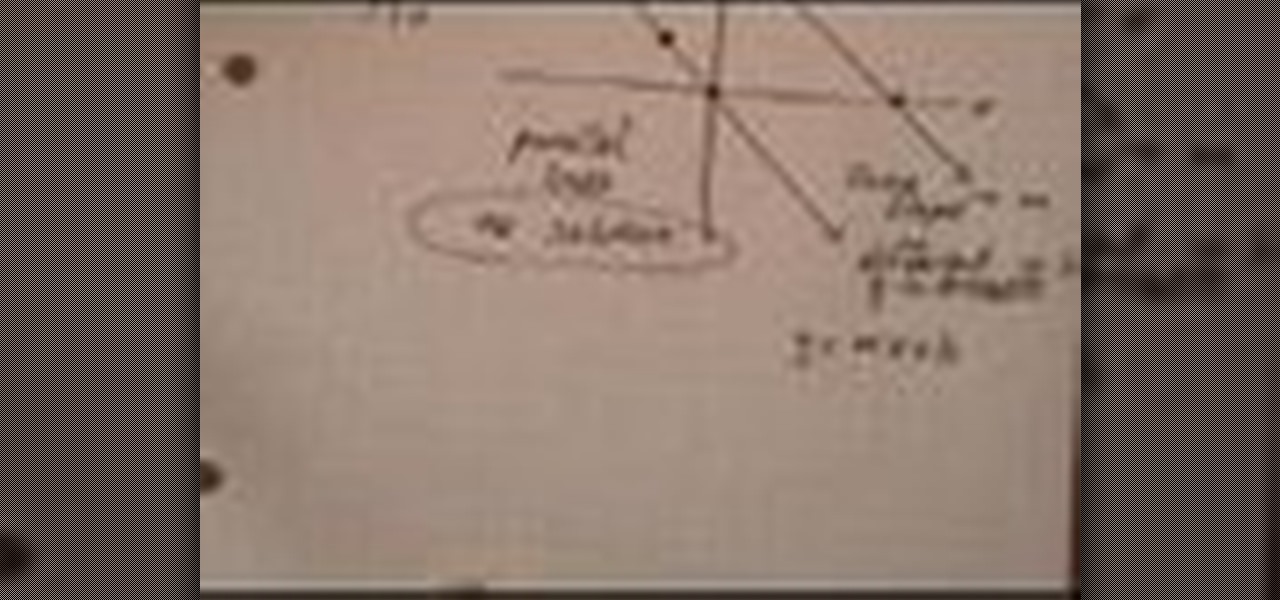
A method for solving a linear system with no solution is described. The method is described in 4 steps. The first step in the method is designed to solve a linear system that is described consist of “solving by graphing”. Details for “solving by graphing” first consist of finding points to graph using two different equations. The second step in the method consist of placing the points from both equations on the same graph in order to find out if bo...
In this video tutorial, viewers learn how to graph a linear equation. The linear equations example used in this video is y= 1/3x-3. The equation to graph a linear equation is y= mx+b. Now substitute each number into the equation. Therefore, m= 1/3 and b= -3. Begin by graphing the Y-intercept. M is the slope and b is the y-intercept. Plot the y-intercept on the -3 axis. Then move up once and to the side 3 times. This video will benefit those viewers who are struggling with this math unit and a...
The author teaches us how to graph the linear equations with tables. Given a set of linear equations in terms of "x and y", first we have to draw a table having a column each for x and y. We have to enter an arbitrary value of x in that table and substitute that value in the given equation to get the corresponding y value. Once you obtain both x and y values, the next step is to plot them in a graph. Consider an example: in the linear equation x=2y,on substituting an arbitrary value of x=2,we...
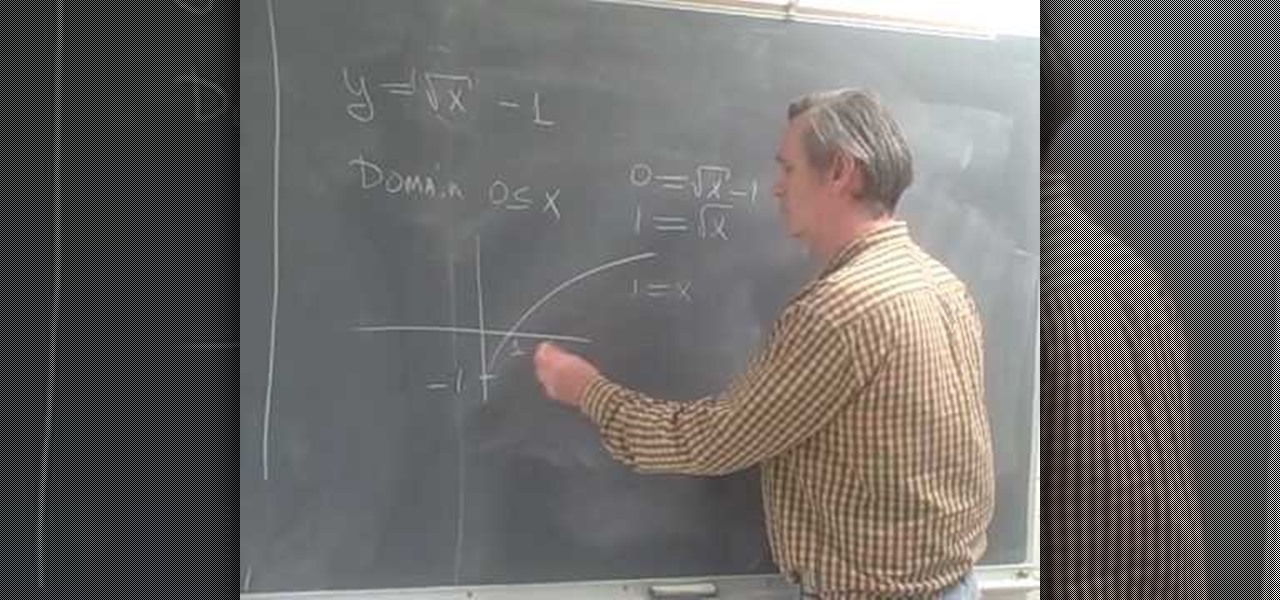
Professor ElvisZap teaches you how to stretch shift and reflect the graph of a square root. A square root function is the opposite of a squared function. You start with y=square root of (x-1) it becomes 0<=x-1. then 1 <=x. You use the graph and solve it as you would for any function using small values first, then you have y=square root of x - 1, the domain 0<=x. This shifted the graph down 1 unit. 0=square root of x - 1, 1=square root of x, 1=x. Then the range is [-1 + infinity). Continue in ...
This video shows the method to graph a linear function by finding the X and Y intercept. Only two points are needed to graph linear functions. So we find the point on Y axis or the Y intercept and the point on the X axis or the X intercept. We notice that on the Y axis the X coordinate is zero. So, we find the Y intercept by putting x=0 in the given equation and solving for y. In the same way, we find the X intercept by putting y=0 in the given equation and solve for x. We join the two points...
In this video, the instructor shows you how to graph quadratic equations. When you have a quadratic equation in terms of x and y, first try to identify the coefficients of the terms. Now use front end of the quadratic formula to find the line of symmetry which is the first half of the vertex using the formula x = -b/2a. This gives the line of symmetry. Next, plot the line using a few points starting at the line of symmetry. Take sample values of x and find the corresponding values of y on eit...
This video teaches us to draw the graph of a piecewise function. This is shown using two examples. In the first example we have 'y' equal to 'x + 2' for x less than zero and '1 - x' for x greater than equal to zero. We plot two points on the function for x less than zero and do the same for the function with x greater than equal to zero. The graph for the first function is erased for x greater than equal to zero, and the same is done for the second function for x less than zero. Note that the...
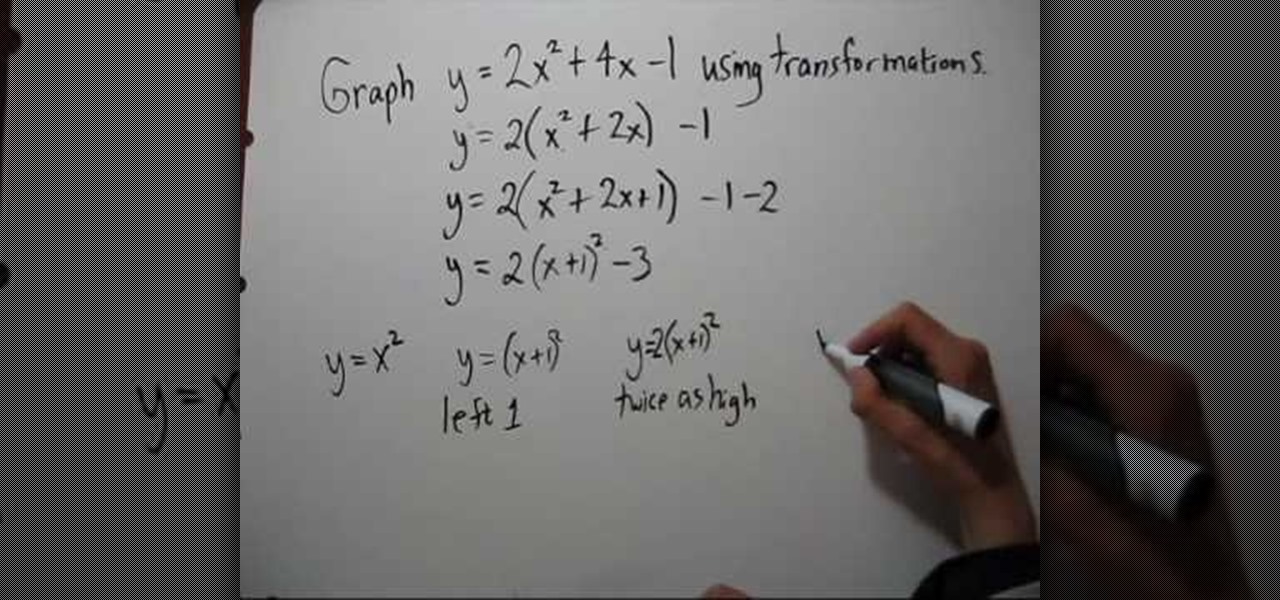
In this tutorial the instructor shows how to complete the square to graph a quadratic function using transformations. You can do this by transforming your equation in a series of steps. First make the coefficient of the square term to one by pulling out its numerical coefficient. Now to complete the square of the first part add half the coefficient of the variable with a degree one. Now to maintain the original value of the equation also make sure that you subtract the same value from the equ...
This video shows you how to graph an equation in standard form. In easy to understand instructions, you will learn how to find the x and y intercepts in order to put those two points on a graph, creating a line. Finding the intercepts is as easy as plugging in zero and solving for either x or y. This creates an ordered pair, which can then be graphed. The points are plotted easily on a Cartesian plane, which completes the problem.
In this video the instructor shows how to graph a line using X-Y table values. He specifies a four step approach. In the first step he picks numbers for the value of x. In the next step he substitutes the values of x in the equation of the line to obtain the corresponding y values, in the third step he plots these ordered pairs on a graph sheet. Finally in the fourth step he joins them resulting in a straight line for the given equation. This video clearly shows how to graph a line using an X...
In this clip, you'll learn how to view graphs of statistical data from around the world with Gapminder.com. The website, you'll find, is diverting, often thought-provoking, and easy to use. For more information, including detailed instructions on how to use the site yourself, watch this video tutorial from the folks at Tekzilla.
Need to graph a line in slope-intercept form (y=mx+b)? See how it's done with this free video math lesson. Need help finding the From Ramanujan to calculus co-creator Gottfried Leibniz, many of the world's best and brightest mathematical minds have belonged to autodidacts. And, thanks to the Internet, it's easier than ever to follow in their footsteps (or just finish your homework or study for that next big test). With this installment from Internet pedagogical superstar Salman Khan's series ...
Want to find the domain of a function without graphing it? Learn how with this free video lesson. From Ramanujan to calculus co-creator Gottfried Leibniz, many of the world's best and brightest mathematical minds have belonged to autodidacts. And, thanks to the Internet, it's easier than ever to follow in their footsteps (or just finish your homework or study for that next big test).
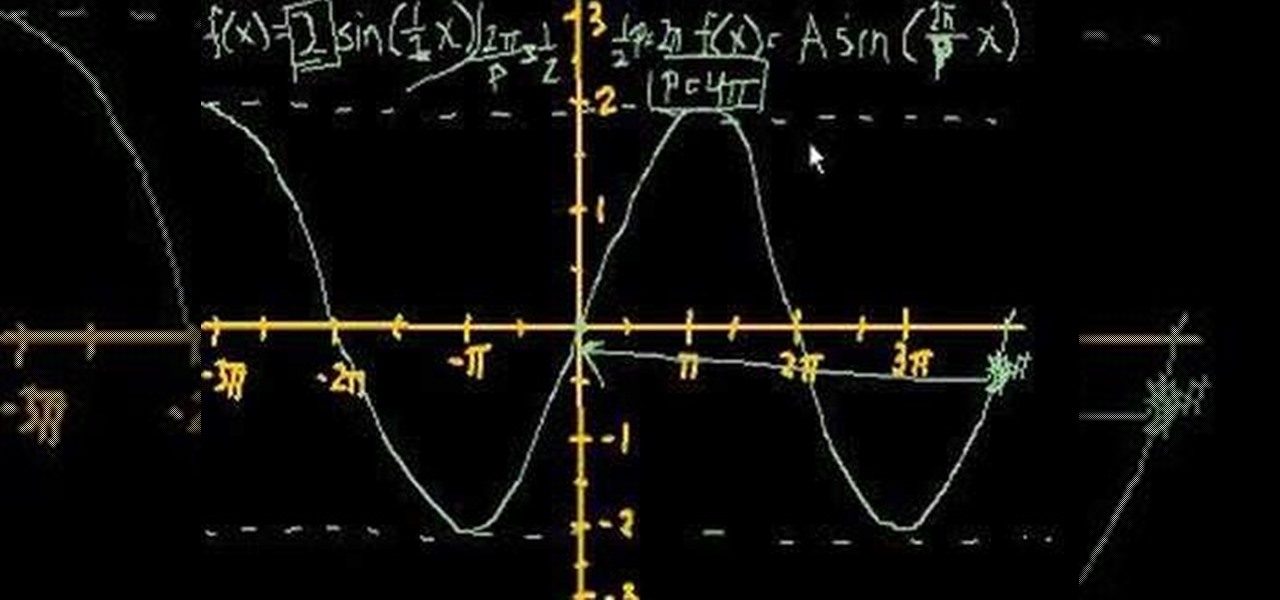
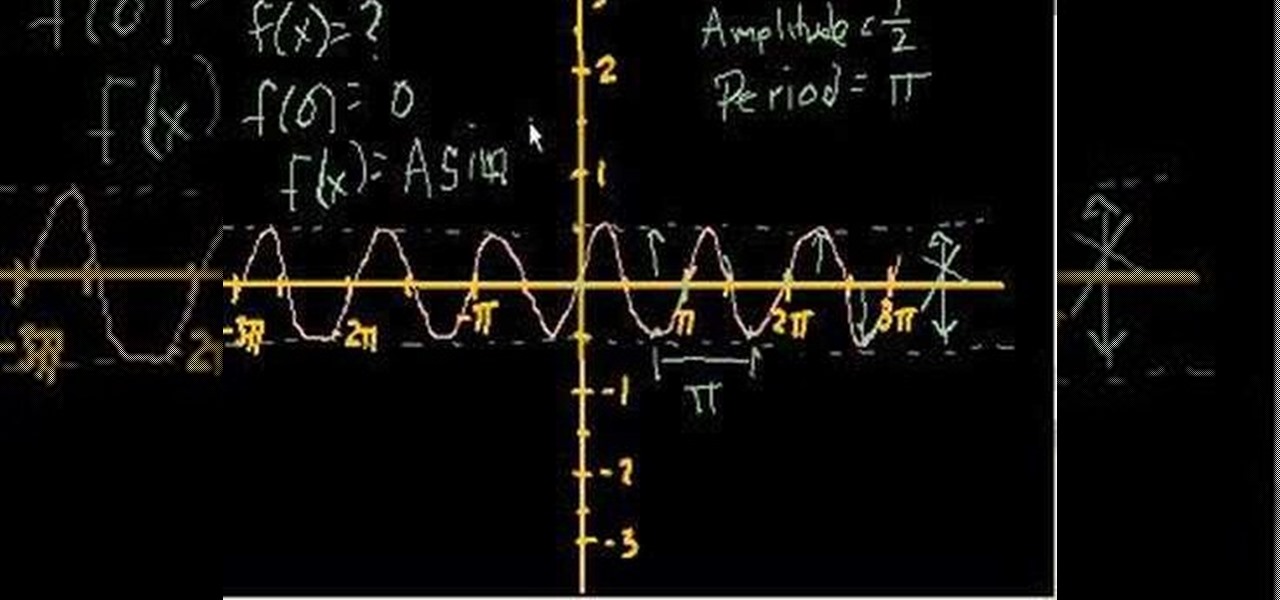
Learn how to graph the amplitude and periods of sine and cosine functions in basic trigonometry. Learn how to use trigonometric functions to calculate the sides of a right triangle. Need to know how to solve a matrix-form linear equation in algebra? From Ramanujan to calculus co-creator Gottfried Leibniz, many of the world's best and brightest mathematical minds have belonged to autodidacts. And, thanks to the Internet, it's easier than ever to follow in their footsteps (or just finish your h...
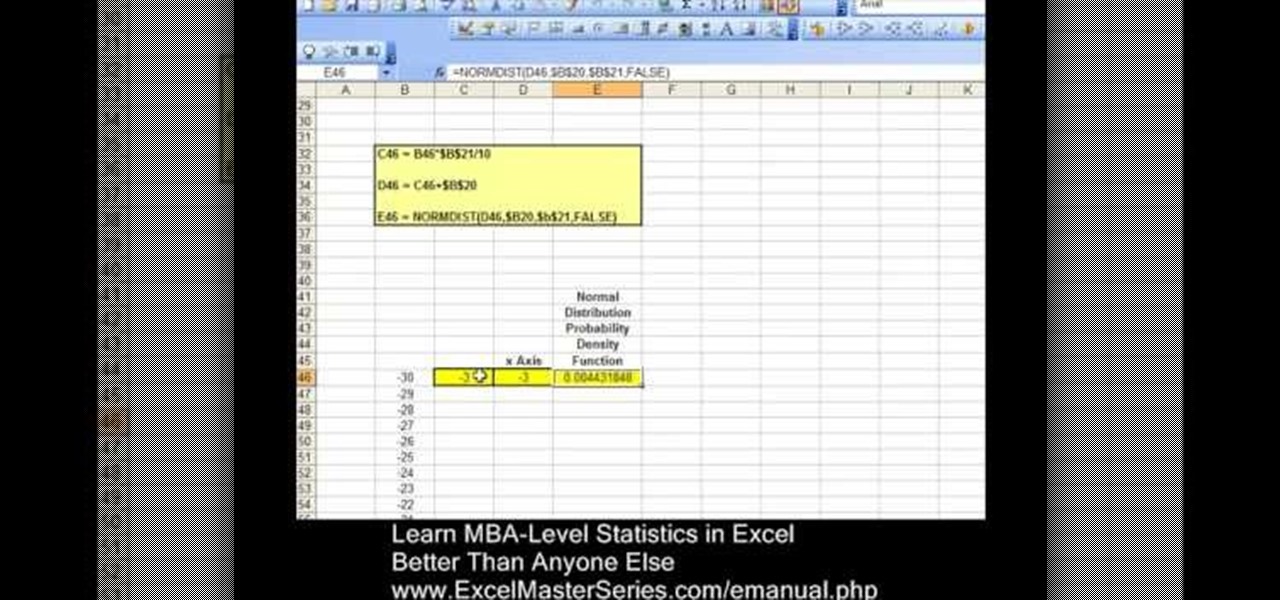
One of Microsoft Excel's capabilities is to allow you to graph Normal Distribution, or the probability density function, for your busines. This is a quick and easy tracking feature you can learn in just a few minutes.
In order to format graphs and charts using Microsoft Word 2007, click on Chart Tools. The tabs at the top of the screen provides you with your options. You can change the type of chart or graph by clicking on Change Chart Type. If there is a particular type of chart that you would like to use again and again, then you can save it as a template via the Save As a Template icon. You can edit the data in your chart of graph by clicking on Edit Data. You can modify the chart layout by clicking on ...
Learn how to use the unit circle definition of the sine function to make a graph of it. From Ramanujan to calculus co-creator Gottfried Leibniz, many of the world's best and brightest mathematical minds have belonged to autodidacts. And, thanks to the Internet, it's easier than ever to follow in their footsteps (or just finish your homework or study for that next big test). With this installment from Internet pedagogical superstar Salman Khan's series of free math tutorials, you'll learn how ...
Need to know how to determine the equations of trigonmetric functions by inspecting their graphs? Learn how. Learn how to use trigonometric functions to calculate the sides of a right triangle. Need to know how to solve a matrix-form linear equation in algebra? From Ramanujan to calculus co-creator Gottfried Leibniz, many of the world's best and brightest mathematical minds have belonged to autodidacts. And, thanks to the Internet, it's easier than ever to follow in their footsteps (or just f...
From Ramanujan to calculus co-creator Gottfried Leibniz, many of the world's best and brightest mathematical minds have belonged to autodidacts. And, thanks to the Internet, it's easier than ever to follow in their footsteps (or just study for that next big test). With this installment from Internet pedagogical superstar Salman Khan's series of free math tutorials, you'll learn how to sketch the graph a square root function.
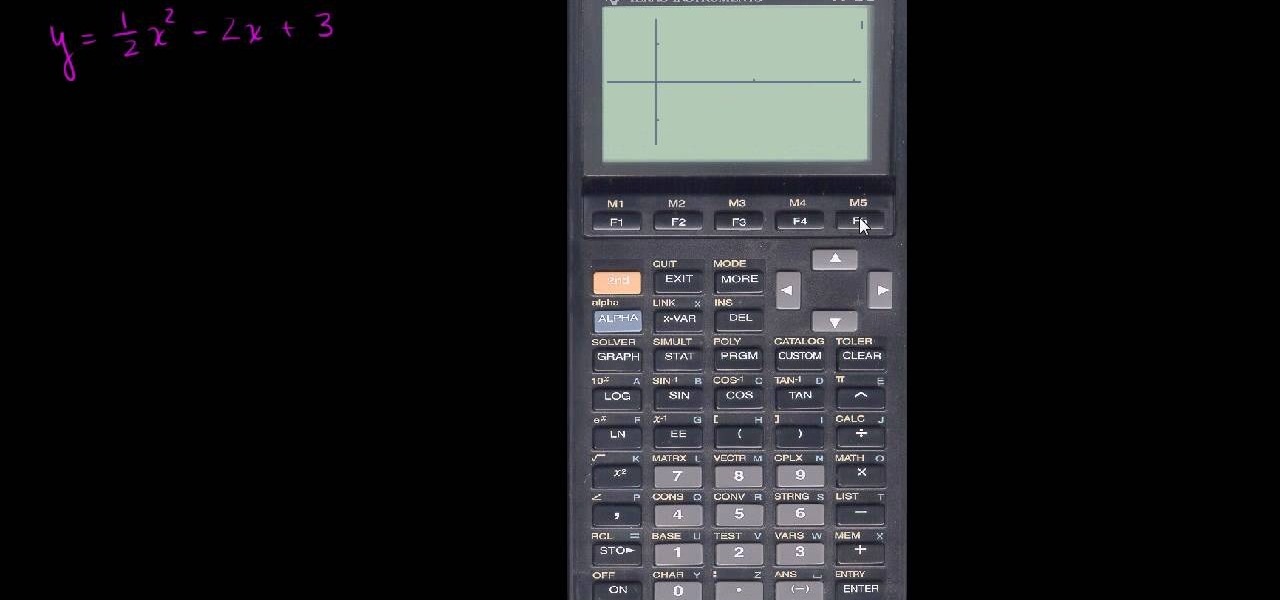
This video walks you through the steps of solving quadratic equations with a graphing calculator. This excellent video shows you a clean blackboard, with the instructors voice showing exactly what to do. Don't fret, any question you may have, will be answered. Watching this video will make you feel like your back in the classroom but rather comfortably from your home.
This video walks you through the steps of graphing quadratic funtions. This excellent video shows you a clean blackboard, with the instructors voice showing exactly what to do. Don't fret, any question you may have, will be answered. Watching this video will make you feel like your back in the classroom but rather comfortably from your home.