
How To: Fold a transforming shuriken ninja star
Hi, welcome to this origami video! This origami video is a great tutorial on how to make a transforming shuriken(ninja disk).

Hi, welcome to this origami video! This origami video is a great tutorial on how to make a transforming shuriken(ninja disk).
What's the best way to get real handcuffs without actually buying them? Well, use fake handcuffs, that is... they're cheaper. This con video tutorial will show you how to transform fake handcuffs into inescapable ones.
Developed by the same team of engineers responsible for LightWave 3D, modo, lowercase, delivers the next evolution of 3D modeling, painting and rendering in a single integrated and accelerated package for the Mac and PC. And now, modo is a true end-to-end solution that includes true 3D sculpting tools, animation and network rendering! More than just features, modo is a truly elegant integration of technology, raw horsepower and refined workflow. With such a wealth of inbuilt features, however...

Inspired by French sex siren Brigitte Bardot, Jennifer Aniston plays up the sex bombshell angle in the new February issue of "Allure." Wearing little more than a PJ set completely unbuttoned up front, she exudes an effortless glamour.

Japanese Gyaru girls dress up like little girls or dollies. It's a popular look that's definitely easier to wear than some of Japan's other fashion trends, like Goth Lolita or Ganguro.

Leopard print is one of the newest trends, and you can easily create your own leopard print style garment at home. All you need is a basic white T-shirt (or whatever you want to dye), the dye itself and a few other accessories.

This hairstyle is taken directly from the current trends for runway models. Backcomb your hair first to give it a little body, then follow the steps to clamp your hair and hold it in place to achieve the disheveled ballerina look.

Back in the '40s through the '60s, it took very little effort for gorgeous starlet Audrey Hepburn to start new trends. Whether she was sporting a short pixie cute (as in "Roman Holiday") or wearing buggy sunglasses (vide "Breakfast at Tiffany's"), Hepburn was always on the cutting edge.

Fringes are definitely trendy this season, and you can jump on the trend bus without breaking the bank! You can turn an old T-shirt into a fashionable fringed scarf just by making a few cuts. Pick a shirt as colorful as you want!

Visual kei, as with all popular Japanese fashion and makeup movements, started in the Harajuku district of Japan. This particular trend is mostly practiced among musicians who favor a very ostentatious and sometimes androgynous look with heavy, monstrous makeup.

Golden girl Jennifer Aniston never skips a fashion beat on the red carpet (maybe because she 9 times out of 10 wears black, which we know is never not flattering?), but when she stepped foot onto the red carpet last year at an event, she once again started a "Rachel" hair trend.

If you use Microsoft Excel on a regular basis, odds are you work with numbers. Put those numbers to work. Statistical analysis allows you to find patterns, trends and probabilities within your data. In this MS Excel tutorial from everyone's favorite Excel guru, YouTube's ExcelsFun, the 45th installment in his "Excel Statistics" series of free video lessons, you'll learn how to see how to calculate a z-score.

If you use Microsoft Excel on a regular basis, odds are you work with numbers. Put those numbers to work. Statistical analysis allows you to find patterns, trends and probabilities within your data. In this MS Excel tutorial from everyone's favorite Excel guru, YouTube's ExcelsFun, the 35.2nd installment in his "Excel Statistics" series of free video lessons, you'll learn how to use Excel's GEOMEAN function to find geometric mean.

If you use Microsoft Excel on a regular basis, odds are you work with numbers. Put those numbers to work. Statistical analysis allows you to find patterns, trends and probabilities within your data. In this MS Excel tutorial from everyone's favorite Excel guru, YouTube's ExcelsFun, the 40th installment in his "Excel Statistics" series of free video lessons, you'll learn how to calculate range & interquartile range for variability using the MAX, MIN, QUARTILE functions.

If you use Microsoft Excel on a regular basis, odds are you work with numbers. Put those numbers to work. Statistical analysis allows you to find patterns, trends and probabilities within your data. In this MS Excel tutorial from everyone's favorite Excel guru, YouTube's ExcelsFun, the 86th installment in his "Excel Statistics" series of free video lessons, you'll learn how to construct confidence intervals for proportions using NORMSINV function and other formulas.

If you use Microsoft Excel on a regular basis, odds are you work with numbers. Put those numbers to work. Statistical analysis allows you to find patterns, trends and probabilities within your data. In this MS Excel tutorial from everyone's favorite Excel guru, YouTube's ExcelsFun, the 87th installment in his "Excel Statistics" series of free video lessons, you'll learn how to calculate sample size (n) for confidence intervals.

If you use Microsoft Excel on a regular basis, odds are you work with numbers. Put those numbers to work. Statistical analysis allows you to find patterns, trends and probabilities within your data. In this MS Excel tutorial from everyone's favorite Excel guru, YouTube's ExcelsFun, the 27th installment in his "Excel Statistics" series of free video lessons, you'll learn how to create a quantitative data dot plot chart using the REPT and COUNTIF functions.

If you use Microsoft Excel on a regular basis, odds are you work with numbers. Put those numbers to work. Statistical analysis allows you to find patterns, trends and probabilities within your data. In this MS Excel tutorial from everyone's favorite Excel guru, YouTube's ExcelsFun, the 26th installment in his "Excel Statistics" series of free video lessons, you'll learn how to create quantitative data cumulative frequency distributions with pivot tables.

If you use Microsoft Excel on a regular basis, odds are you work with numbers. Put those numbers to work. Statistical analysis allows you to find patterns, trends and probabilities within your data. In this MS Excel tutorial from everyone's favorite Excel guru, YouTube's ExcelsFun, the 16th installment in his "Excel Statistics" series of free video lessons, you'll learn how to cross tabulate & do percentage cross tabulation for categorical data using a pivot table (PivotTable).

If you use Microsoft Excel on a regular basis, odds are you work with numbers. Put those numbers to work. Statistical analysis allows you to find patterns, trends and probabilities within your data. In this MS Excel tutorial from everyone's favorite Excel guru, YouTube's ExcelsFun, the 19th installment in his "Excel Statistics" series of free video lessons, you'll learn how to group categories in a frequency distribution with a formula (2 COUNTIF) and the pivot table (PivotTable) grouping fea...

If you use Microsoft Excel on a regular basis, odds are you work with numbers. Put those numbers to work. Statistical analysis allows you to find patterns, trends and probabilities within your data. In this MS Excel tutorial from everyone's favorite Excel guru, YouTube's ExcelsFun, the 17th installment in his "Excel Statistics" series of free video lessons, you'll learn how to cross tabulate & do percentage cross tabulation for categorical data using formulas rather than pivot tables.

If you use Microsoft Excel on a regular basis, odds are you work with numbers. Put those numbers to work. Statistical analysis allows you to find patterns, trends and probabilities within your data. In this MS Excel tutorial from everyone's favorite Excel guru, YouTube's ExcelsFun, the 3rd installment in his "Excel Statistics" series of free video lessons, you'll learn how to use Excel's sorting and pivot tables (PivotTables) data analysis tools.

If you use Microsoft Excel on a regular basis, odds are you work with numbers. Put those numbers to work. Statistical analysis allows you to find patterns, trends and probabilities within your data. In this MS Excel tutorial from everyone's favorite Excel guru, YouTube's ExcelsFun, the 35th installment in his "Excel Statistics" series of free video lessons, you'll learn how to calculate weighted and geometric means and see how to use the GEOMEAN function.
If you use Microsoft Excel on a regular basis, odds are you work with numbers. Put those numbers to work. Statistical analysis allows you to find patterns, trends and probabilities within your data. In this MS Excel tutorial from everyone's favorite Excel guru, YouTube's ExcelsFun, the 33rd installment in his "Excel Statistics" series of free video lessons, you'll learn how to use the AVEARGE, MEDIAN, MODE, PERCENTILE, QUARTILE and PERCENTILERANK functions to measure location.

If you use Microsoft Excel on a regular basis, odds are you work with numbers. Put those numbers to work. Statistical analysis allows you to find patterns, trends and probabilities within your data. In this MS Excel tutorial from everyone's favorite Excel guru, YouTube's ExcelsFun, the 4th installment in his "Excel Statistics" series of free video lessons, you'll learn how to create a frequency table and percentage frequency table using a Pivot Table (PivotTable).

It looks like Snapchat is becoming the MTV of augmented reality. On Thursday, Ariana Grande, with her new album Sweetner, joined Drake and Nicki Minaj and other artists who are pushing new releases through Snapchat's Shoppable AR e-commerce platform.

Technology can move really fast. Just consider the format for which we consume videos and movies, which has transformed from film reels to VHS to DVD to Blu-ray to steaming with nothing physical at all. But for some odd reason—maybe because it strikes a nostalgic chord or it's just the new hipster trend—VHS is in again. Yes, shaky, grainy, low-quality videos with timestamps are cool again, and I dig it.

With all of the advancements in the smartphone world, we can virtually use them for anything. You can use your smartphone as a mobile hotspot, an Xbox controller, a car locator, and a security camera. Heck, you can even turn it into a Swiss Army knife. And now you can even use it as a wireless mouse for your computer!
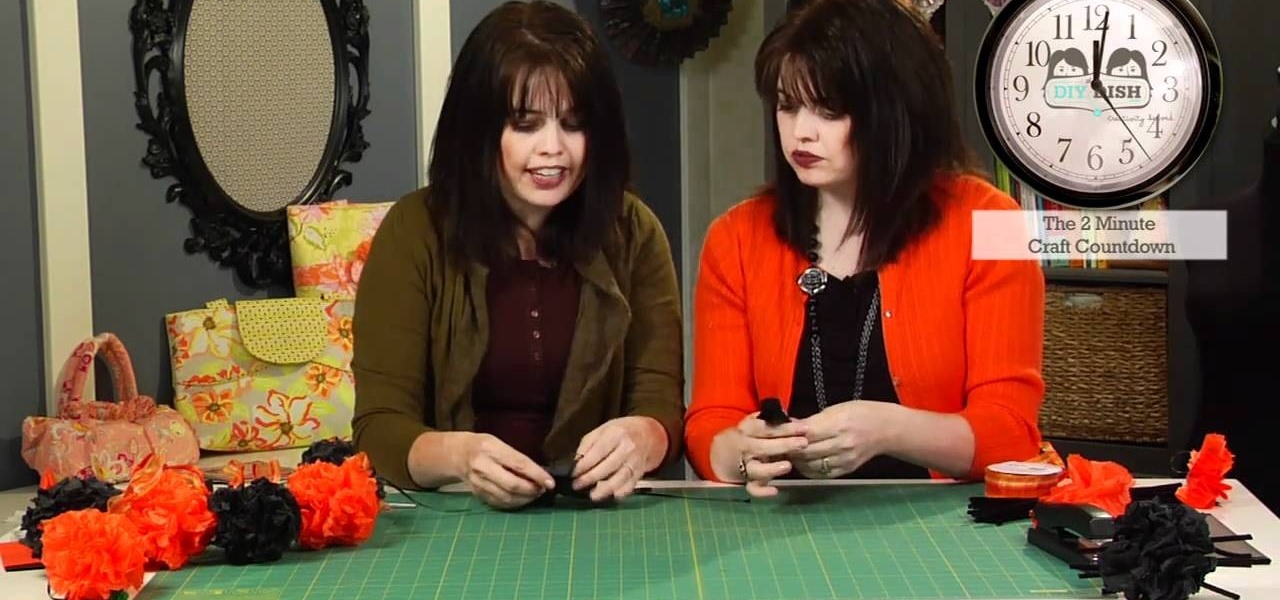
There's always a lot going on in the craft world, with ingenious new products being made every day. But there are also trends in decorating that rise up and end up on every crafter's blog. Right now, that ternd is garlands.
Crackled glass has made its appearance in lots of cultural avenues, including nail polish (remember the crackled nail polish trend popular a few years back?), glass designs, and now, cards.

In this clip, you'll learn how to incorporate hashtags or hash tags into your tweets on Twitter. What do President Obama, the Dalai Lama and Justin Bieber have in common? Why, they're all on Twitter, of course. Join the party. Whether you're new to Twitter's popular microblogging application or just missed a few of the essentials along the way, you're sure to benefit from this free video tutorial.

If you use Microsoft Excel on a regular basis, odds are you work with numbers. Put those numbers to work. Statistical analysis allows you to find patterns, trends and probabilities within your data. In this MS Excel tutorial from everyone's favorite Excel guru, YouTube's ExcelsFun, the 44th installment in his "Excel Statistics" series of free video lessons, you'll learn how to use the SKEW function to calculate the skew in a distribution of data.

f you use Microsoft Excel on a regular basis, odds are you work with numbers. Put those numbers to work. Statistical analysis allows you to find patterns, trends and probabilities within your data. In this MS Excel tutorial from everyone's favorite Excel guru, YouTube's ExcelsFun, the 37th installment in his "Excel Statistics" series of free video lessons, you'll learn how to use the PERCENTILE and QUARTILE functions.

If you use Microsoft Excel on a regular basis, odds are you work with numbers. Put those numbers to work. Statistical analysis allows you to find patterns, trends and probabilities within your data. In this MS Excel tutorial from everyone's favorite Excel guru, YouTube's ExcelsFun, the 47th installment in his "Excel Statistics" series of free video lessons, you'll learn about the basics of the empirical rule (the bell curve) and how to apply it in various ways.

If you use Microsoft Excel on a regular basis, odds are you work with numbers. Put those numbers to work. Statistical analysis allows you to find patterns, trends and probabilities within your data. In this MS Excel tutorial from everyone's favorite Excel guru, YouTube's ExcelsFun, the 89th installment in his "Excel Statistics" series of free video lessons, you'll learn how to use the NORMSINV function for critical values and the NORSDIST function for p-values.

If you use Microsoft Excel on a regular basis, odds are you work with numbers. Put those numbers to work. Statistical analysis allows you to find patterns, trends and probabilities within your data. In this MS Excel tutorial from everyone's favorite Excel guru, YouTube's ExcelsFun, the 91st installment in his "Excel Statistics" series of free video lessons, you'll learn how to use TINV and TDIST functions to find critical values given an unknown sigma value.

If you use Microsoft Excel on a regular basis, odds are you work with numbers. Put those numbers to work. Statistical analysis allows you to find patterns, trends and probabilities within your data. In this MS Excel tutorial from everyone's favorite Excel guru, YouTube's ExcelsFun, the 80th installment in his "Excel Statistics" series of free video lessons, you'll learn how to construct confidence intervals when the sigma is known known using the CONFIDENCE and NORMSINV functions.

If you use Microsoft Excel on a regular basis, odds are you work with numbers. Put those numbers to work. Statistical analysis allows you to find patterns, trends and probabilities within your data. In this MS Excel tutorial from everyone's favorite Excel guru, YouTube's ExcelsFun, the 21st installment in his "Excel Statistics" series of free video lessons, you'll learn how to build labels and counting formulas for a frequency distribution.

If you use Microsoft Excel on a regular basis, odds are you work with numbers. Put those numbers to work. Statistical analysis allows you to find patterns, trends and probabilities within your data. In this MS Excel tutorial from everyone's favorite Excel guru, YouTube's ExcelsFun, the 87th installment in his "Excel Statistics" series of free video lessons, you'll learn how to use NORMSINV to test a hypothesis with population standard deviation (sigma) known and proportions.

If you use Microsoft Excel on a regular basis, odds are you work with numbers. Put those numbers to work. Statistical analysis allows you to find patterns, trends and probabilities within your data. In this MS Excel tutorial from everyone's favorite Excel guru, YouTube's ExcelsFun, the 28th installment in his "Excel Statistics" series of free video lessons, you'll learn how to create quantitative data stem & leaf charts using the REPT and COUNTIF functions.