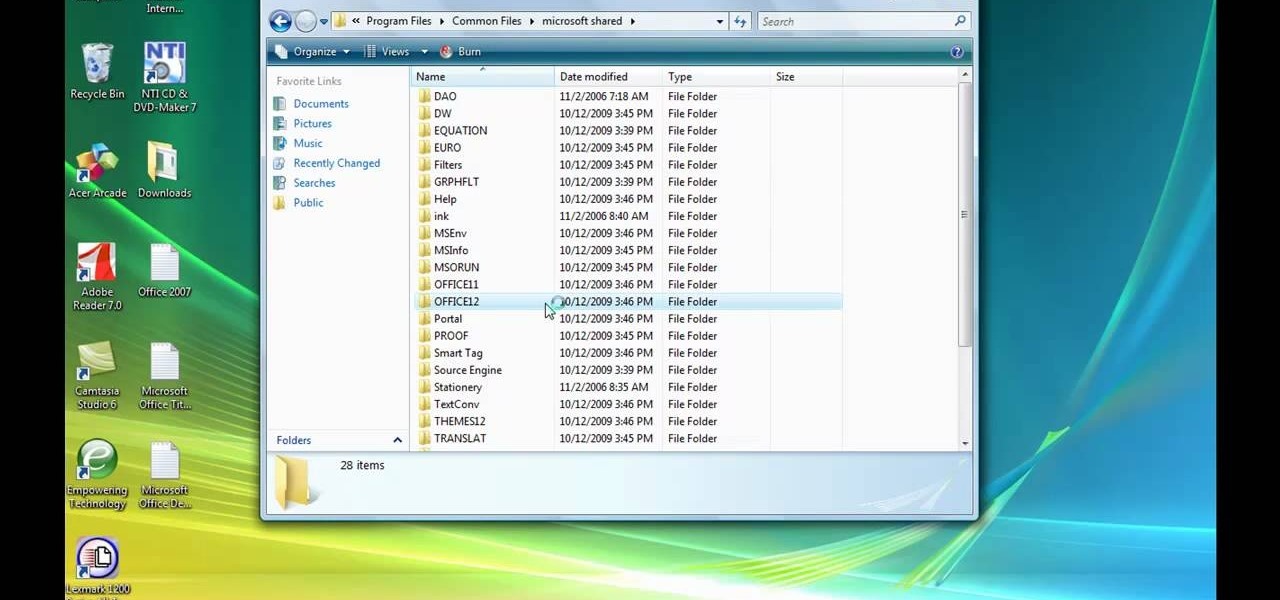
Chances are if you've used a computer in the last decade or so, you've probably used Microsoft Office at some point. Activating Microsoft Office standard 2007 will give you access to functions you might not have even known existed that can increase your productivity and improve your work flow. This video will show you to activate Microsoft Office standard 2007.
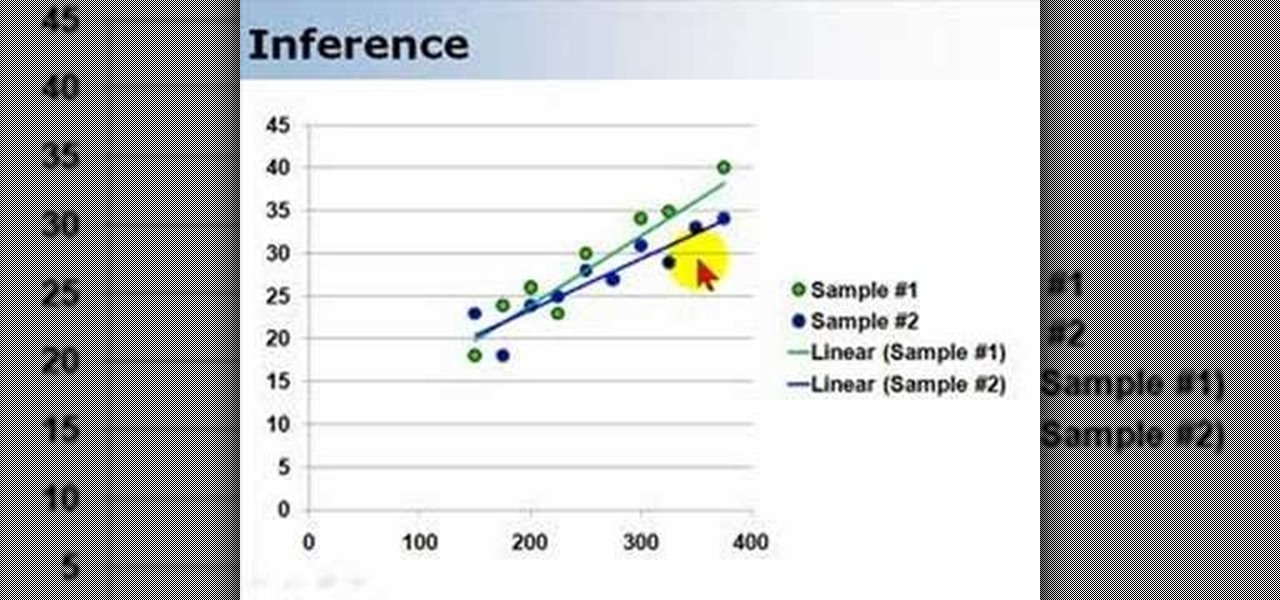
Regression functions are a vital part of statistical analysis of populations, and if you're involved in business, science, or nearly any academic field you should understand how it works. This series of videos will show you how standard regression functions, ANOVA, ordinary least squares, and everything else you need to know.

You don't need a high definition television to take advantage of AppleTV! This tutorial shows you how to set up your Apple TV to function with a standard definition television set. You'll need an HDMI to DVI cable anda VGA to DVI adapter, and use the yellow composite video cords. Then adjust your settings, and you're ready to start watching your new Apple TV!

Installing and maintaining properly functioning brakes is one of the most important mechanical parts of keeping your bike working safely. This video features a professional bike mechanic setting up an international standard, or IS, brake caliper on a mountain bike.
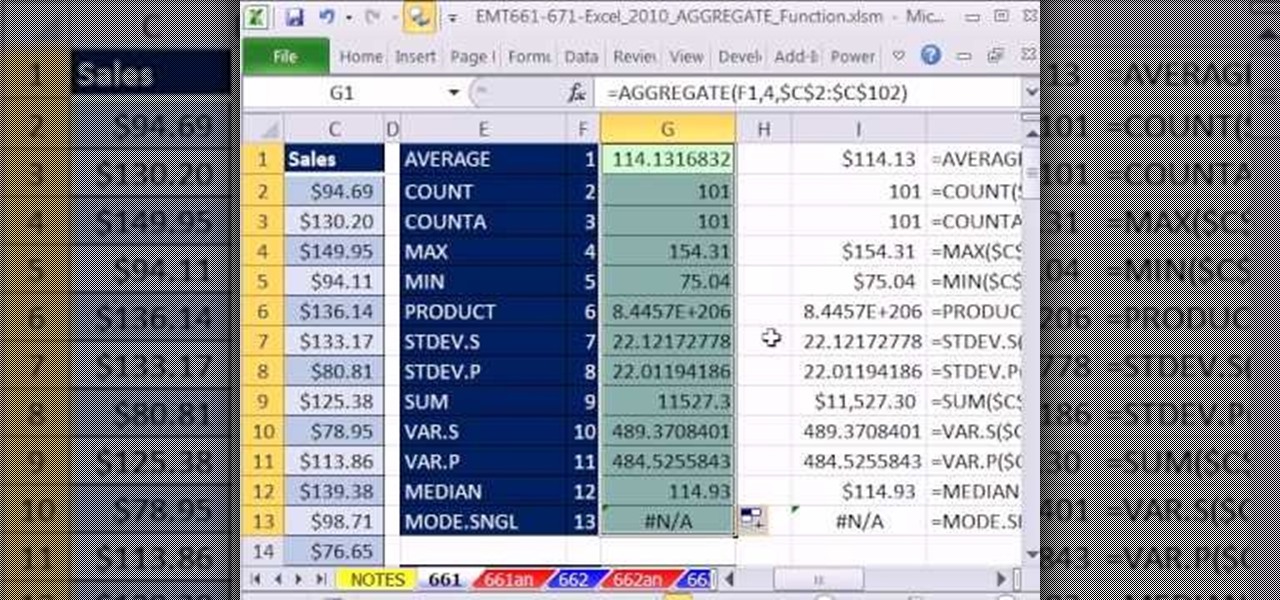
New to Microsoft Excel? Looking for a tip? How about a tip so mind-blowingly useful as to qualify as a magic trick? You're in luck. In this MS Excel tutorial from ExcelIsFun, the 664th installment in their series of digital spreadsheet magic tricks, you'll learn how about how the new Excel 2010 AGGREGATE function that can calculate these 19 different functions depending on what number you put into the 1st argument of the AGGREGATE function. This is an improvement over the SUBTOTAL function wh...

New to Excel? Looking for a tip? How about a tip so mind-blowingly useful as to qualify as a magic trick? You're in luck. In this Excel tutorial from ExcelIsFun, the 237th installment in their series of digital spreadsheet magic tricks, you'll learn how to

Here you'll be shown how to take the equation of a circle, and convert it into standard form. Also, it will be explained just what standard form is, while running through the process of conversion. You'll be able to use techniques to quickly work off the numbers on the equation, one by one, until it's simplified enough to understand. Complicated algebra functions become much simpler when you see these easy to use techniques, that will help you rearrange the equation into a form that is actual...

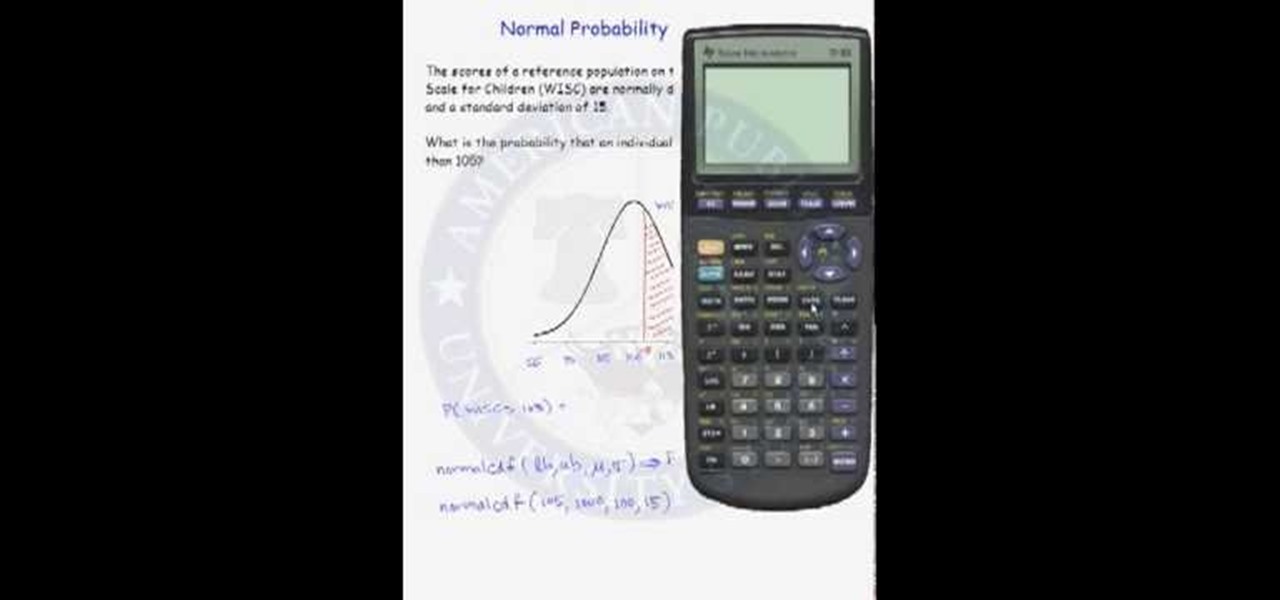
Probability computation is a complex process and even using a calculator can be difficult. But normal probability calculations can be performed quickly with the help of calculator once you know how to use it. So when you have to calculate a probability from a normal distribution you can use the functions on your scientific calculator. You can use the normal CDF function from you calculator to compute the area under a normal curve. The function requires lower band and upper band values, the me...

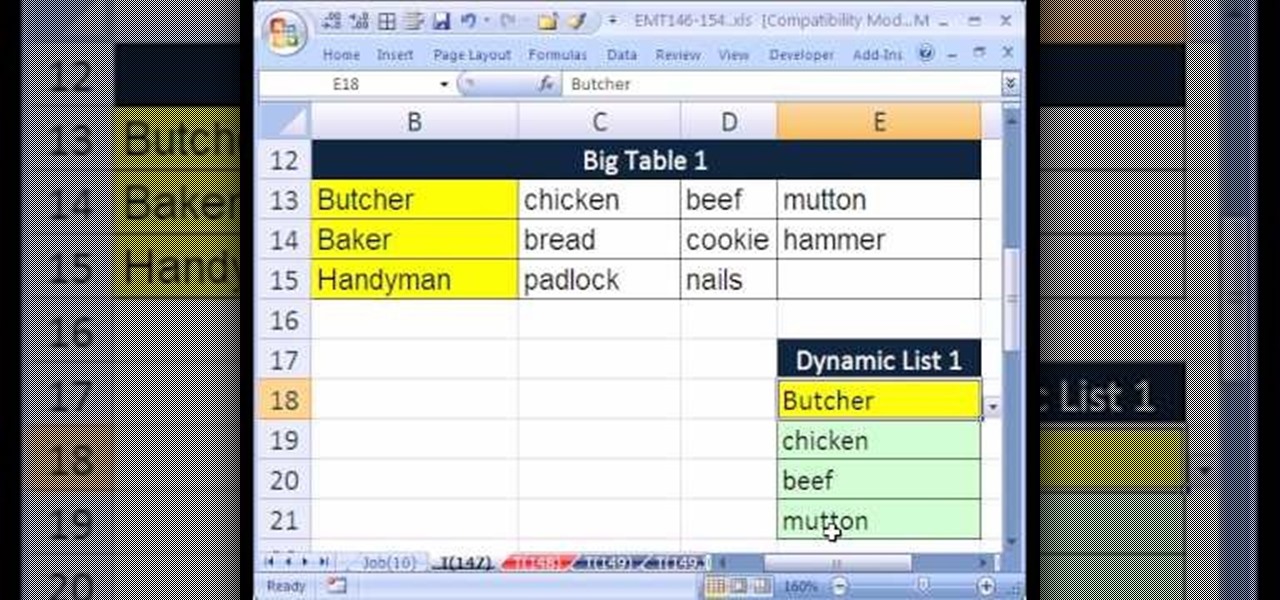
New to Microsoft Excel? Looking for a tip? How about a tip so mind-blowingly useful as to qualify as a magic trick? You're in luck. In this MS Excel tutorial from ExcelIsFun, the 137th installment in their series of digital spreadsheet magic tricks, you'll learn how to extract records from standard table and put a record in a column using the VLOOKUP, IF and ROWS functions.

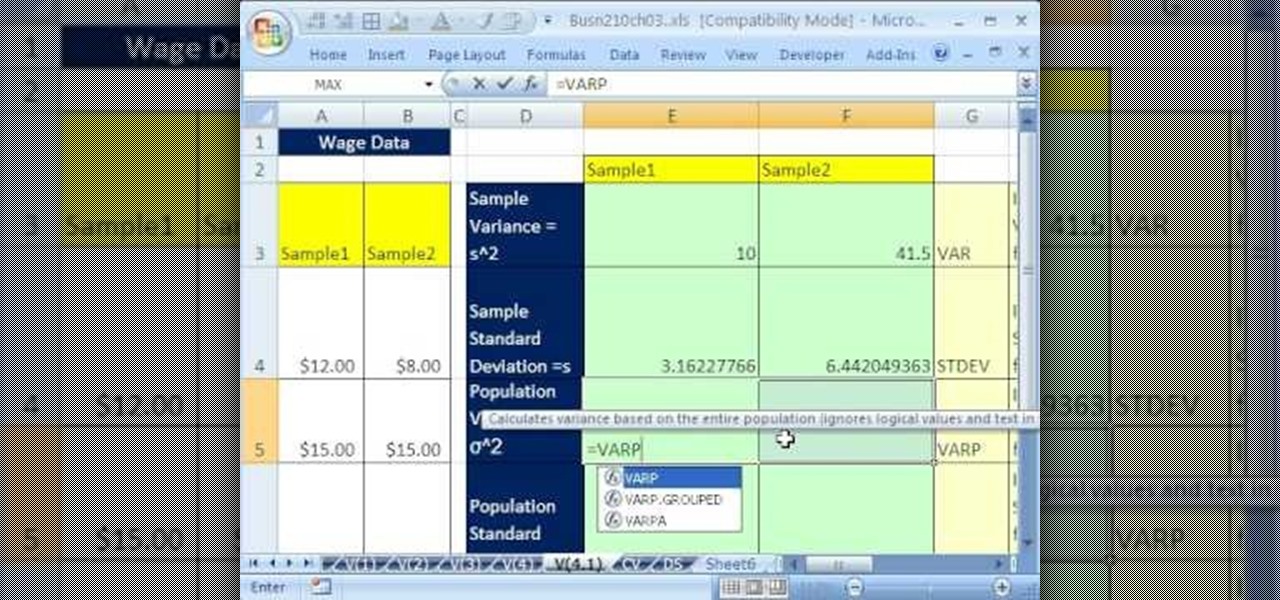
If you use Microsoft Excel on a regular basis, odds are you work with numbers. Put those numbers to work. Statistical analysis allows you to find patterns, trends and probabilities within your data. In this MS Excel tutorial from everyone's favorite Excel guru, YouTube's ExcelsFun, the 41st installment in his "Excel Statistics" series of free video lessons, you'll learn how to calculate deviations, variance and standard deviation for a sample and a population using Excel tables and the VAR, S...

Looking for a primer on how to create and work with array formulas in Microsoft Office Excel? You've come to the right place. In this free video tutorial from everyone's favorite MS Excel guru, YouTube's ExcelIsFun, the 12th installment in his series of Excel array formula series, you'll learn how to create array formulas for stock portfolio return & standard deviation.

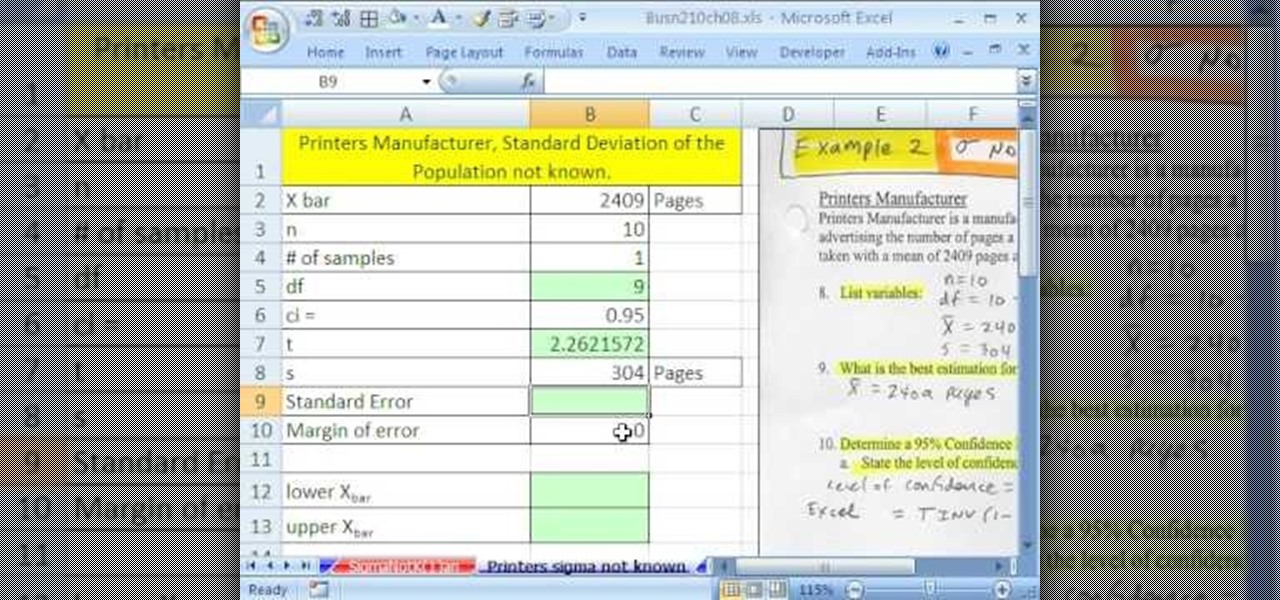
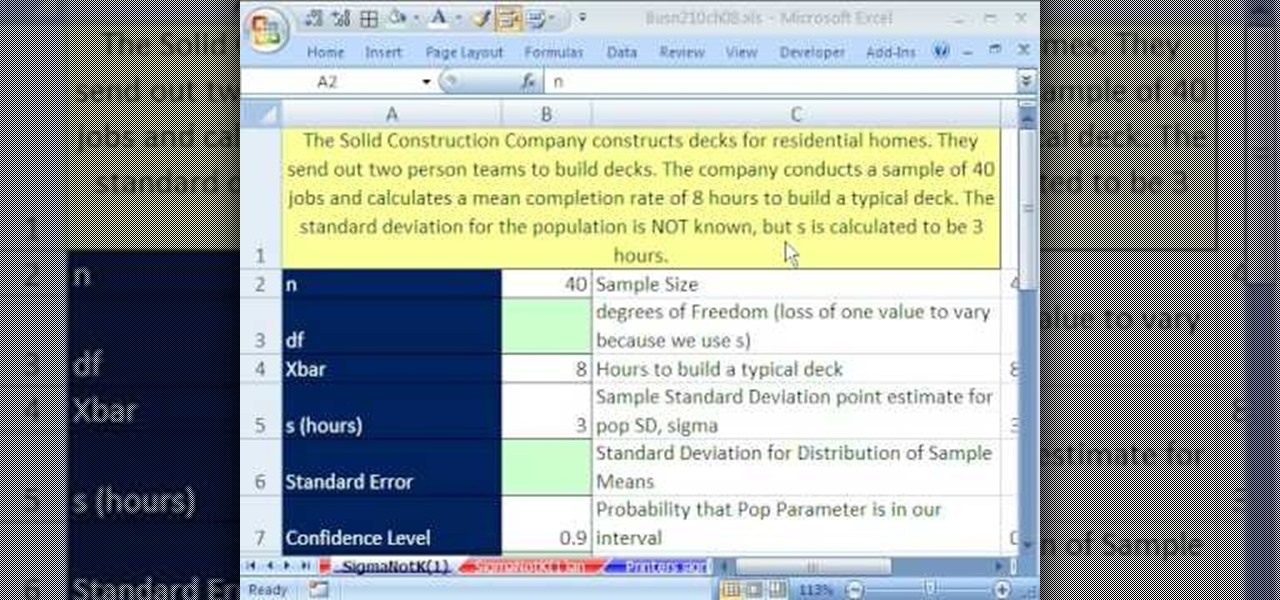
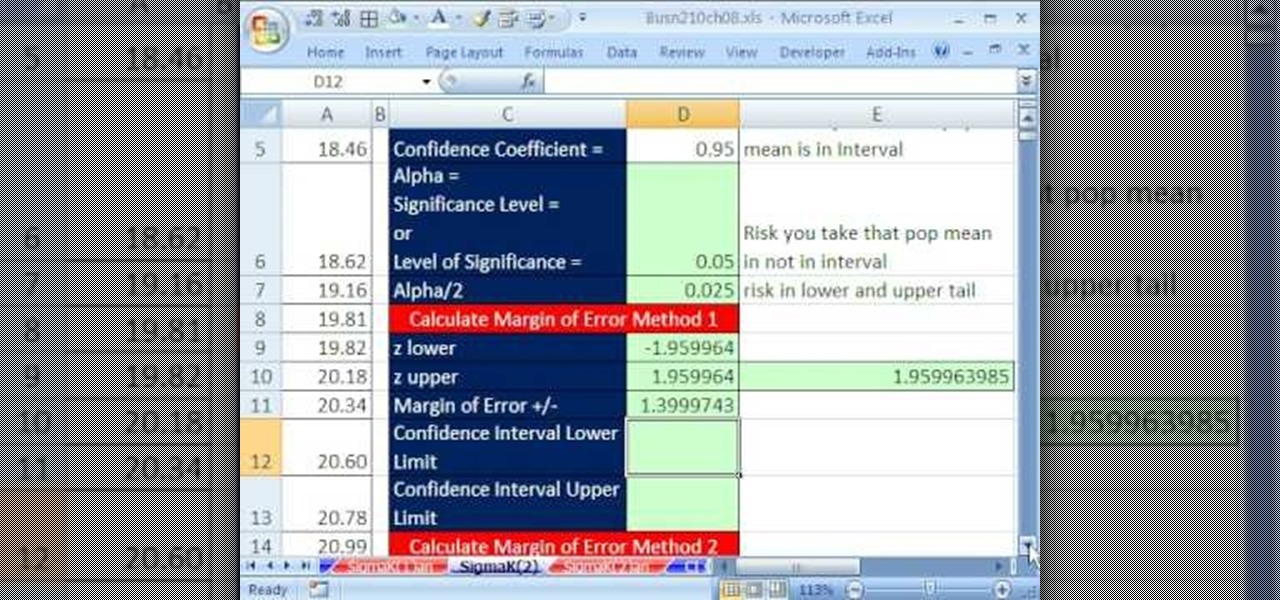
If you use Microsoft Excel on a regular basis, odds are you work with numbers. Put those numbers to work. Statistical analysis allows you to find patterns, trends and probabilities within your data. In this MS Excel tutorial from everyone's favorite Excel guru, YouTube's ExcelsFun, the 83rd installment in his "Excel Statistics" series of free video lessons, you'll learn how to construct confidence intervals when the sigma (population standard deviation) in NOT known using the TINV function.

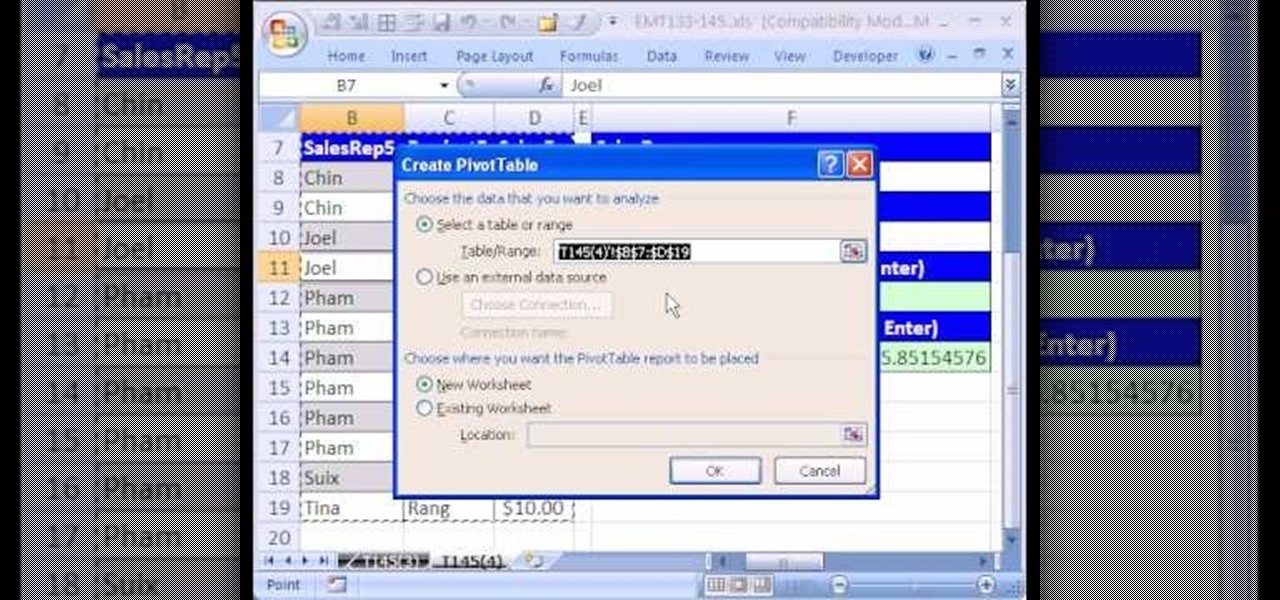
New to Microsoft Excel? Looking for a tip? How about a tip so mind-blowingly useful as to qualify as a magic trick? You're in luck. In this MS Excel tutorial from ExcelIsFun, the 145th installment in their series of digital spreadsheet magic tricks, you'll learn how to create a formula that will calculate the standard deviation when you have more than 1 criterion.

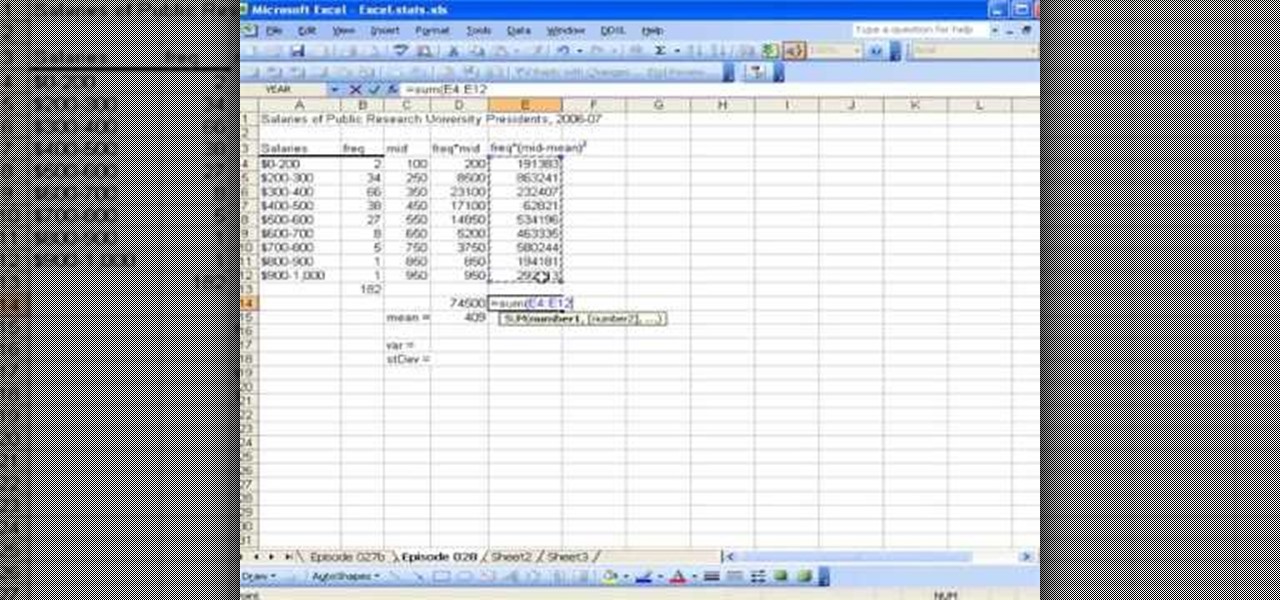
This video shows the method to find the variance and standard deviation using Excel. The variance shows the variability of the data points from the median. We find the difference of the median and the mean. We write the formula using '=' sign. The median and data points are put in it by selecting the appropriate cell. The median is made an absolute constant by pressing the F4 key. This is squared by using '^2'. This is multiplied to the frequency using '*'. The result is found for all the dat...

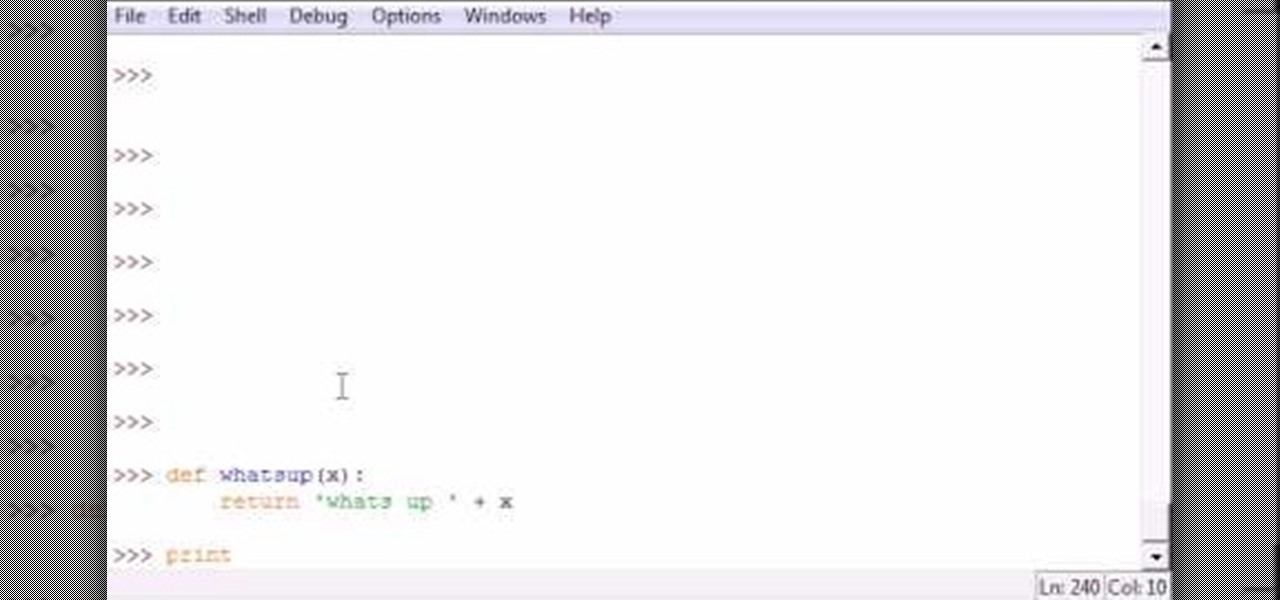
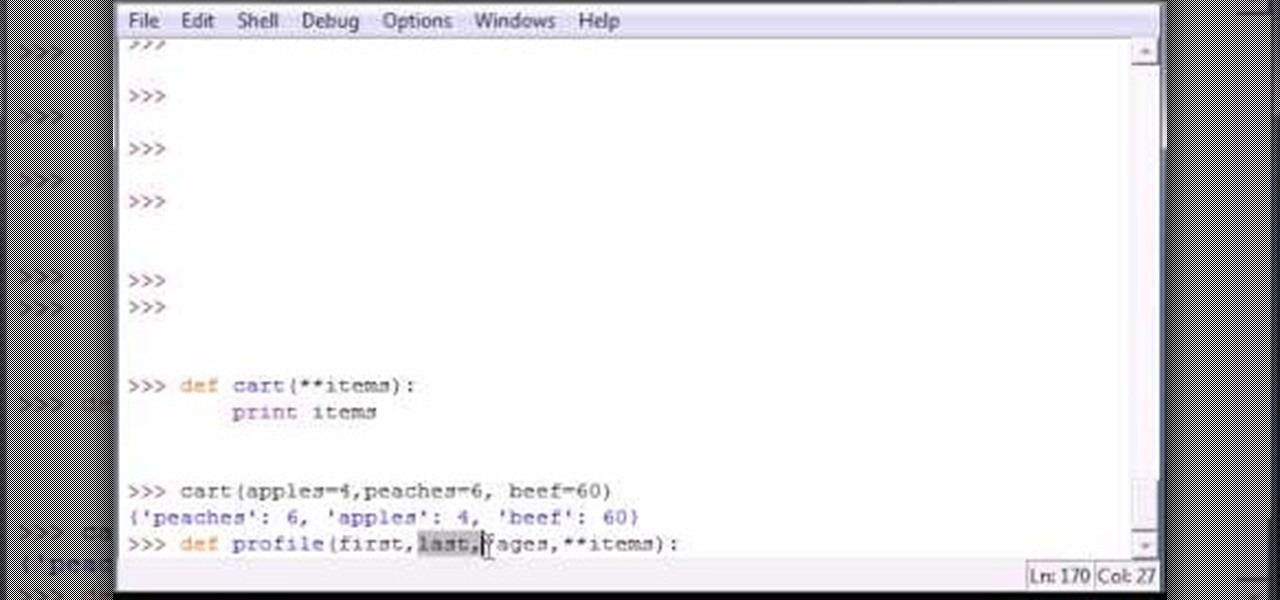
Bucky from The New Boston serves up this Python video tutorial on how to build and program your own functions in Python. This is the program you use to write all of your Python code down. Learn how to create your own function!

Bucky from The New Boston serves up this Python video tutorial on how to program lists functions in Python. This is the program you use to write all of your Python code down. Fun with list functions!

Recently purchased a brand new digital SLR? Learn how to use your camera's functions properly by watching this tutorial on how to use your picture control settings on your Nikon digital SLR.

If you don't know exactly what goes on during Hanukkah, this series of videos will set you straight. Hanukkah is the most recognized Jewish holiday, right around Christmastime, and Chaim from Maoz Israel is going to show you some traditional customs that are performed during the eight days of Hanukkah 2010. Learn about the menorah, sufgaiyots, the mysterious dreidel and the traditional Chanukah songs.

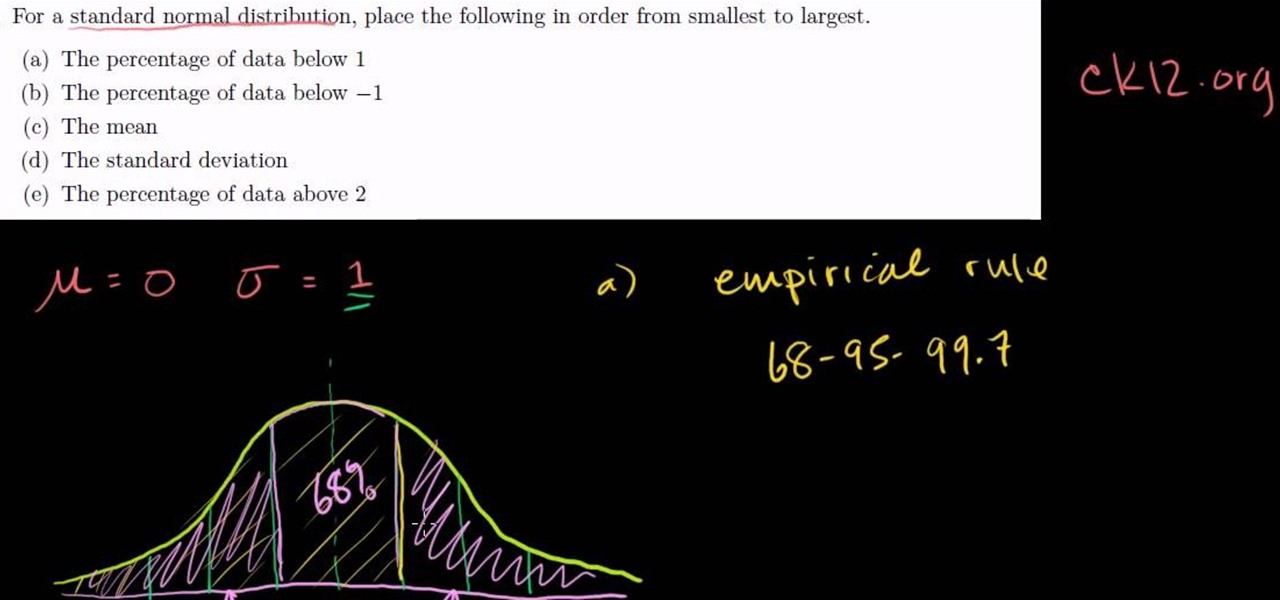
In this video tutorial the instructor explains about the concepts of standard normal distribution and the empirical rule and how to use it to solve an exercise. He starts by explaining about standard normal deviation saying that in a standard normal deviation the value of mean is zero and the value of standard deviation is one. Now he draws the standard normal deviation by drawing a bell curve on an axis. Now he points the mean and standard deviations on it. Now using these concepts he goes o...

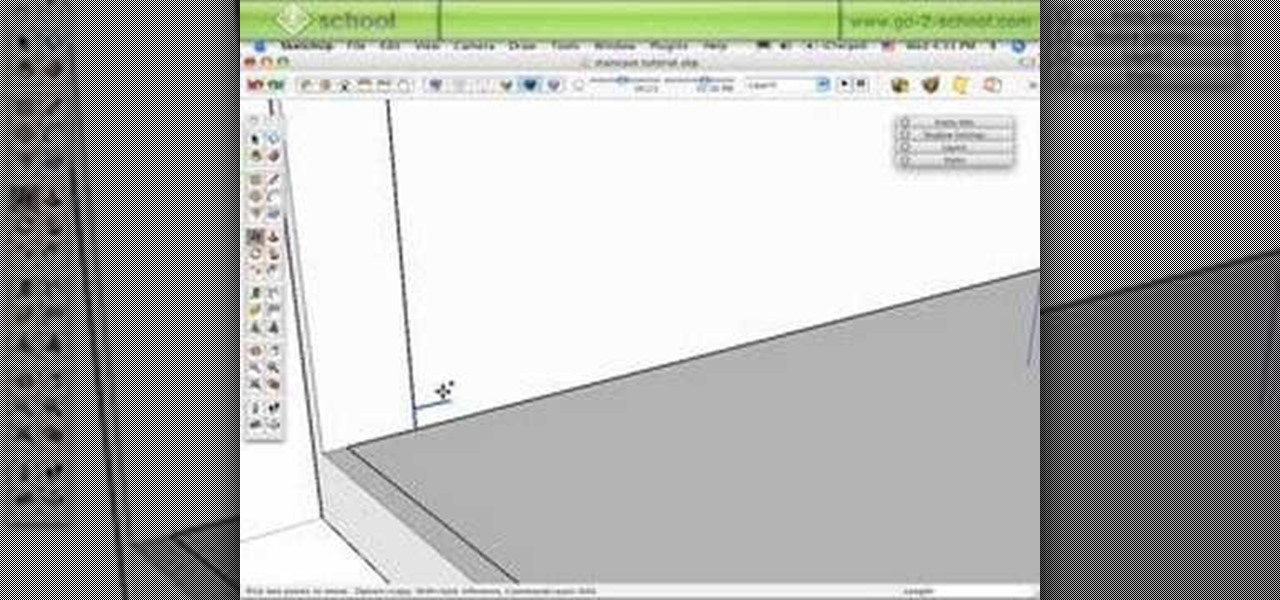
It's one thing to learn how to model a building in SketchUp, and if you are a new SketchUp user you may not remember that multi-level buildings will need a staircase! Mike demonstrates a few different methods to create both standard and spiral staircases in this SketchUp 6 tutorial.

This medical instructional how-to video demonstrates the proper way to perform a standard venepucture procedure on a patient. Before drawing blood from any patient it is always good to identify your patient. Wrap the band at the top of the arm and use alcohol to clean the area. Watch to learn how to perform a standard venepuncture procedure.

This tutorial will explain some of the ways you can implement global illumination in your scene, using luminous materials and HDRIs. It also presents a look at how to set up realistic reflections in your materials, using the standard reflection channel with a fresnel mixed in. Whether you're new to MAXON's popular 3D modeling application or are just looking to get better acquainted with Cinema 4D and its various features and functions, you're sure to enjoy this free video software tutorial. F...

Whether you're interested in learning Microsoft Excel from the bottom up or just looking to pick up a few tips and tricks, you've come to the right place. In this tutorial from everyone's favorite digital spreadsheet guru, ExcelIsFun, the nth installment in his "Highline Excel Class" series of free video Excel lessons, you'll learn how to do basic statistical analysis in Excel. Specifically, this video covers the following topics:

Mean and standard (or normal) deviation may be hard to understand at first, but with the help of this handy little guide from the pros at Exam Solutions you will be up to speed in no time.

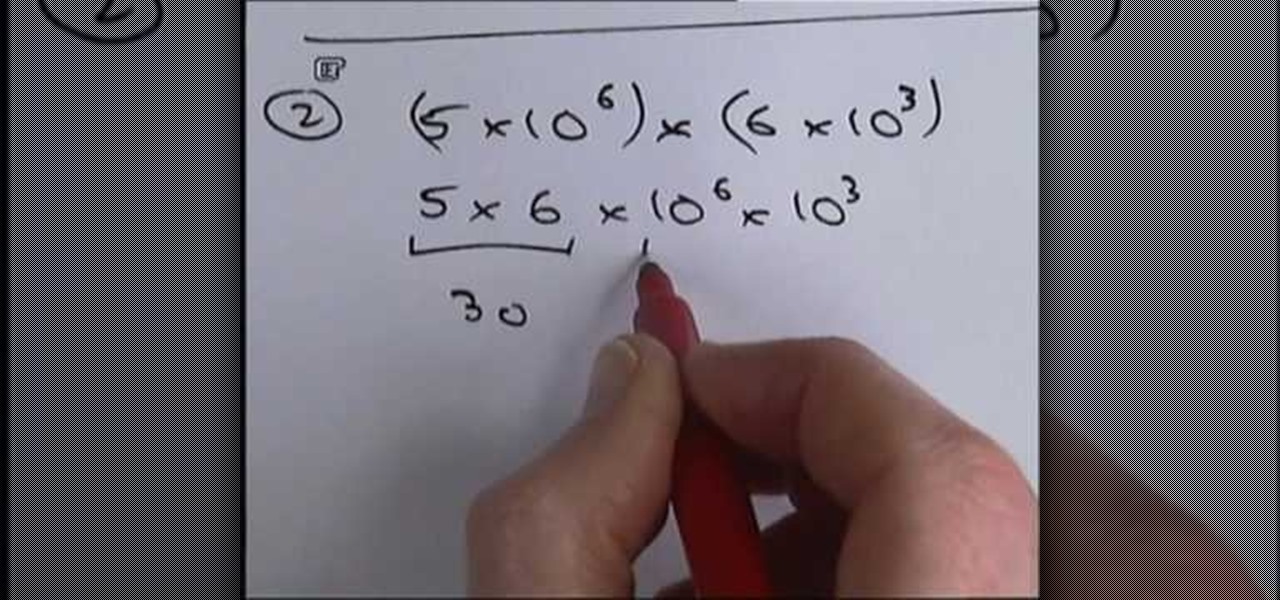
When a number is expressed in the form of x multiplied by 10^y such that, x < 10 and y is an integer, the number is said to be in standard form. Standard form of expressing numbers finds its use in scientific and statistical fields. This video demostrates how to express, as well as perform basic mathematical operations namely, addition/subtraction, multiplication and division of numbers in the standard form using four examples/mathematical problems. The first two examples demostrate multiplic...

In this tutorial, we learn how to know what standard deviation is in your portfolio. Standard deviation is the amount of risk you have inside your portfolio, this will show you how much fluctuation you have in your portfolio. Depending on the expected return of your portfolio over an amount of time, you could have a different range of standard deviation. Knowing what your standard deviation can help you do the math to see what your chances of a return or loss will be for certain. This will he...

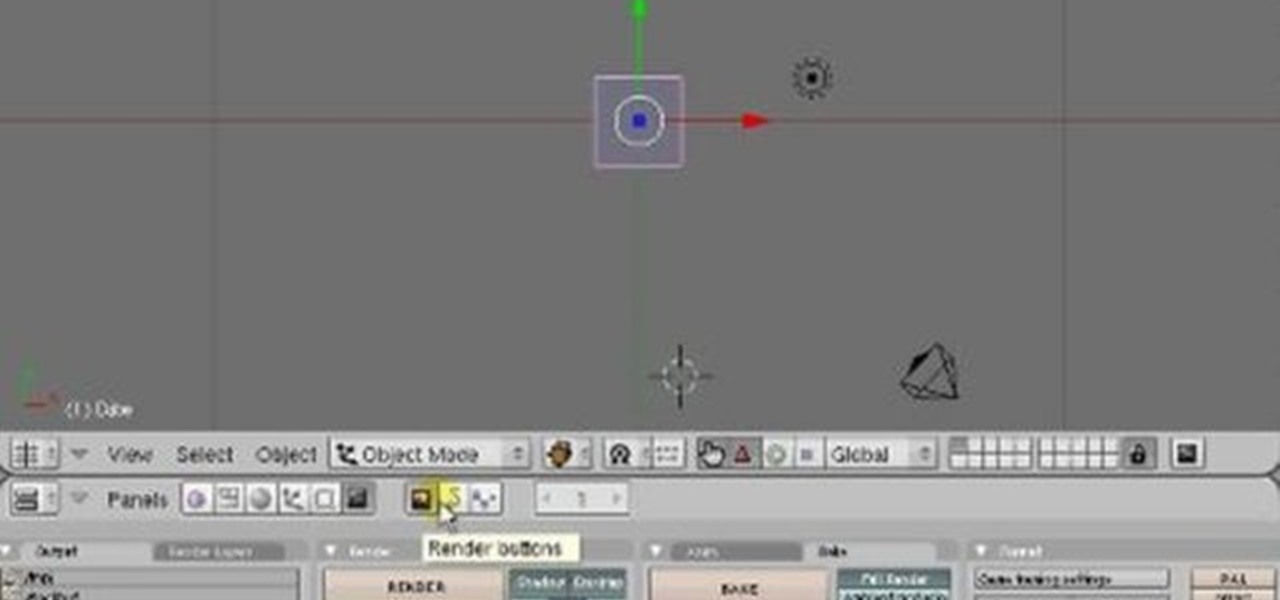
This clip covers the confusing array of buttons and controls in Blender that are used for the different functions. Specifically, it talks about context and sub-context buttons, presets for TV broadcast (and the different standards for those) in HD or high-definition broadcast. Whether you're new to the Blender Foundation's popular 3D modeling program or a seasoned graphic artist just interested in better acquainting yourself with the application, you're sure to be well served by this free vid...

If you use Microsoft Excel on a regular basis, odds are you work with numbers. Put those numbers to work. Statistical analysis allows you to find patterns, trends and probabilities within your data. In this MS Excel tutorial from everyone's favorite Excel guru, YouTube's ExcelsFun, the 82nd installment in his "Excel Statistics" series of free video lessons, you'll learn how to construct confidence intervals when the sigma value (the population's standard deviation) in NOT Known using the TINV...

Looking to find the standard deviation of your set of values? Standard deviation quantifies how diverse the values of your data set are, and is useful in determining how different your numbers are from each other.

In this AeroCast episode, UND Aerospace discusses the Slow Flight maneuver as performed in the Piper Warrior (PA-28-161), referencing the procedures and standards outlined in the UND Warrior Standardization Manual. All performance tolerances are based on the performance standards set forth by the FAA Private Pilot Practical Test Standards. Since the most critical phases of flight occur at airspeeds less than cruise, a pilot must always be comfortable with his or her airplane’s handling charac...

In this AeroCast episode, Anthony Bottini discusses the Power On Stall maneuver as performed in the Piper Warrior (PA-28-161), referencing the procedures and standards outlined in the UND Aerospace Warrior Standardization Manual. All performance tolerances are based on the performance standards set forth by the FAA Private Pilot Practical Test Standards. Power On Stall practice is vital in increasing a pilot’s proficiency in regards to stall recognition and stall recovery techniques during an...

Welcome back, my budding hackers! In previous tutorials, we've looked at some of the basic commands and concepts for using Linux. Along the way, I realized that I've failed to provide you with some basic background material on the stdin, stdout, and stderror.

In this video, we learn how to convert numbers in and out of standard form. Standard form is a useful way of writing down very large numbers and very small numbers. To do this, you will look at the number you have and ignore the zeros that are just at the end. Then, write down the basic numbers. Put a decimal point in this number to make it between one and ten. Now, write down x 10 and put the power for how many places the decimal point moved to get to the new number. This will help you write...

If you use Microsoft Excel on a regular basis, odds are you work with numbers. Put those numbers to work. Statistical analysis allows you to find patterns, trends and probabilities within your data. In this MS Excel tutorial from everyone's favorite Excel guru, YouTube's ExcelsFun, the 81st installment in his "Excel Statistics" series of free video lessons, you'll learn how to construct confidence intervals when the sigma (population standard deviation) is known. See how the CONFIDENCE and NO...

Bucky from The New Boston serves up this Python video tutorial on how to program parameters in Python. This is the program you use to write all of your Python code down. Different parameter types in the same function!

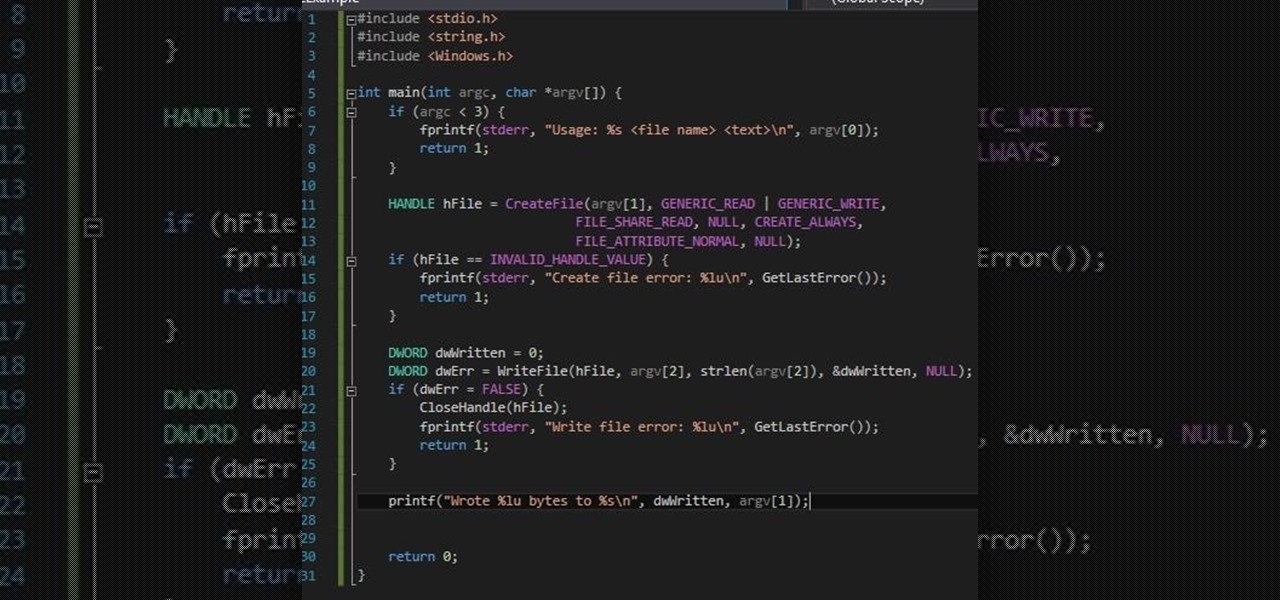
It's been a while since I wrote up an article for this series but I did say that I'd be covering some WinAPI. So if you're interested in programming for the Windows platform, hop aboard and follow along.
Hey everyone. Only found the site a few days ago but really loving it. Been

This is a video tutorial in the Education category where you are going to learn how to compare 2 distributions with the Z-Score formula. In this example Doug's class has X bar as 71 and a standard deviation of 4. Corey's class has X bar as 68 and a standard deviation of 11. If both Doug and Corey beat the class average and have the same standard score, will Doug have a lower grade than Corey? If both of them have a standard score of 1.5, then Doug will get 77 marks and Corey will get 84.5 mar...

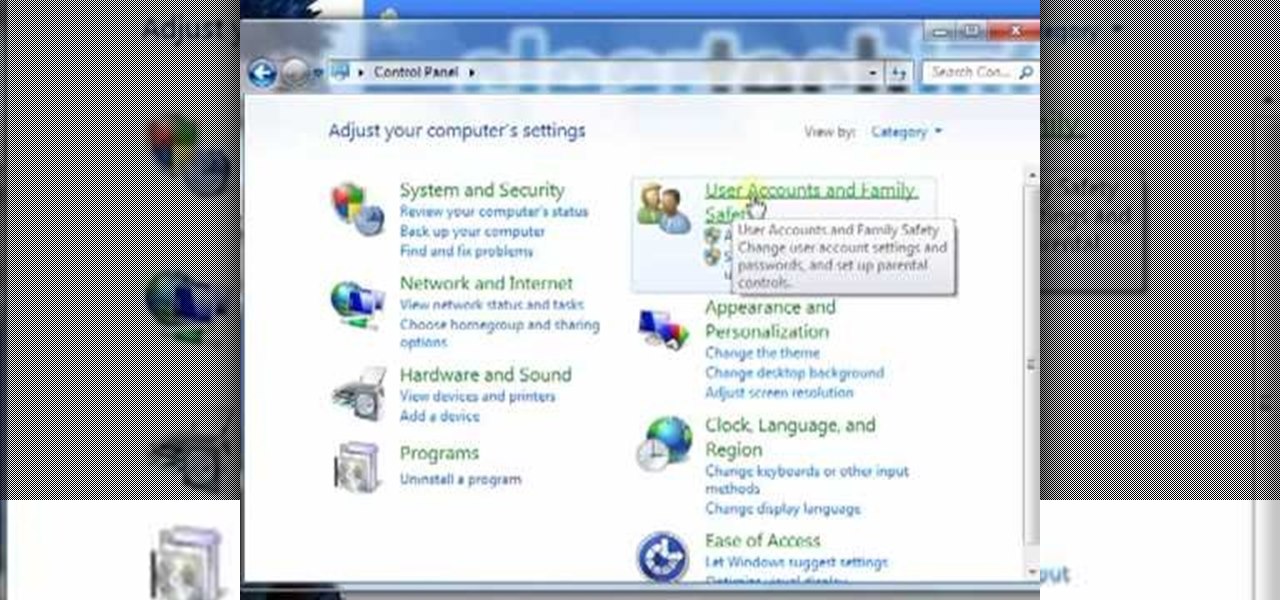
In this video tutorial, viewers learn how to create a new standard user and administrator account. Begin by clicking on the Start menu and select Control Panel. Then click on User Accounts and Family Safety and click on User Accounts. Now select the "Manage another account" option and click on "Create a new account". Users are able to name the account and select the account type (Standard or Administrator). Finish by clicking on Create Account. Users are then able to make changes to the accou...

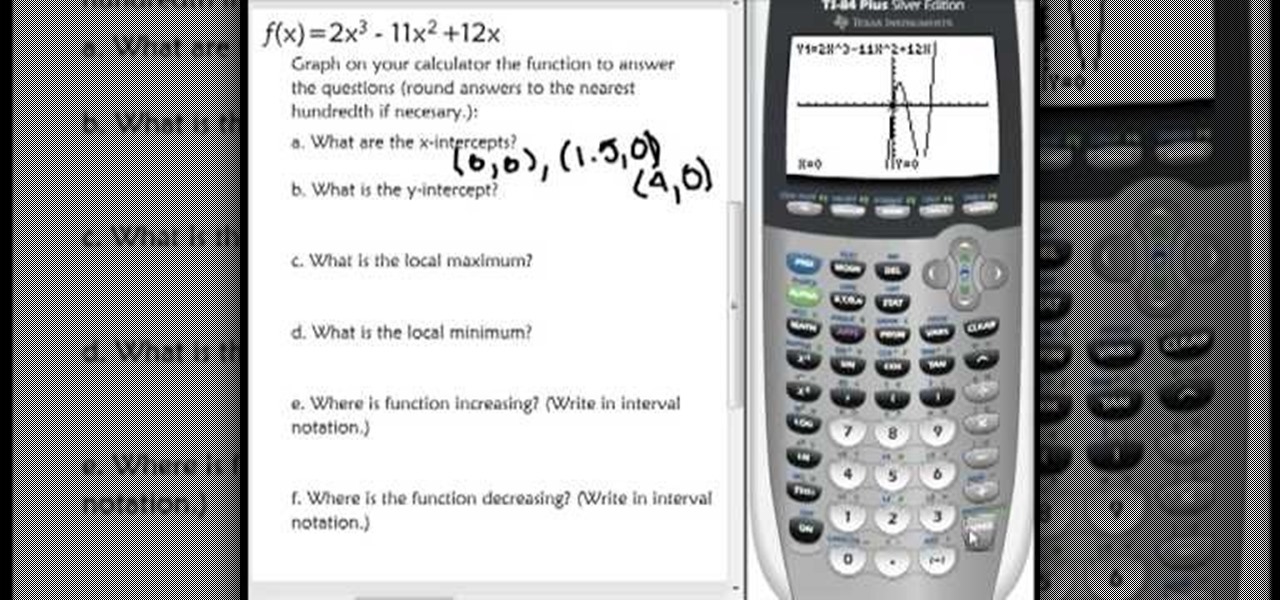
In this video the teacher shows us how to use a TI-84 plus graphing calculator to graph a function, adjust the view window, and determine the values of several types of critical points on the graph such as x-intercept, y-intercept, local maximums, and local minimums. After entering the function in the Y= editor she presses the ZOOM button and selects Z-Standard this adjusts the view window to a range of -10 to 10 on both axis. To find each of the critical points requested the teacher uses the...


