Ash Davies teaches us how to Photoshop digital bokeh with this tutorial. First, open up Photoshop and create a new canvas with your width at 1920 and your height at 1200. Now, create a new layer and set your background layer as invisible. Now create a medium size circle and reduce the fill to 50%. Now enter blending options and add a stroke of 10 pixels to the inside with the color set to black. Now define the shape as a brush and then click "edit" and "define brush preset" name this, "bokeh"...
A Change of Plans: Nothing works entirely as it's supposed to. Talk to Mario just outside his home and follow him indoors. He'll part ways soon, leaving you to read a letter that you've got (just press the button indicated by the on-screen pop-up). After reading the letter, you can find Mario in his back room. Talk to him again for another cut scene.

Cocorais wants to show you how to do a short hairstyle inspired by Disney's Snow White. You'll need: heat-protecting spray, curl-boosting spray, a flat-iron, a rag-tail comb, hairspray, and sectioning clips. Turn on your iron and apply your heat-protecting spray. Section off your hair using the clips and iron it (section by sections) flipping it inwards at the end. The thinner the sections, the more scattered it will look. Varying degrees of thickness of the sections and randomness will also ...

In this video tutorial learn how to graph an equation using the slope and y-intercept. To show how this can be done, the equation 4X-5Y=20 is used as an example. The first step that needs to be done is to convert the equation into the y=mx+b format where m is the slope and b is the intersection of the y-intercept. Simply solve the equation for Y and you get Y=4/5X-4. From this, you will find that the slope, or m, is equal to 4/5 and that b is the coordinates 0 and -4. On the graph, you will w...

Hetal and Anuja from Show Me the Curry! take a step away from their usual Indian cuisine to show you how to make a delicious Mexican-style seven-layer dip. Choose the serving dish. For large parties a decorative bowl is suggested; otherwise, you can make individual servings in a margarita glass. For the first layer, spread refried beans in the bottom. Make this a thick layer as it is the most substantial part of the dip. The second layer is guacamole; spread this over the top of the refried b...
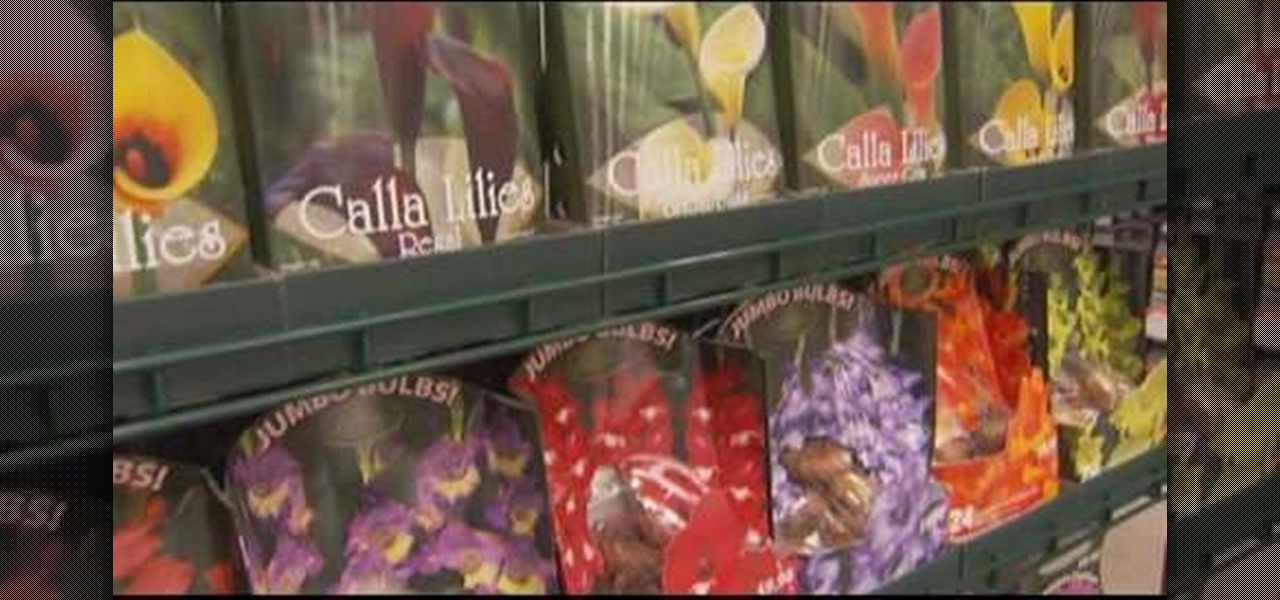
Flowering bulbs require some few common tools before planting such as compost or peat moss, work gloves, fertilizer, garden trowel or bulb planter and the garden bulb of your choice. During the spring season you can plant tender bulbs such as, irises, gladiolus and elephant ears. In terms of fall plantings you can plant bulbs such as tulips, daffodils, hyacinths and crocuses which could give a beautiful bloom in the spring. In general the blooms will last till three to four weeks, bulbs such ...

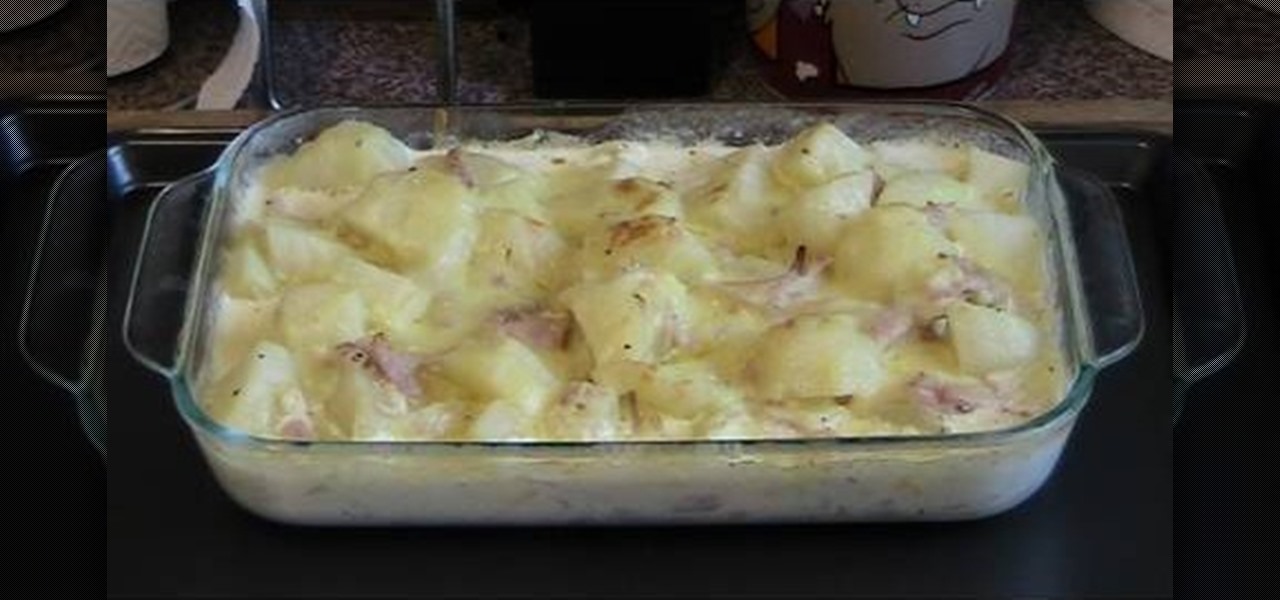
Preheat oven to 170¬8C. Brush a 2.5L (10-cup) capacity ovenproof dish with melted butter to lightly grease. Combine the cream and milk in a saucepan over low heat and cook, stirring occasionally, for 2 minutes or until heated through.
A few handy tricks can turn your school cell into a cozy suite. You Will Need
If you see a mouse in your house, don’t kid yourself—his entire extended family has moved in with him. Reclaim your home, once and for all. Check out this Howcast video tutorial on how to get rid of mice.
This seafood recipe comes to us from Oliver Rowe from the Konstam restaurant in London. Follow along in this how-to video to learn how make pan fried skate fish cheeks with lovage and lemon dressing.
"Tron: Legacy" may have not been the most plot-driven movie out there, nor will it be an Oscar contender, but cinematography-wise it was truly a feast for the eyes. One of our favorite video game characters from the movie was Gem, one of the sirens who suit Sam up for the games.
From Ramanujan to calculus co-creator Gottfried Leibniz, many of the world's best and brightest mathematical minds have belonged to autodidacts. And, thanks to the Internet, it's easier than ever to follow in their footsteps. With this installment from Internet pedagogical superstar Salman Khan's series of free math tutorials, you'll learn how to visualize statistical data with a hand-drawn stem-and-leaf chart.
From Ramanujan to calculus co-creator Gottfried Leibniz, many of the world's best and brightest mathematical minds have belonged to autodidacts. And, thanks to the Internet, it's easier than ever to follow in their footsteps (or just study for that next big test). With this installment from Internet pedagogical superstar Salman Khan's series of free statistics tutorials, you'll learn how to use visualize data by graphing it in a box-and-whisker diagram.
At a very early age, I would go on summer camping trips. I remember every night being handed a pack of sparklers that were my own, to swing around wildly, which gave me many valuable life lessons on cause and effect.
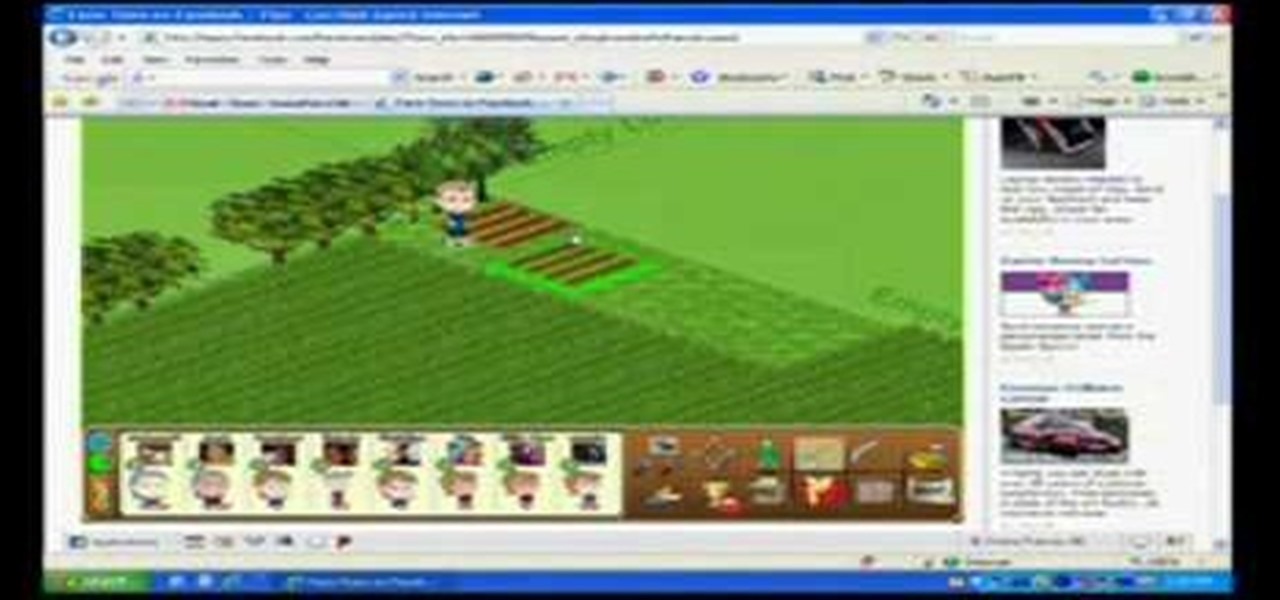
Are you just a few points shy of hitting a new experience level in FarmVille, but you've run out of land to be able to plant more crops? This little cheat will let you work around this and grow more crops quickly!
If you are writing a character who is in-depth enough, you will be able to let the character out of the box and improve your writing by taking over the scene completely. Master the exercise outlined in this video and get a better grasp on both your plot and character.
The Mind Map is a technique you can use when writing your next novel, article, technical document or any other project. Create character profiles, plot arcs or design the main goal of your article by using this innovative and useful technique for organizing the information in your piece.
Get the most out of every large bag of fertilizer you can find in FarmVille! First, harvest your crops that have already been fertilized. Then, replant the empty plots. Finally, spread the fertilizer across the growing plants on your farm!
This tutorial will show you how to determine the slope of a line if you are given two coordinates on a coordinate plane. You should first find the location of each point on the plane, remembering that the coordinates are in the format of x-axis (or horizontal movement), followed by y-axis (vertical movement). After plotting both these points, you should draw a straight line between these two points and then determine the slope of this line by taking the rise over the run of the line.
Heidi Hewett demos AutoCAD 2009 and shows you how to use the Quick Access Toolbar. The Quick Acces Toolbar starts in the top right corner of the AutoCAD 2009 interface and contains the most common tools like new, open, save, plot, redo and undo. Learn how to use the quick access toolbar and how to customize the toolbar to include the tools you use most in AutoCAD 2009.
You want to have a tomato garden and you bought the seedlings already... now what? Watch this video tutorial to learn how to properly transplant your potted tomato seedling into your garden plot.
Let me paint a picture for you. You're on a long flight home, and while listening to music on your Samsung Galaxy S10, a great song comes on. You want your friend to hear it too, who's also listening to music using a pair of Bluetooth headphones. Thanks to Dual Audio, you can easily share your experience.
We just keep discovering hidden features and settings scattered throughout the Galaxy S8's system like little digital Easter eggs that were largely left unadvertised. One such setting is an option that lets you change the placement of your S8's display brightness slider.
Kings Dominion, an amusement park located in Doswell, Virginia, just announced a mobile augmented reality game for park visitors. Gameplay in The Battle for Kings Dominion — available on May 19 for iOS and Android devices — follows the playbook designed by Niantic through Ingress and Pokémon GO.
Finger limes are one of those foods that bring out the little kid in even the most staid grown-up. I dare you not to squeal when you cut one open, squeeze, and see all that bubbly goodness emerge.
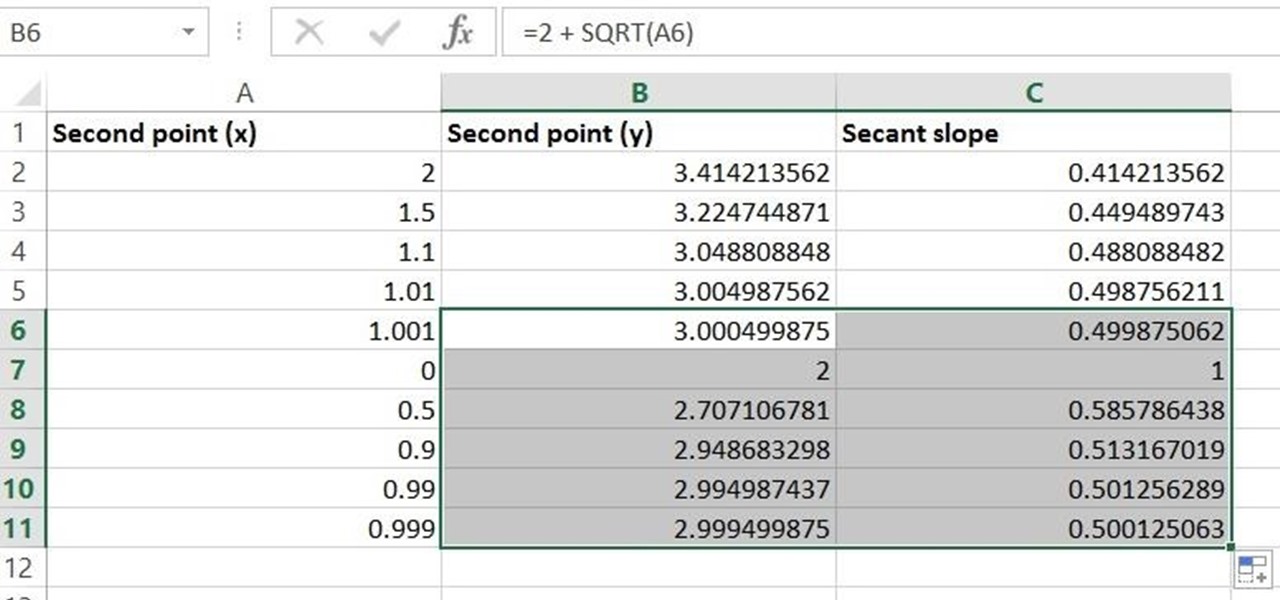
Given a function, you can easily find the slope of a tangent line using Microsoft Excel to do the dirty work. That is to say, you can input your x-value, create a couple of formulas, and have Excel calculate the secant value of the tangent slope. This is a fantastic tool for Stewart Calculus sections 2.1 and 2.2.
This video tells you how to draft an equation in point-slope form. Consider the equation (y+4) = 2(x+7) for example. The formula for the point-slope form is (y-y1) = m(x-x1). To plot the graph you have to identify m the slope, the x intercept x1 and the y intercept y1. In this equation the slope is 2 and (x1,y1). The x intercept according to the formula is -x1 but the given value is +7 so you have to figure out what will give you +7,only -(-7) can give you +7 so the point is -7 and now the y ...
If this is your first novel or you want to make a better one then this video will give you good advice on how to write fiction character for a great novel. The animated animals and people in this video will give you some great advice to improve your novel.
The first question asks for the intercepts x and y. To find X, you would need to set Y to zero, leaving the equation 3X=6. X then equals 2 after you divide both sides by 3. The X intercept that you found is not just the value of 2, but it is the ordered pair X=2 and Y=0 on a graph. To find Y, you would do the same thing, except this time X would be set to 0. In the second example of this video tutorial, you will actually learn how to graph the X and Y intercepts. To do that, you follow the st...
Turning over your soil mixes the nutrients and makes the ground more suitable for planting. Watch this video to learn how to turn over soil.
This video teaches how to plow without rows in Facebook's Flash game Farm Town. It is easiest to start at the top corner of your farm. Notice, put your cursor on the green highlight (or JUST below) of the plot. Then click left mouse button hold down and BARELY drag up and toward the plot to the left. It is tricky at first but after a field or two it is easy. This will DOUBLE the amount of crops you can plant on your farm.
This video will help you learn how to create an Explosive rainbow color swath in Photoshop. First open a new file, keep the width 845, height 475, RGB color mode and white background.
Would you know what to do if someone ingested poison? Equally important, would you know what not to do?
We're addicted to "True Blood." And, if we're going to be honest here, it's not just because the show has labyrinthine plot lines and exciting vampire vs. human vs. werewolf action. With hot chicks and hot guys, the show seems to be a breeding ground of good looks. And we're not complaining.
New to Microsoft Excel? Looking for a tip? How about a tip so mind-blowingly useful as to qualify as a magic trick? You're in luck. In this MS Excel tutorial from ExcelIsFun, the 351st installment in their series of digital spreadsheet magic tricks, you'll learn how to create an area chart for x and f(x) data as well as how to use the IF function to show a second data set plotted to show a specific area section.
A basis of algebra, slope intercept form can easily bring your equation to a graph with ease. This video will show you exactly how to graph equations using the slope intercept form.
Calculus can be a bit tricky, but don't worry, Watch Math is here to help you out. Watch this math video lesson to learn how to solve quadratic inequalities in calculus. There's no better way to learn mathematics than from an advanced mathematician, like this PhD.
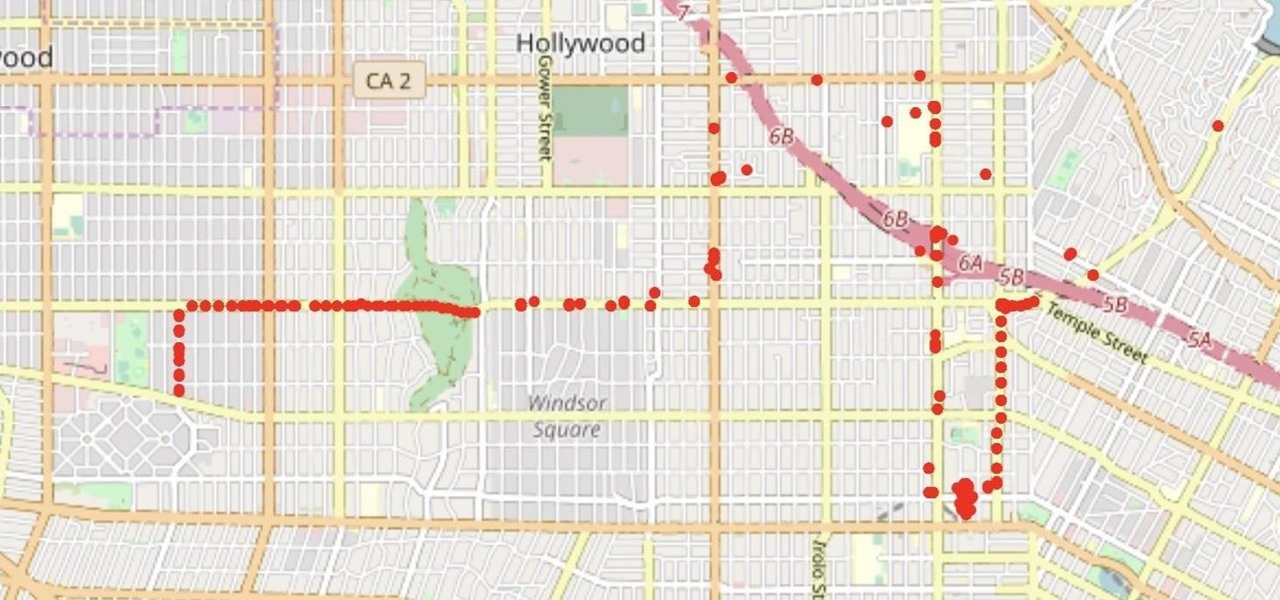
With the Wigle WiFi app running on an Android phone, a hacker can discover and map any nearby network, including those created by printers and other insecure devices. The default tools to analyze the resulting data can fall short of what a hacker needs, but by importing wardriving data into Jupyter Notebook, we can map all Wi-Fi devices we encounter and slice through the data with ease.
Each & Every One of You (EEOOY) is a mock TV show pilot that teaches ordinary people how to make contemporary installation art. If these words strike fear into your heart or make you cringe with memories of seeing contemporary art and wondering what the hell it was all about, this show is for you!
To grow beautiful flowers and plants in an outdoor garden, you need to feed your soil the right plant food – a fertilizer that will help your plants thrive. Watch this video to learn how to choose plant fertilizer.