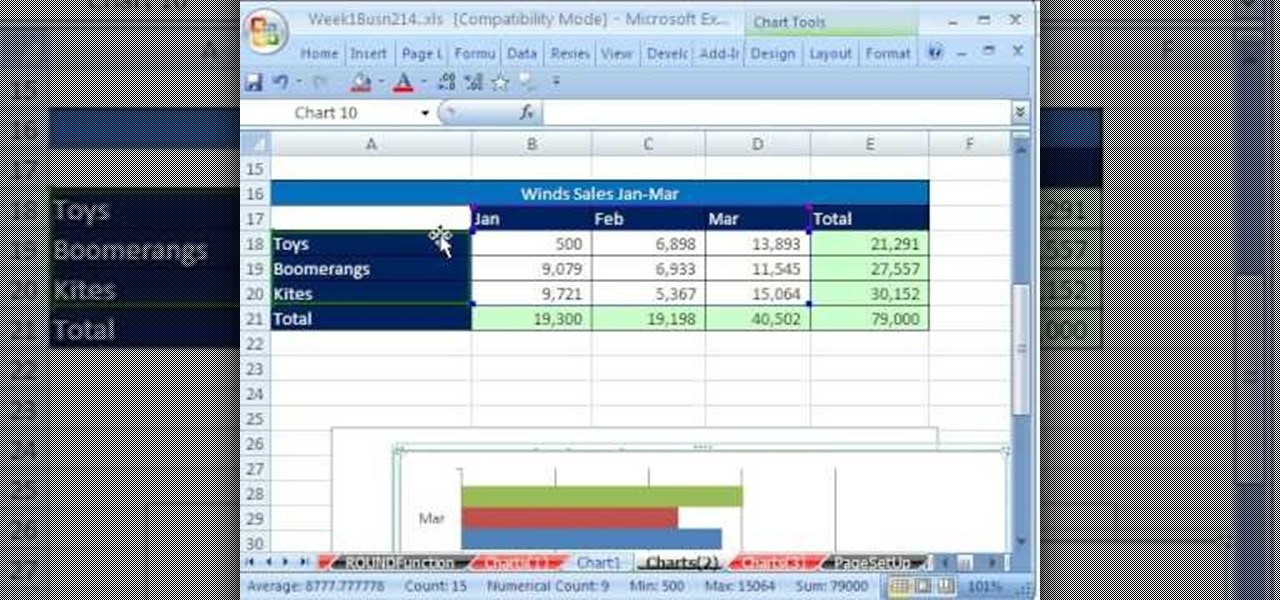
Whether you're interested in learning Microsoft Excel from the bottom up or just looking to pick up a few tips and tricks, you're in the right place. In this tutorial from everyone's favorite digital spreadsheet guru, ExcelIsFun, the 5th installment in his "Highline Excel Class" series of free video Excel lessons, you'll learn how to create seven types of charts — X-Y scatter diagrams, pie charts, column charts, bar charts, stacked bar charts, line charts, and column and line chart combined. ...
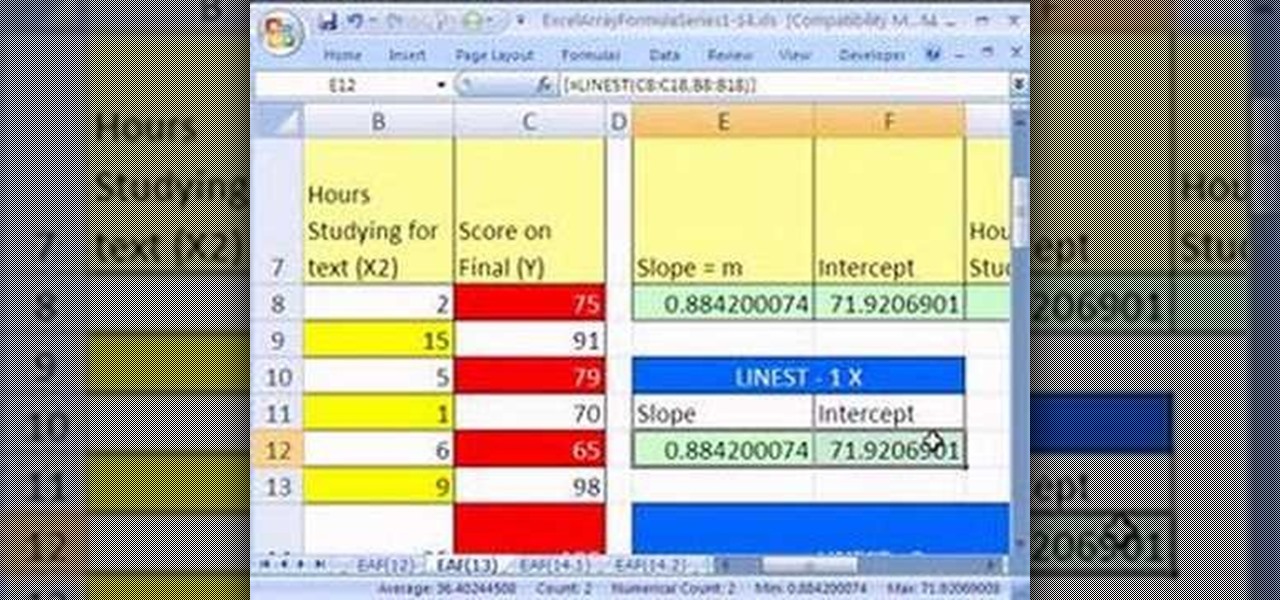
Looking for a primer on how to create and work with array formulas in Microsoft Office Excel? You've come to the right place. In this free video tutorial from everyone's favorite MS Excel guru, YouTube's ExcelIsFun, the 13th installment in his series of Excel array formula series, you'll learn how to do multiple regression and linear algebra problems with Excel's LINEST array function. Also see how to use the SLOPE, INTERCEPT and the FORECAST functions for linear algebra and how to create a s...

Holography is the scattering of light from an object, which is recorded and reconstructed to create the hologram. As the viewer or viewing mechanism moves, the image appears three dimensional. This instructional video shows how to craft 3 dimensional holograms using scratched arcs on a reflective surface. Using a compass, a picture, and Plexiglas, you can create glowing images that shift and turn inside of a 2 dimensional plane. Who would of thought? Now you can make your very own holograms a...

There are twenty different glyph puzzles scattered throughout the game Assassin's Creed: Brotherhood, and you will need to solve all of them. This walkthrough shows you where you can find each individual glyph, and then shows you how to solve them.

In this tutorial, we learn how to avoid common strategic planning pitfalls. First, you will need to look at all the common pitfalls. You want to have ownership for the planning process. Everyone that is involved needs to have the tools to get the goals accomplished. Lack of communication is a big problem, so have everyone on the same page with how to talk and communicate what's going on. Decision making should be scattered with different managers and they should be guiding the rest of the sta...
In order to create an explosion, using Calcium Carbide, you'll need the following: calcium carbide, water, a dropper, and a lighter.

Libraries is a cool new feature in Windows 7 that helps you find and manage all of your documents, music, pictures and videos in one location, no matter what location there in. This video from Microsoft outlines the usage of this new feature.
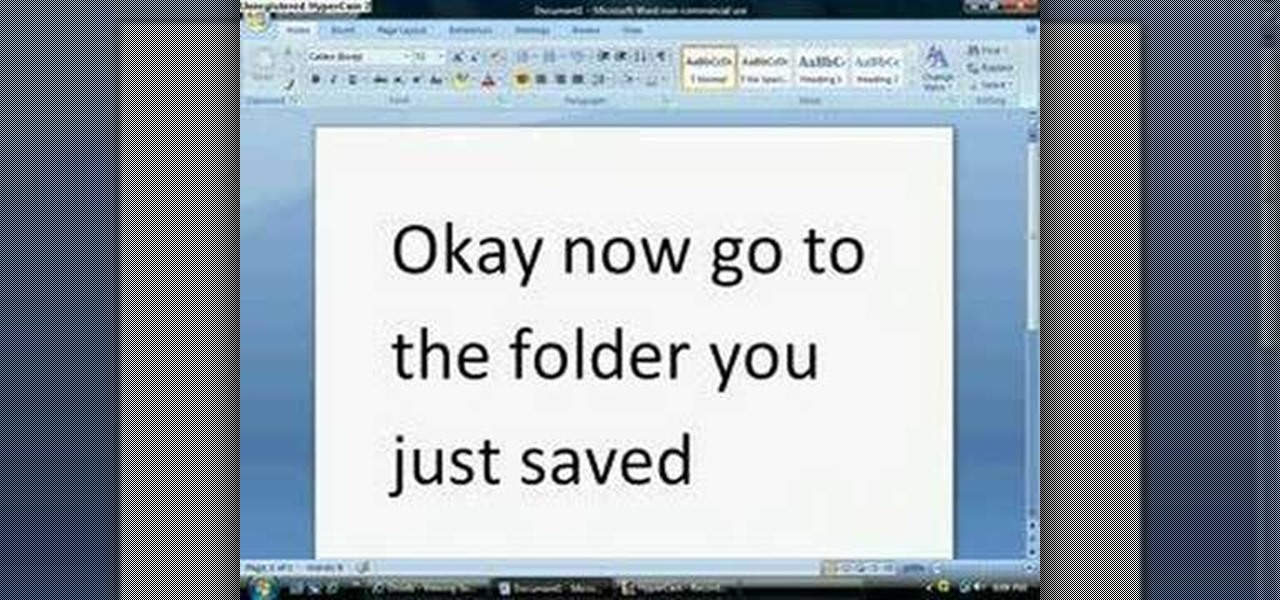
Zipped files are the most popular way to transfer scattered or large amounts of files in a compact and economical way, and in this video we learn how to go about unzipping these sometimes tricky storage files. After locating the exact .zip file you wanted unzipped, so to speak, the video tells us, you then right click on it. There should be a list of options, unzip this file being one of them, click this. You must also decide, then, what folder to place the unzipped files in. Quick and easy, ...
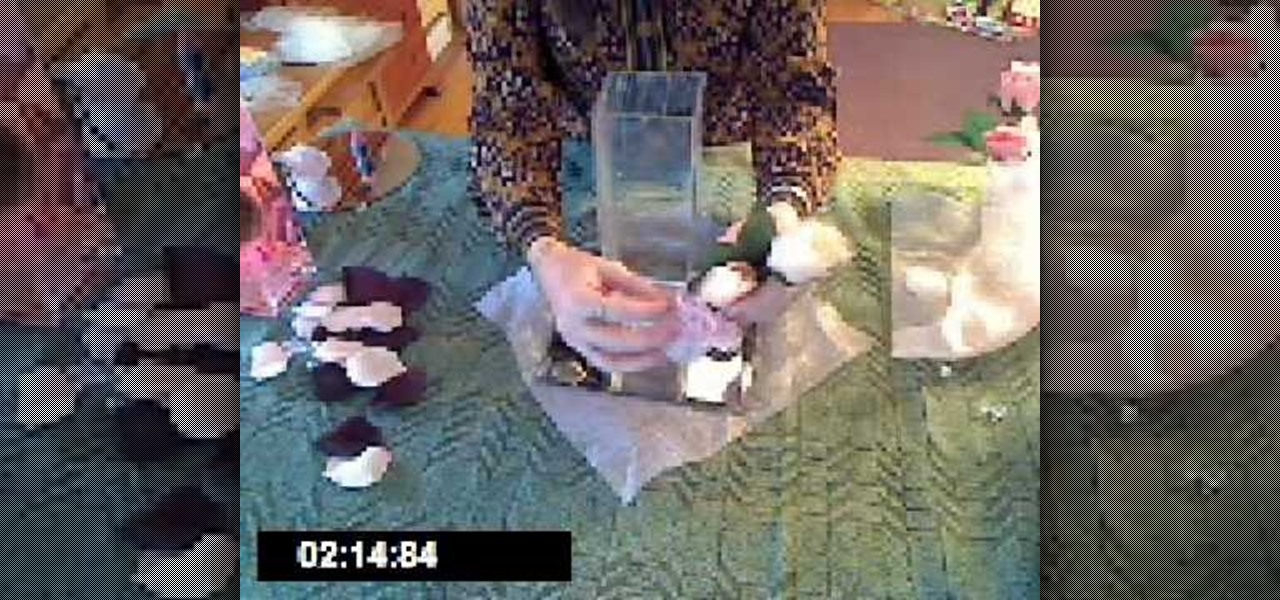
This video shows the viewer how to create a stylish centerpiece for a wedding reception using commonly available items. This is done by first placing a square mirror on top of a larger piece of light pink tulle. Then an artificial plant was selected and a number of glass beads were secured around the piece using another piece of tulle and a ribbon; this is to stop the plant floating. The plant is then placed in a tall square vase that is filled with water. A single drop of food dye is then ad...
Watch shader writer, Mario Marengo, explain spectral wavelength and how to utilize it within Houdini. This presentation was recorded at a Toronto Technical Evening hosted by Side Effects Software.
The first thing most of us noticed after Apple announced plans for its wearable—the Apple Watch—was the importance and focus they placed on its interface. Starkly different from their Android Wear counterparts, the Apple Watch's interface has applications scattered around the screen and relies on the device's dial to zoom in and out.
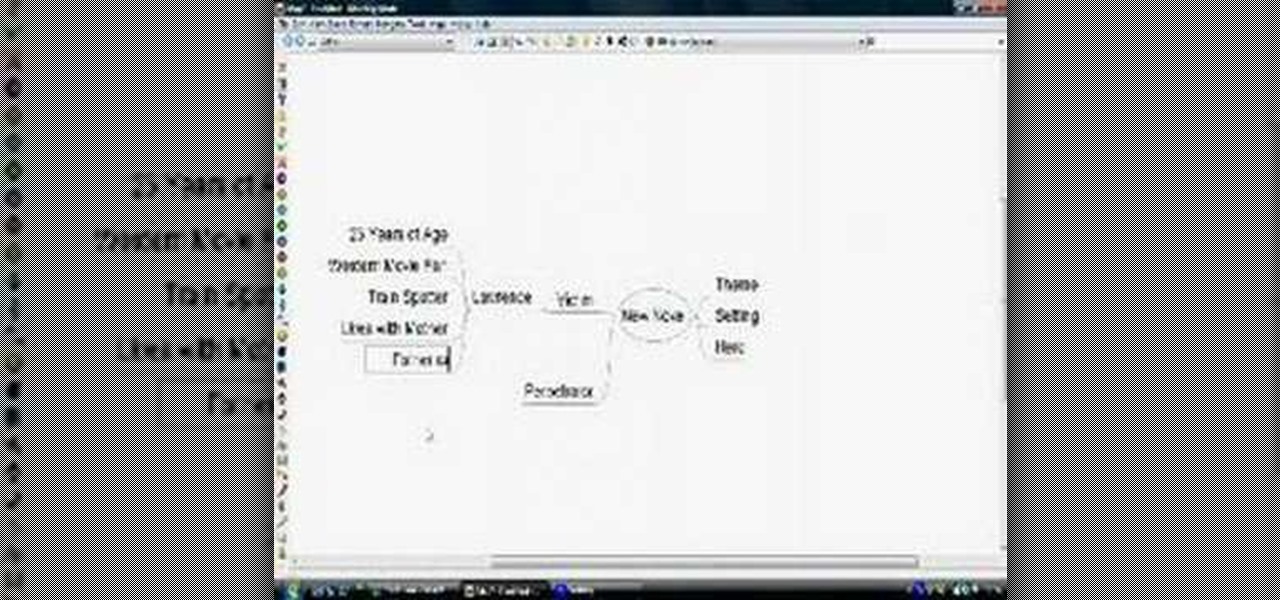
You can download Freemind for free from SourceForge.net, which will let you create and customize your own mind maps. These, in turn, you can use to plot a dramatic and exciting crime novel by organizing all the different aspects of the story, such as plot, setting, characters and motive.
How do you plot an ordered pair on a x, y grid? This video will explain everything, from the very basic idea to how to actual application. In this step by step tutorial, the viewers will be exposed to the techniques and skills required to accurately plot an ordered pair on the x, y grid. Each instruction is given with much clarity and explanation. Therefore, the viewers should have absolutely no problem plotting by themselves after viewing this tutorial video.
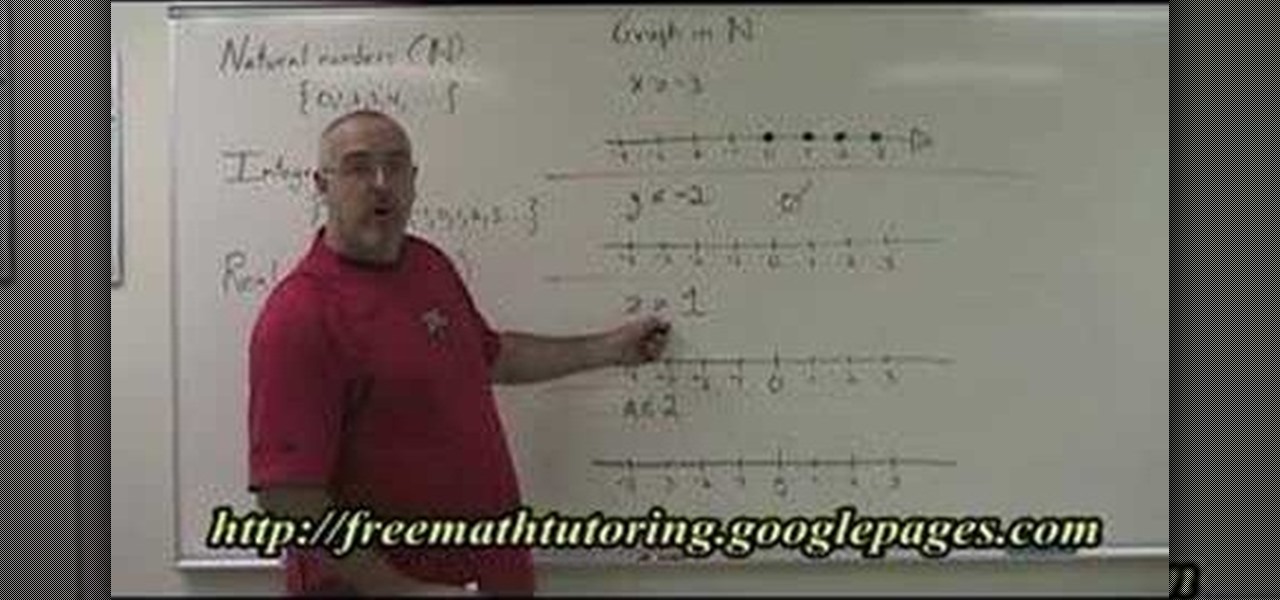
The video described here from [free math tutoring Freemathtutoring] teaches how to plot natural number on a number line in different situations. First, the author defines natural numbers, integers and real numbers. He then teaches different methods on how to plot natural numbers on a number line. The most important fact to remember is that natural numbers are greater than 0; they do not include negative numbers. Like wise, he explains different situations to plot natural numbers on a number l...
If you use Microsoft Excel on a regular basis, odds are you work with numbers. Put those numbers to work. Statistical analysis allows you to find patterns, trends and probabilities within your data. In this MS Excel tutorial from everyone's favorite Excel guru, YouTube's ExcelsFun, the 27th installment in his "Excel Statistics" series of free video lessons, you'll learn how to create a quantitative data dot plot chart using the REPT and COUNTIF functions.
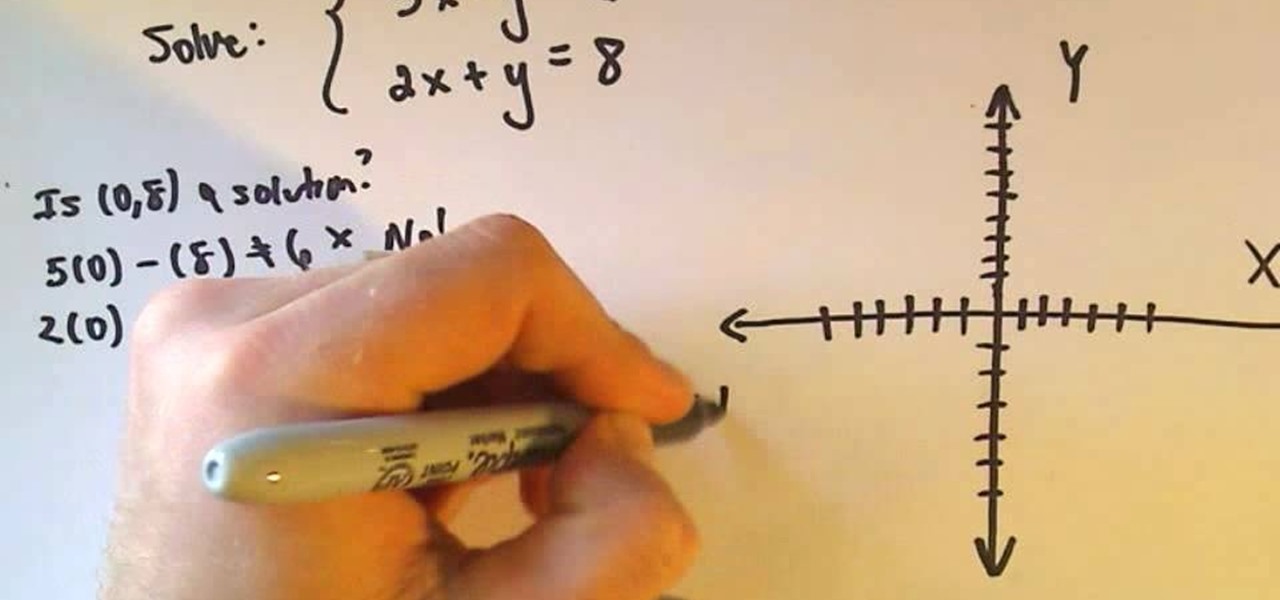
This video shows the method to solve a pair of linear equations by plotting their graph. Look for points of intersection of the two graphs which is the solution. Let us solve 5x-y=6 and 2x+y=8. Writing the equations of lines in slope intercept form, we get y=5x-6 and y=-2x+8. Now we plot the two lines. For the slope 5 or 5/1, we go up 5 units and left 1 units from the point of intersection on the y axis. For -2 or -2/1, we go down 2 units and left 1 units from the point of intersection on the...
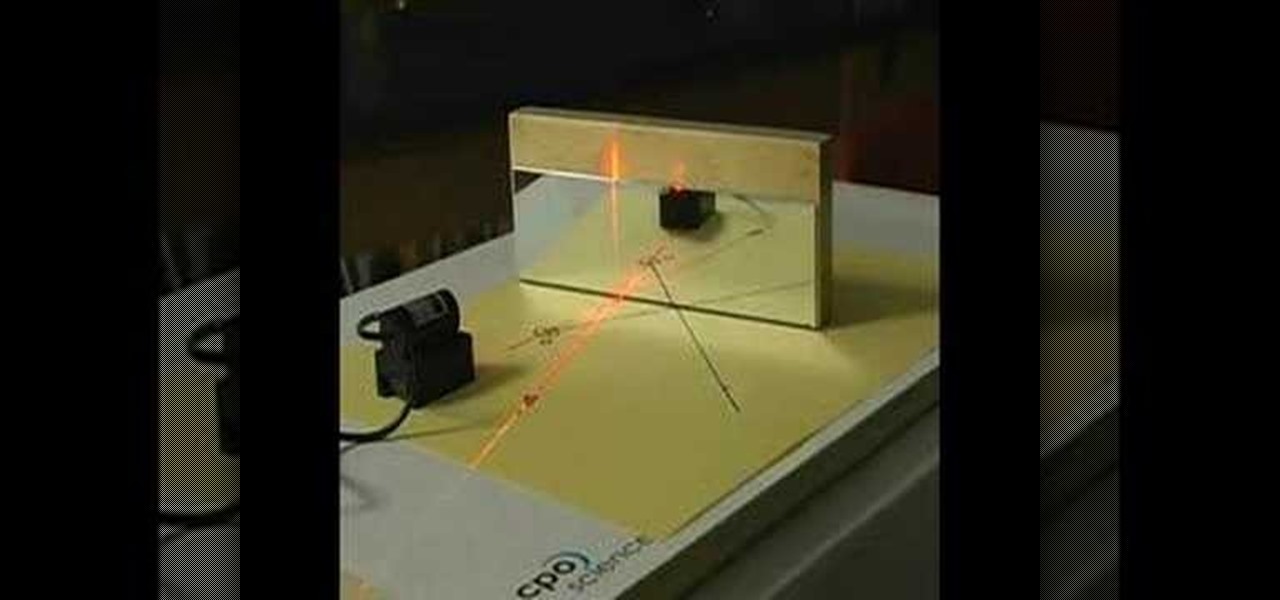
For both reflection and refraction scenarios, ray diagrams have been a valuable tool for determining the path of light from an object to our eyes.
Every budding writer needs to be able to work out the order of events that make up the plot, and one of the best ways to do this is to design an timeline. Learn how to organize your events and tighten up your plot when you utilize a timeline.
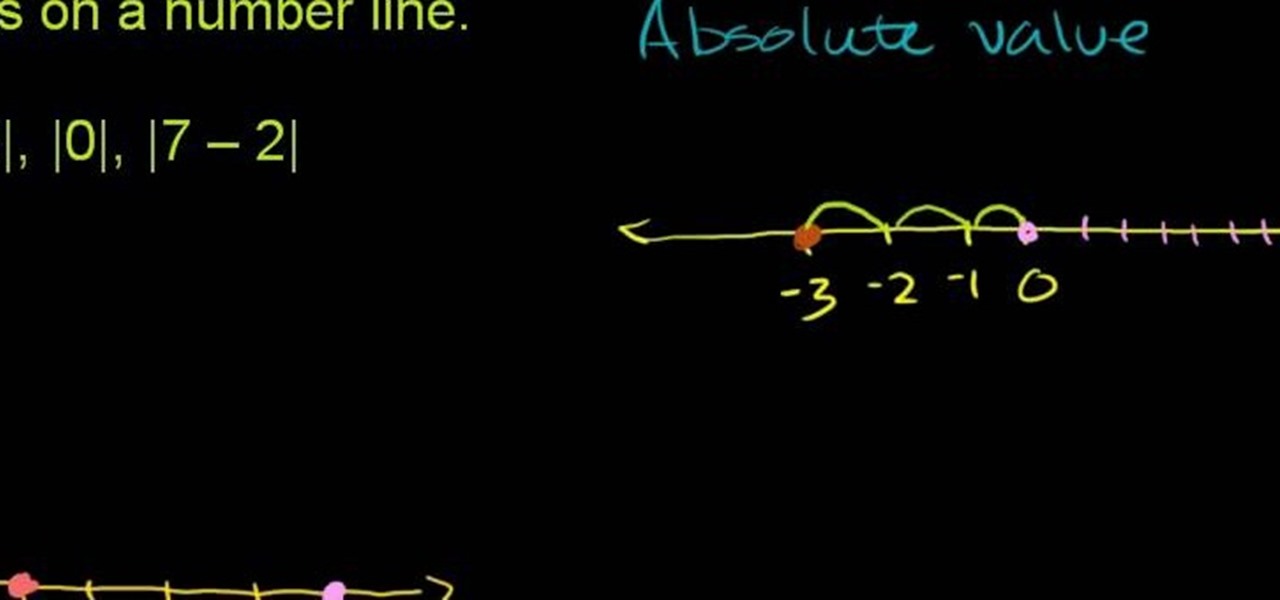
From Ramanujan to calculus co-creator Gottfried Leibniz, many of the world's best and brightest mathematical minds have belonged to autodidacts. And, thanks to the Internet, it's easier than ever to follow in their footsteps (or just finish your homework or study for that next big test). With this installment from Internet pedagogical superstar Salman Khan's series of free math tutorials, you'll learn how to plot absolute values on a number line in simple algebra/geometry.
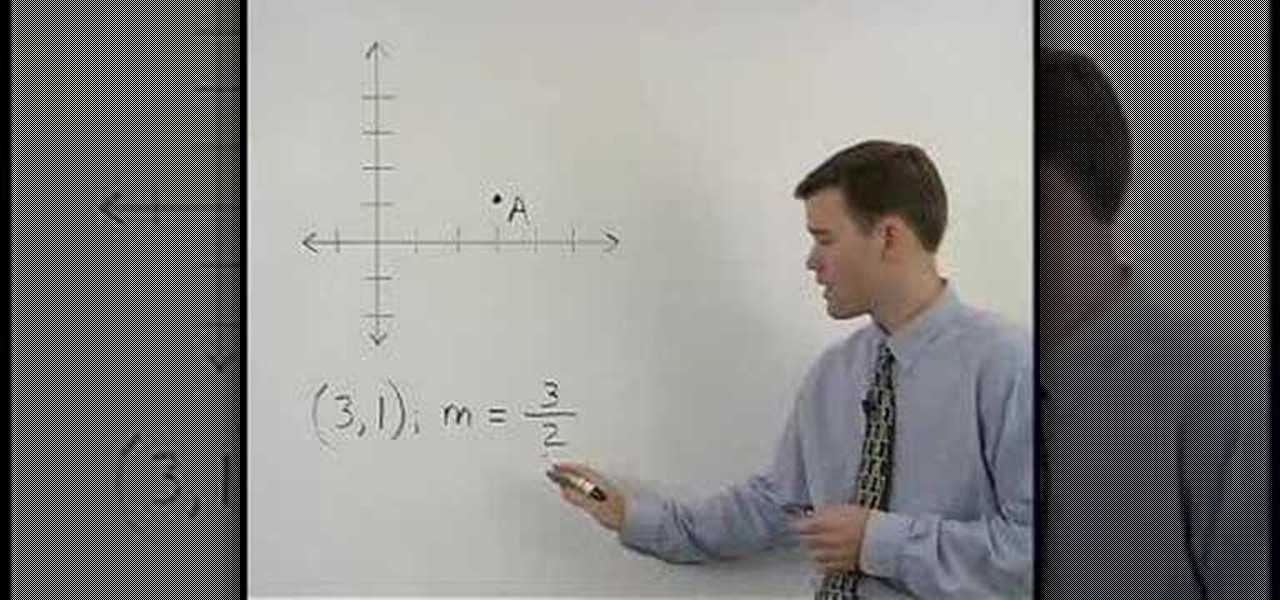
Given a point through which a line passes and the value of its slope you can graph the line. To do this first plot the given line. Now taking the slope and using the rise over run method plot a second point. Connect these two points and this gives you the graph of the line. Extend this line further on both sides to get the complete line. The point where this line cuts the x-axes is called the x-intercept and the point where this line cuts the y-axes is called the y-intercept. The important po...
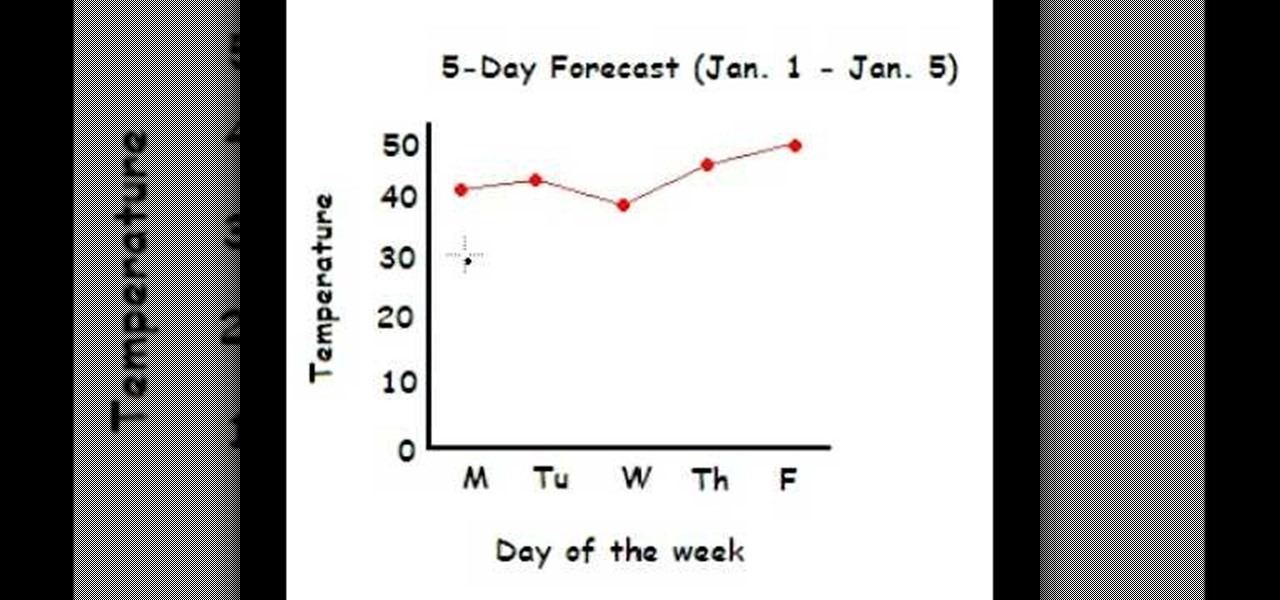
This video shows the method to make a line graph. First step involves drawing a horizontal and vertical line joined at one end. We have to plot the maximum and minimum temperatures during 5 days. Label the vertical with the temperatures(10, 20, 30...50) and the horizontal line with the days of the week(Monday....Friday). Label the vertical line as 'Temperature' and the horizontal line with 'Day of the week'. Plot the temperatures selecting the day from the horizontal line and marking at the c...
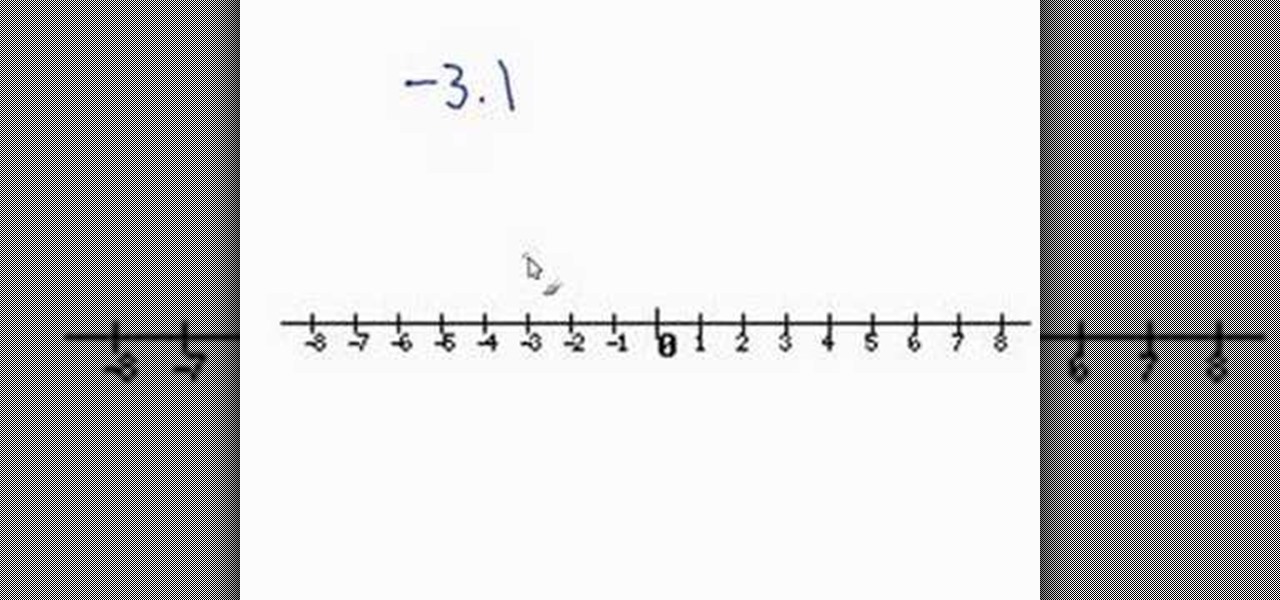
This video tells you how to plot a real number on a number line. For example consider -3.1. You know -3.1 lies between -3 and -4. You also know -3.1 lies very close or next to 3. So all you have to do is, put a point just before -3. Now you have marked -3.1 on a number line. Similarly you can point any real number on a number line. It is quite an easy job to plot real numbers on a number line.
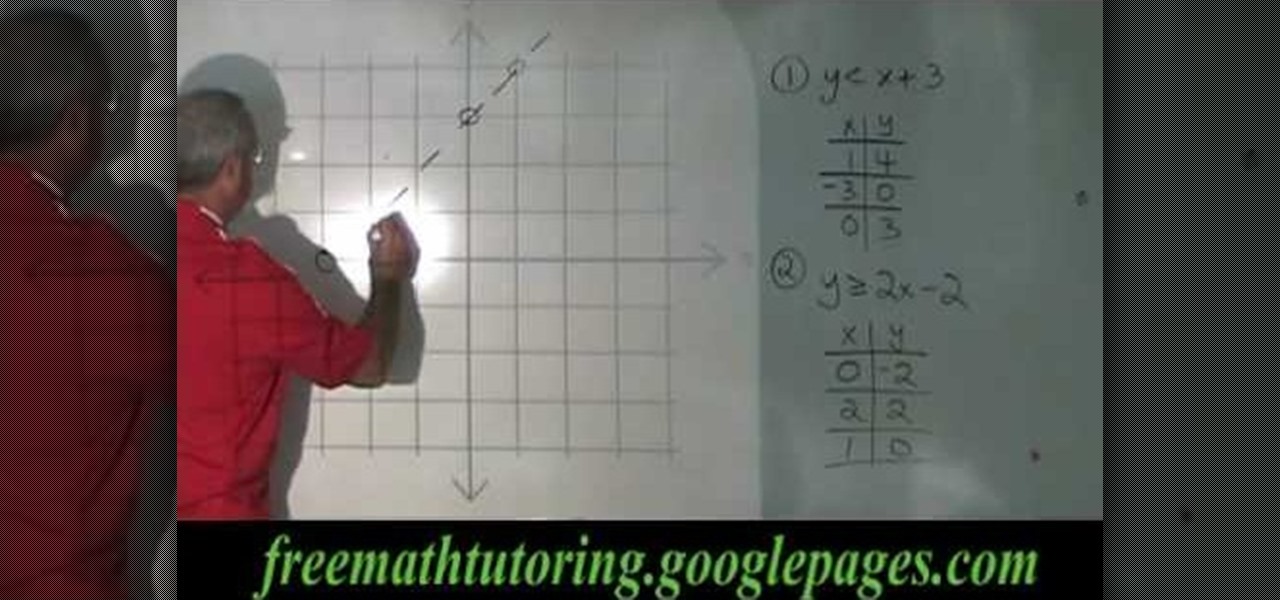
In this video the tutor shows when to use a dotted line and when to use a solid line while graphing lines in coordinate geometry. He says that we should use a dotted line to plot an inequality which contains the symbols less than or greater than. He also says that we should use a straight line when plotting an inequality which contains the signs less than or equal to and greater than or equal to. He goes on and demonstrates this idea with some examples. This video shows how to use different l...
This video will show you how to stack plow in Facebook's Flash game Farm Town. This only works if you are using Internet Explorer (IE). This involves making a plot and then stacking a second plot atop the first plot. This is stack plowing. This is a cool cheat for Facebook's Farm Town.
Country Story hacks, cheats, glitches. How to hack Country Story. Watch this video tutorial to learn how to plot hack Country Story on Facebook (08/22/09).
Something to look out for when hunting, is small food plots that are surrounded by trees and offer a good area for things to be grown. These areas are perfect for growing certain plants that would attract deers for months and months. In this video tutorial, you'll be finding out how to use these small food plots when you're out hunting. It's easy to follow and will make life easier for you. Good luck and enjoy!
The scenario: The Super Bowl. The stakes: Humiliation. The results: Incredibly satisfying. Learn how to plot the most humiliating sports bet ever. You will need someone to bet against, your team's jersey, face paint, coasters, a razor, a poker game, and an (optional) bikini wax.
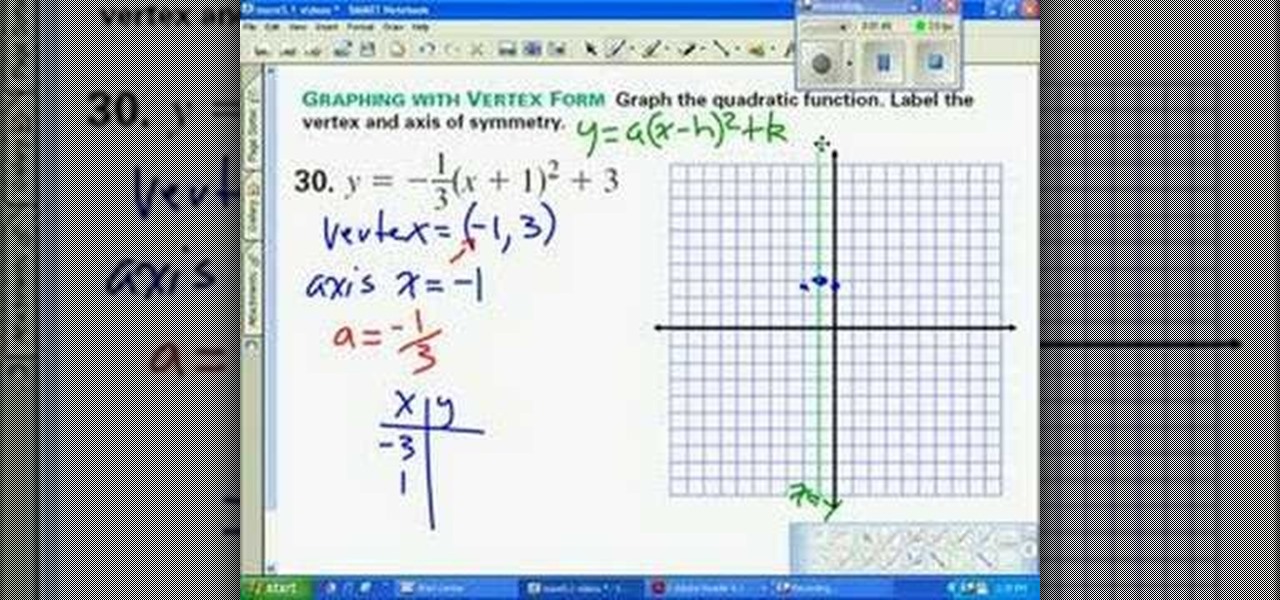
This video shows viewers who are interested in mathematics how to graph a parabola whose formula is displayed in vertex form, or the form y=a(x-h)^2+k, where the vertex is (h, k). After determining the vertex, plot it on your graph. After graphing your vertex, your axis of symmetry would be x= h, or the x-coordinate of your vertex. The a value in your equation will act as your slope in this case, and your should graph the two points which correspond to this slope on your plot 1 unit away on e...
New to Excel? Looking for a tip? How about a tip so mind-blowingly useful as to qualify as a magic trick? You're in luck. In this Excel tutorial from ExcelIsFun, the 124th installment in their series of digital spreadsheet magic tricks, you'll learn how to create a box plot or box-&-whisker chart using a stacked bar chart and a open-high-low-close stock chart. You'll also learn how to use the QUARTILE function.
Facebook is the number one Social Networking site that hosts the number way farming game, FarmVille! This video will give you a few basics to bring you back to your farming roots! Your game screen will show your plot of land surrounded by some neighbor's farms. Using your click took, plow tool or shovel tool you can plant, delete, move and plow your plots of land. The market shows you the crops that are available to buy as well as buildings, animals and decorations too! Watch the rest of the ...
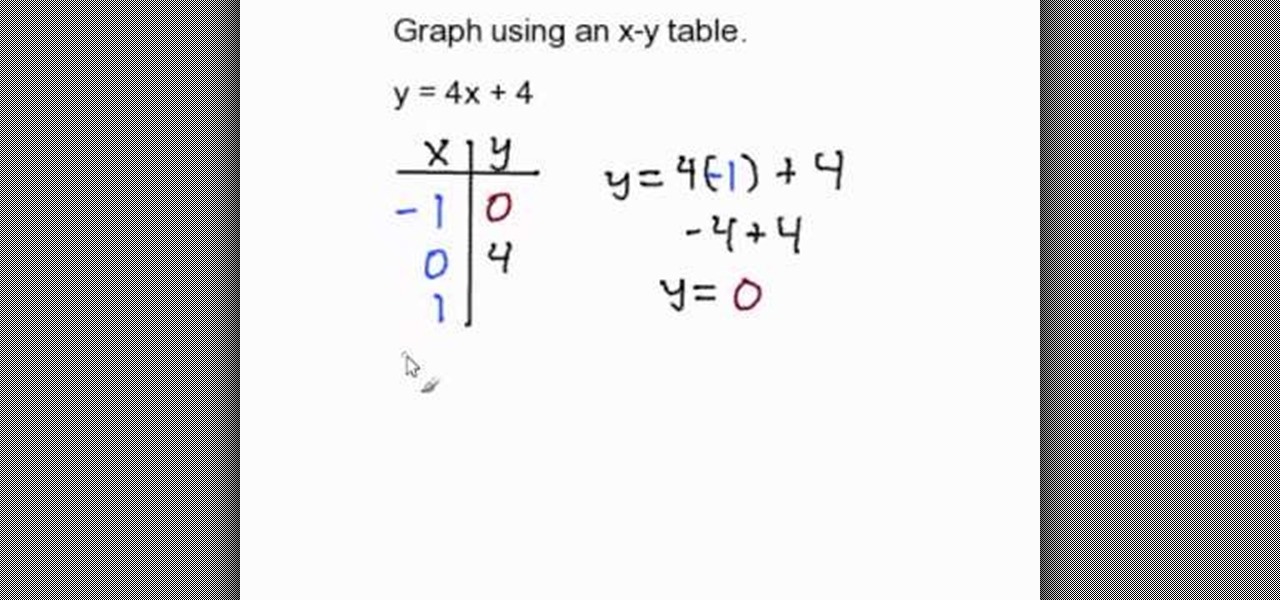
In this video the author shows how to graph using an X-Y table. He shows how to do this with a sample equation. He builds a table of x, y values where he takes sample values for x like -1, 0, 1 and now he substitutes these values in the equation of the line and obtains the corresponding y values. Now finally he has an x, y value table which now he shows how to plot it on a coordinate plane. He plots all the three pairs on the graph and connects them with a line finally obtaining the resultant...
When you begin to graph equations you will need to know how to do so in different ways. In this tutorial, learn exactly how to graph linear equations by plotting points.
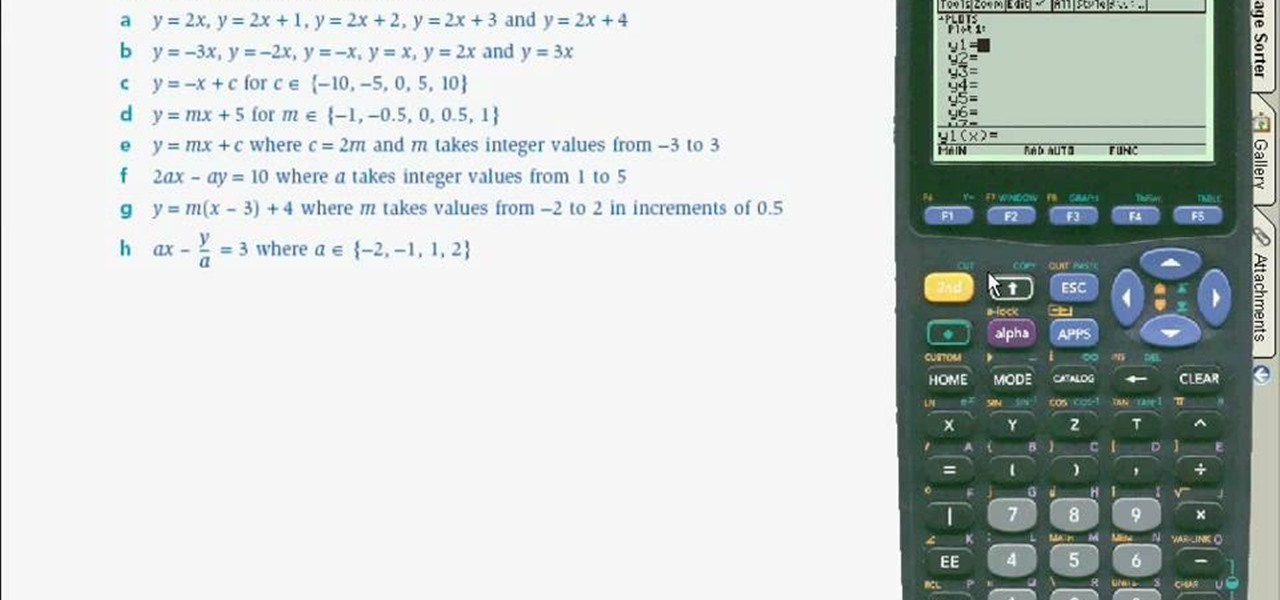
This video shows the user how to use a T189 calculator to plot linear equations. The video demonstration is done using an ‘on screen’ representation of the calculator – there are also verbal instructions. The equations are plotted on the same axis by selecting the ‘y=’ function. The corresponding values of y in terms of x are then inputted into the graphical calculator. Once this has been done for every equation you can get the calculator to display the graph. This then allows you to compare ...
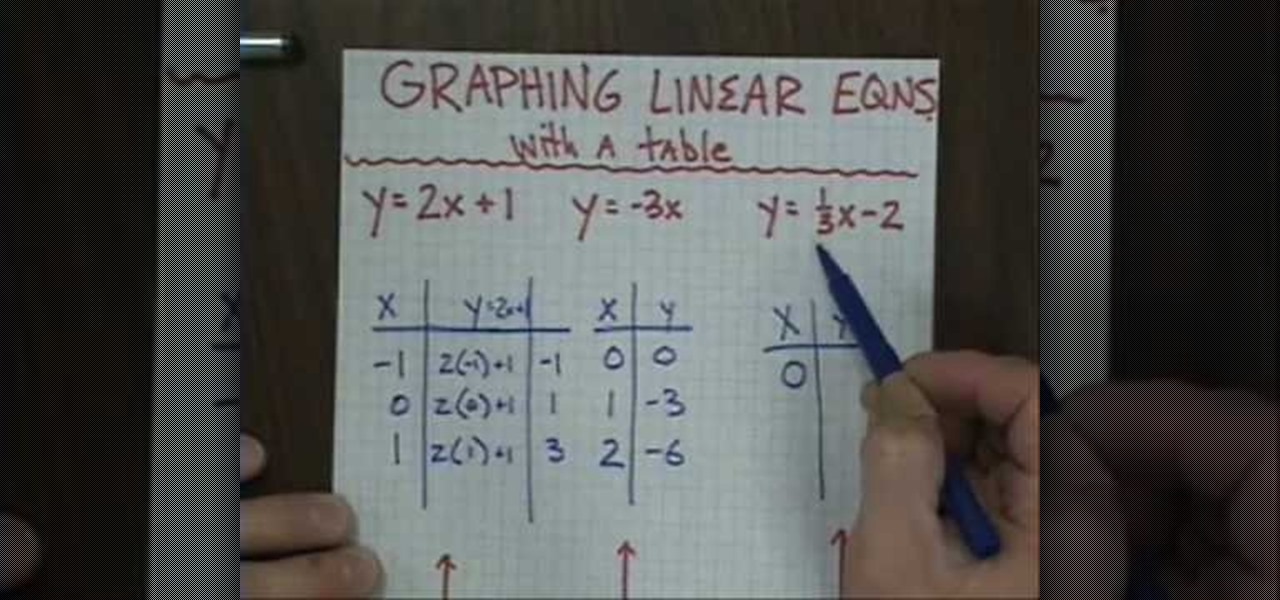
The author teaches us how to graph the linear equations with tables. Given a set of linear equations in terms of "x and y", first we have to draw a table having a column each for x and y. We have to enter an arbitrary value of x in that table and substitute that value in the given equation to get the corresponding y value. Once you obtain both x and y values, the next step is to plot them in a graph. Consider an example: in the linear equation x=2y,on substituting an arbitrary value of x=2,we...
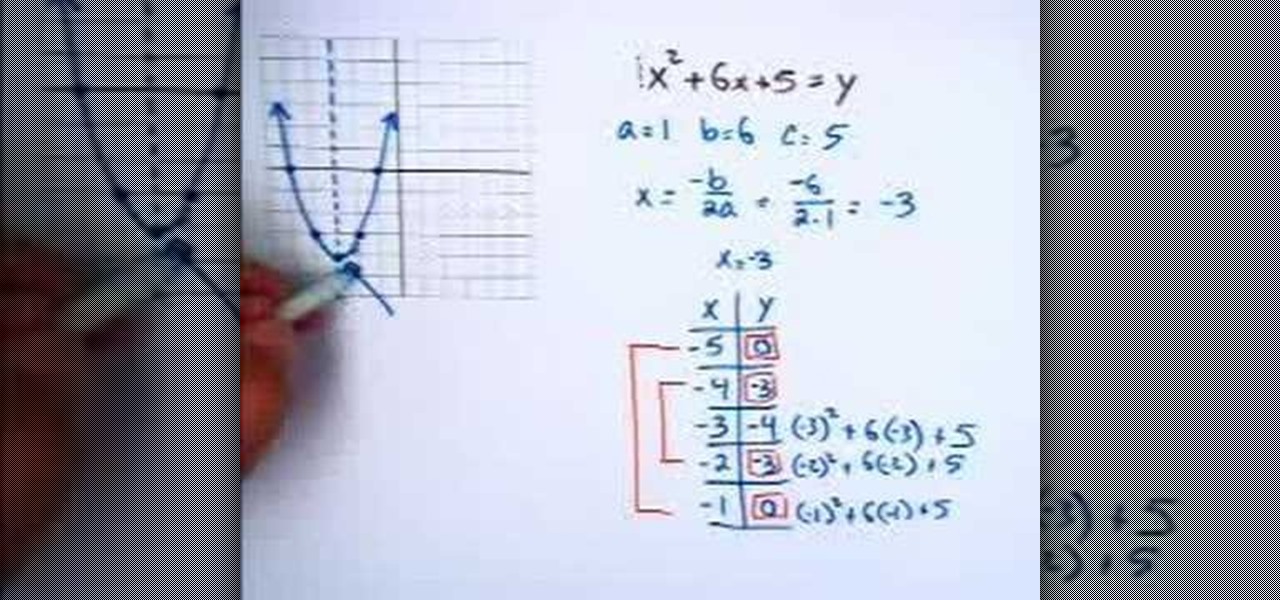
In this video, the instructor shows you how to graph quadratic equations. When you have a quadratic equation in terms of x and y, first try to identify the coefficients of the terms. Now use front end of the quadratic formula to find the line of symmetry which is the first half of the vertex using the formula x = -b/2a. This gives the line of symmetry. Next, plot the line using a few points starting at the line of symmetry. Take sample values of x and find the corresponding values of y on eit...
In this video the instructor shows how to sketch the graph of x squared and square root of x. The first equation is the x squared which is y = x * x. Now to sketch this take a sample values of x and substitute in the equation to get the value of y. Similarly find the set of points for the equation. Finally plot these points and sketch this graph which is in the form of a parabola. The curve is in the form of alphabet 'U' with its vertex at the bottom. Now similarly take the square root of x e...
This video teaches us to draw the graph of a piecewise function. This is shown using two examples. In the first example we have 'y' equal to 'x + 2' for x less than zero and '1 - x' for x greater than equal to zero. We plot two points on the function for x less than zero and do the same for the function with x greater than equal to zero. The graph for the first function is erased for x greater than equal to zero, and the same is done for the second function for x less than zero. Note that the...
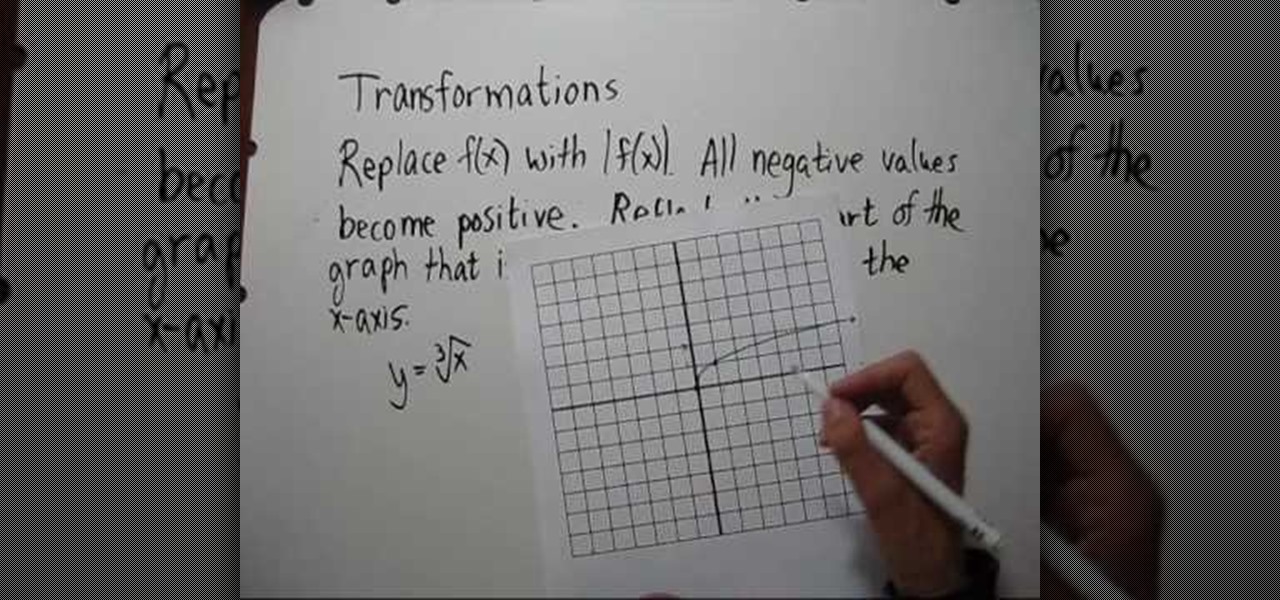
This video shows the method to plot the graph of the absolute value of a function. The video shows the example of the function of cube root of 'x'. The demonstrator first plots the graph of a cube root function. This is done by taking the reference point of positive one and positive eight. The graph is drawn for both negative and positive values of 'x'. After this the graph of absolute function is drawn by taking the absolute value of the cube root function. The resultant graph comes out to b...
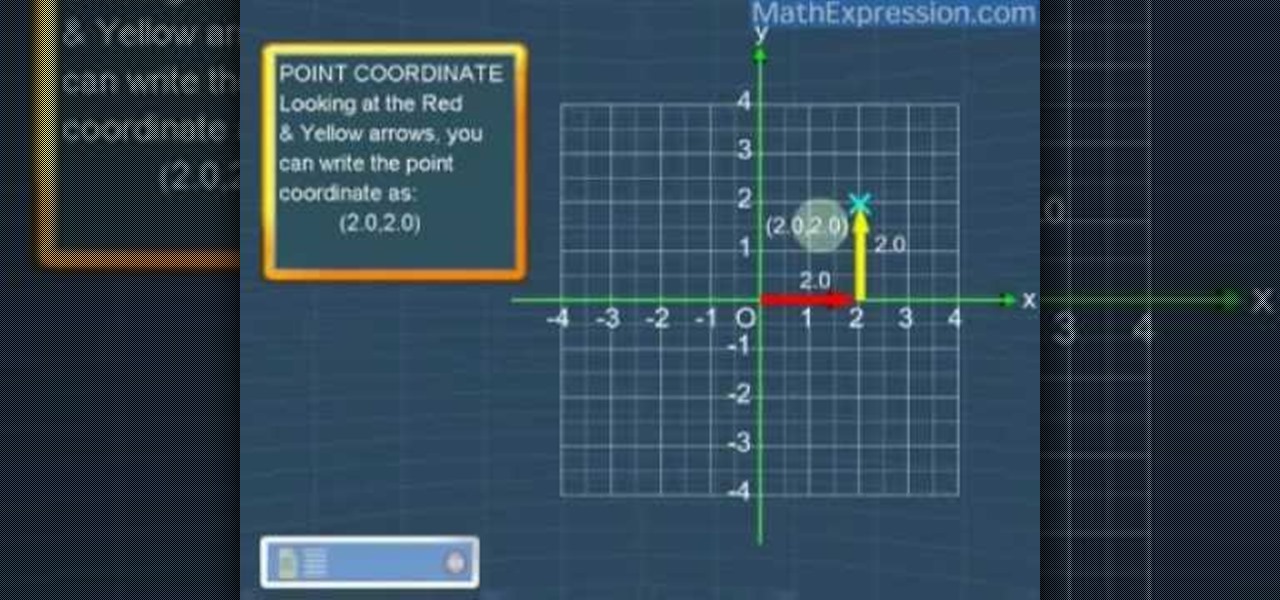
In this video the author shows how to plot a point on the coordinate plane. He explains about the coordinate plane and shows how to read and write points to it with an example. He says that any point on the coordinate plane has an x, y- coordinate values. He says that for any point its projection on the x-axis is its x-coordinate and the points projection on y-axis is its y-coordinate. He shows how to find this out for a sample value and plots the coordinates of it. In this video the author u...
Pixel Perfect is the "perfect" show to help you with your Photoshop skills. Be amazed and learn as master digital artist Bert Monroy takes a stylus and a digital pad and treats it as Monet and Picasso do with oil and canvas. Learn the tips and tricks you need to whip those digital pictures into shape with Adobe Photoshop and Illustrator. In this episode, Ben shows you how to create hair and fur with the pen tool in Photoshop.