It's getting harder and harder to escape ad tracking by the day. For the latest example, look no further than T-Mobile. The No. 2 carrier updated its privacy policy on Feb. 23, 2021, indicating that it would start sharing customer data with advertisers under the guise of more relevant ads starting April 26. If that's not something you'd like to participate in, there's a way to opt-out.

With Gboard, Google created a keyboard with more functionality than just inputting words. The app includes features such as GIF search and live text translation, but it gets even better when you let it learn more about you. With this data, Gboard grows from a good keyboard to one that can complete your sentences.

So much information exists online that it's easy to get lost in data while researching. Understanding the bigger picture can take a lot of time and energy, but narrowing the question to one that's easy to answer is the first step of any investigation. That's why analysts use open-source intelligence (OSINT) tools like Maltego — to help refine raw data into a complete understanding of a situation.

Shopping around for a good broadband company or mobile carrier may soon be as easy as shopping for cereal, thanks to the introduction of broadband consumer labels by the FCC for both fixed and mobile broadband.

If you use Microsoft Excel on a regular basis, odds are you work with numbers. Put those numbers to work. Statistical analysis allows you to find patterns, trends and probabilities within your data. In this MS Excel tutorial from everyone's favorite Excel guru, YouTube's ExcelsFun, the 24th installment in his "Excel Statistics" series of free video lessons, you'll learn how to create quantitative data frequency distributions with pivot tables. See how to create the correct unambiguous labels ...

If you use Microsoft Excel on a regular basis, odds are you work with numbers. Put those numbers to work. Statistical analysis allows you to find patterns, trends and probabilities within your data. In this MS Excel tutorial from everyone's favorite Excel guru, YouTube's ExcelsFun, the 12th installment in his "Excel Statistics" series of free video lessons, you'll learn how to use Advanced Filter 'Unique Records Only" to extract a list of unique items from a data base, and then use the COUNTI...

Check out this informative video tutorial from Apple on how to format data values with the format bar in Numbers '09.
Core Data is a powerful data-management framework introduced with Mac OS X v10.4 Tiger. When you take advantage of Core Data, it slashes the amount of custom code you need to write in order to manage application data. Opening, saving and undo management can all be handled by Core Data, freeing you to concentrate on creating unique features for your application. This video tutorial, which presents a general introduction to using Core Data, will walk you through the process of building a simple...
This free video science lesson from Northern Kentucky University demonstrates a simple technique for crushing an aluminum soda can with air pressure. For all of the relevant details, and a complete demonstration of the experiment itself, watch this video guide.
This five-part series on C# programming covers many things. First, you learn how to save to the Microsoft SQL Server. Then, you'll learn how to retrieve that data. You'll also learn how to navigate the DataSet, edit SQL data, and delete data. If you have Microsoft Visual Studio and SQL Server, give this lesson a try.
If you use Microsoft Excel on a regular basis, odds are you work with numbers. Put those numbers to work. Statistical analysis allows you to find patterns, trends and probabilities within your data. In this MS Excel tutorial from everyone's favorite Excel guru, YouTube's ExcelsFun, the 32nd installment in his "Excel Statistics" series of free video lessons, you'll learn how to group when the quantitative data are whole numbers, integers or discrete data and how to group when the quantitative ...
New to Microsoft Excel? Looking for a tip? How about a tip so mind-blowingly useful as to qualify as a magic trick? You're in luck. In this MS Excel tutorial from ExcelIsFun, the 255th installment in their series of digital spreadsheet magic tricks, you'll learn how to create a two-variable data table in Excel for what-if analysis. See the PMT function and learn about the formula equivalent to a data table.
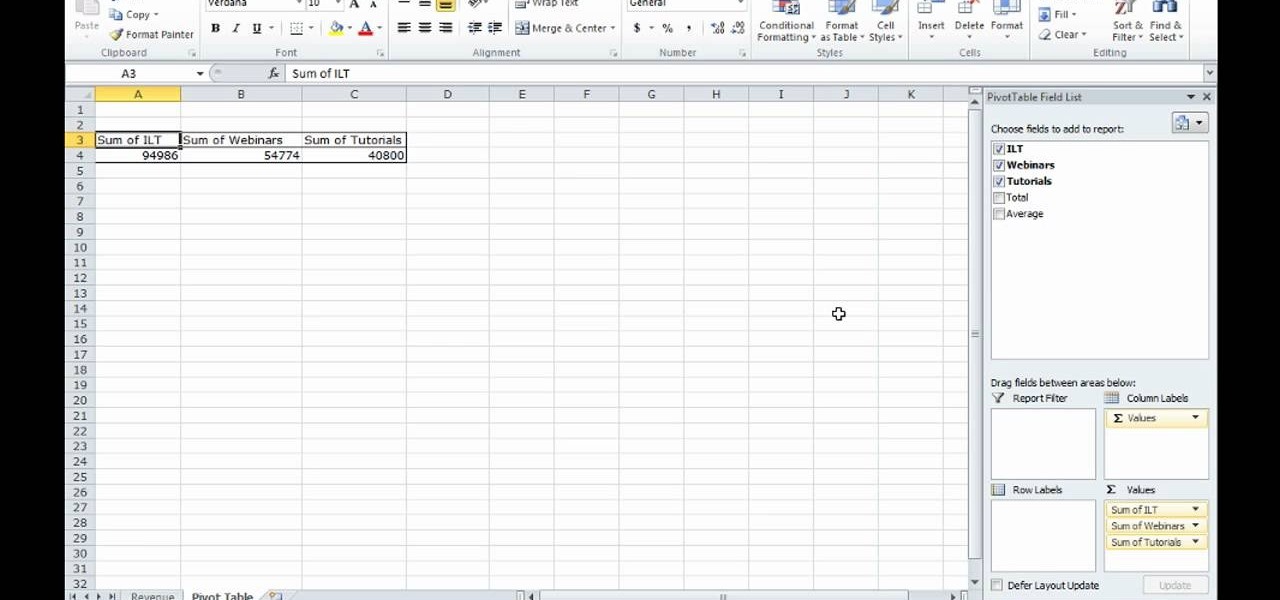
This video shows how to make a quick pivot table data filtering by using Excel 2010's ‘Slicer’ functionality. ‘Slicer’ delivers enhanced visual filtering method to allow you to get the data you need more quickly. When selecting a cell in the pivot table you will find ‘Slicer’ in the filter group of the ‘Insert’ tab. Click on ‘Slicer’ and an 'Insert Slicer' dialogue shows up where you can pick particular data fields from the slider list. Once you click on ‘OK’, the ‘Slicer’ objects with filter...
With all the recent activity around augmented reality, the possibilities involving immersive computing and commerce are quickly becoming obvious, and digital payments giant PayPal has no plans to sit on the sidelines
Custom Timelines (CTs) allow you to control exactly which Tweets appear in a column on Tweetdeck. So if a particular event catches your eye as newsworthy you can tailor your CT to show what you consider to be the most relevant Tweets. These CTs can then be customized, shared and embedded on your website. This is a great way of increasing interaction on Twitter and sharing current, interesting and breaking news stories from any niche or subject
Excel is great, and if you're a Mac user, Excel 2008 for Mac has a lot of new and useful great features you can use to maximize efficiency in your spreadsheets. Excel doesn't have to be the boss anymore, you can! The Microsoft Office for Mac team shows you all the great features in this how-to video.
Data can be troubling, especially if there's a ton of it plaguing your Excel worksheet. But Excel 2008 for Mac makes life a little easier and less confusing thanks to a few worksheet tips and features you can utilize to work with your data in worksheet cells. The Microsoft Office for Mac team shows you just how to work with worksheets in this how-to video.
Not every client or coworker likes to mine through a spreadsheet to find all the important data. So, with Excel 2008 for Mac, you can easily share that data without sending the entire Excel spreadsheet. To do this, all you need to do is to use the "copy as picture" option. The Microsoft Office for Mac team shows you just how to insert a spreadsheet snippet in this how-to video.
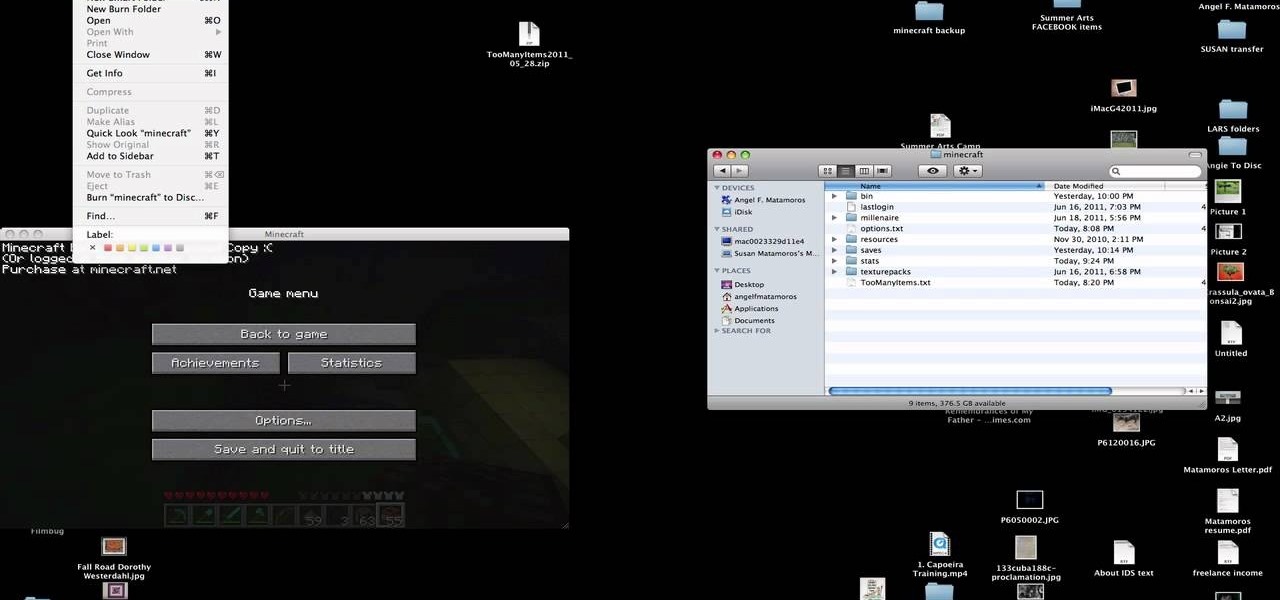
You have worked long and hard creating an entire world of Minecraft data. Make sure you have all of that saved data backed up. Watch this video to learn how to backup your Minecraft data. You will be glad that you did.
Thirty dollars a month may be a little steep for an unlimited data plan for iPad users. To cut down on your data usage, you can download the Offline Pages app to browse articles or blogs offline. InstaPaper is another account you can use as well, and both will cut down on your data usage per month.
A histogram is a summary graph showing a count of data points that fall in various ranges. Histograms are used in statistics and other forms of mathematics. In this video, learn how to create your own histogram using data analysis on the computer. This tutorial will show you how to create a frequency distribution, a cumulative frequency distribution, a histogram chart and an ogive chart with the data analysis add-in.
This origami video tutorial shows how to make a box with a lid out of two sheets of paper. This fold makes a great gift box for small presents. This is relevant with the upcoming holidays like Christmas, Hanukkah and Valentine's Day all around us. It's also a good idea for adding a personal touch to a birthday present or to hold a first year anniversary gift... (the first year is paper guys).
See how simple it is to create data-driven web sites using ASP.NET 2.0, Visual Web Developer 2005 Express Edition, and SQL Server 2005 Express Edition. Watch this video tutorial to learn how to create a database, add its data, and display that data on a web page.
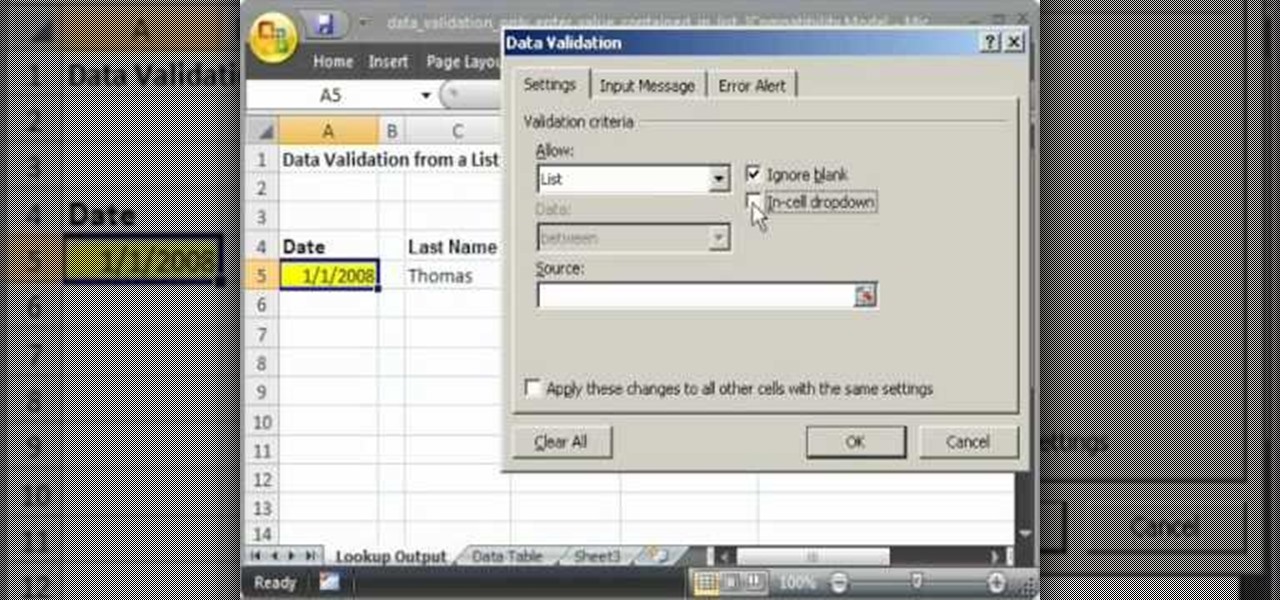
This video shows you how to idiot-proof a data set in Excel pretty much. It demonstrates how to enable data validation in a cell, so that when you type something in it must be in a predetermined list or will not work. Start by typing in your data table in a second tab. His example is a date, then information about certain employees based on that day. To enter the data validation menu, click the cell you want to use and then hit ALT+D+L to bring it up. Go to settings, then under the Allow menu...
Looking to find the standard deviation of your set of values? Standard deviation quantifies how diverse the values of your data set are, and is useful in determining how different your numbers are from each other.
In Halo: Reach for the Xbox 360, there is so much to do! The campaign, the multiplayer, the achievements! But One tough one to get is all 19 hidden data pads. Luckily for you, the first nine can be acquired on any difficulty, and in this video you will learn the locations of all nine of the initial data pads on levels such as Winter Contingency and Pillar of Autumn!
We all have our reasons for erasing personal data from a phone. Whether you just ended a bad relationship whose face you never want to see again (lots of text messages) or just want to restore your privacy on the cell phone, erasing may be your only option.
If you use Microsoft Excel on a regular basis, odds are you work with numbers. Put those numbers to work. Statistical analysis allows you to find patterns, trends and probabilities within your data. In this MS Excel tutorial from everyone's favorite Excel guru, YouTube's ExcelsFun, the 27th installment in his "Excel Statistics" series of free video lessons, you'll learn how to create a quantitative data dot plot chart using the REPT and COUNTIF functions.
If you use Microsoft Excel on a regular basis, odds are you work with numbers. Put those numbers to work. Statistical analysis allows you to find patterns, trends and probabilities within your data. In this MS Excel tutorial from everyone's favorite Excel guru, YouTube's ExcelsFun, the 16th installment in his "Excel Statistics" series of free video lessons, you'll learn how to cross tabulate & do percentage cross tabulation for categorical data using a pivot table (PivotTable).
If you use Microsoft Excel on a regular basis, odds are you work with numbers. Put those numbers to work. Statistical analysis allows you to find patterns, trends and probabilities within your data. In this MS Excel tutorial from everyone's favorite Excel guru, YouTube's ExcelsFun, the 17th installment in his "Excel Statistics" series of free video lessons, you'll learn how to cross tabulate & do percentage cross tabulation for categorical data using formulas rather than pivot tables.
If you use Microsoft Excel on a regular basis, odds are you work with numbers. Put those numbers to work. Statistical analysis allows you to find patterns, trends and probabilities within your data. In this MS Excel tutorial from everyone's favorite Excel guru, YouTube's ExcelsFun, the 10th installment in his "Excel Statistics" series of free video lessons, you'll learn how about data sets and the nominal, ordinal, interval and ration scales/levels of measurement and see two Pivot Tables that...
There is so much information in the world that trying to make sense of it all can be daunting. That's where data analytics comes in. By learning how to inspect and model data, you can take large data sets and transform them into highly valuable information that can take any business further.
Data is king. Nearly every carrier and MVNO offers unlimited talk and text with their cellular plans. Where they differ is the amount of data available, so that's the part that can save or cost you the most money.
The nemesis of music streamers is data caps, cell phone or otherwise. Restricting monthly data and forcing users to decide between quantity and quality of music has had audiophiles tearing their hair out since streaming toppled the iPod. While the problem regarding music quality seems difficult to tackle, it's far from impossible.
There're plenty of great ways to get traffic, especially this off-site optimization technique using classified ads to point website traffic back into your site itself.
Smartphones are becoming pocket computers, jammed full of data essential to our personal and professional lives. With AT&T's 360 Backup app you can protect your important information with the push of a few buttons.
If you picked up a new Xbox 360 Slim, the first thing you're going to want to do is transfer all your old saved game data from your old Xbox 360 to the new internal hard drive in the Slim 360.
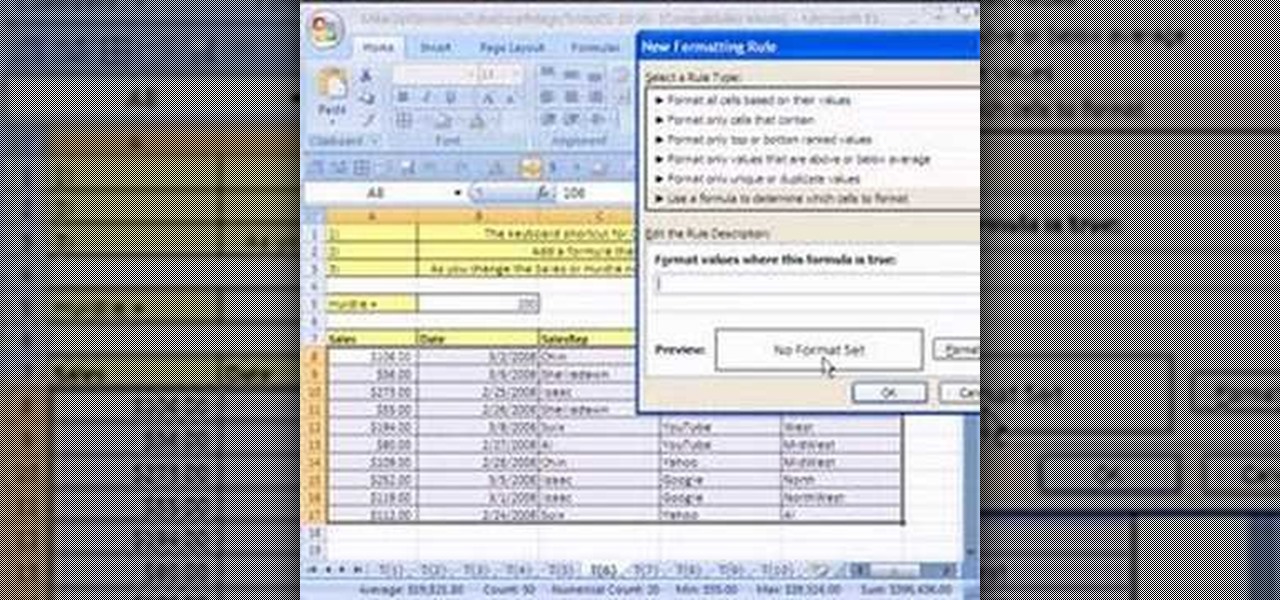
New to Microsoft Excel? Looking for a tip? How about a tip so mind-blowingly useful as to qualify as a magic trick? You're in luck. In this MS Excel tutorial from ExcelIsFun, the 6th installment in their series of digital spreadsheet magic tricks, you'll learn how to add conditional formatting to a whole row of data in an Excel sheet.
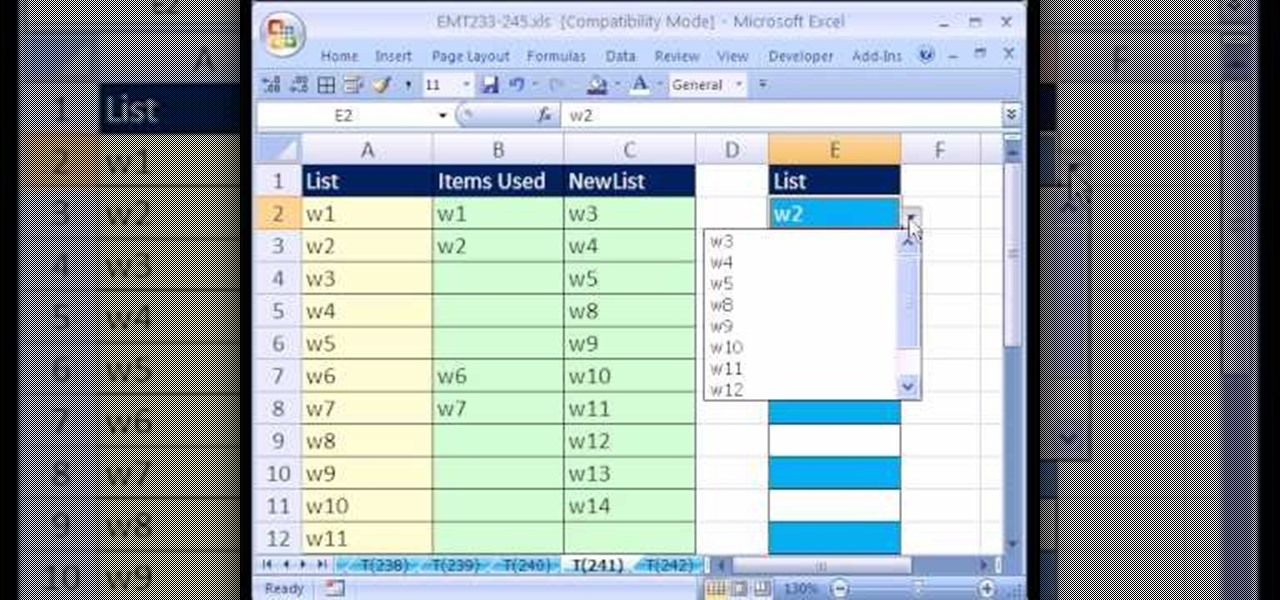
New to Microsoft Excel? Looking for a tip? How about a tip so mind-blowingly useful as to qualify as a magic trick? You're in luck. In this MS Excel tutorial from ExcelIsFun, the 241st installment in their series of digital spreadsheet magic tricks, you'll learn how to create a data validation drop-down cell list where the list shrinks as you select values.
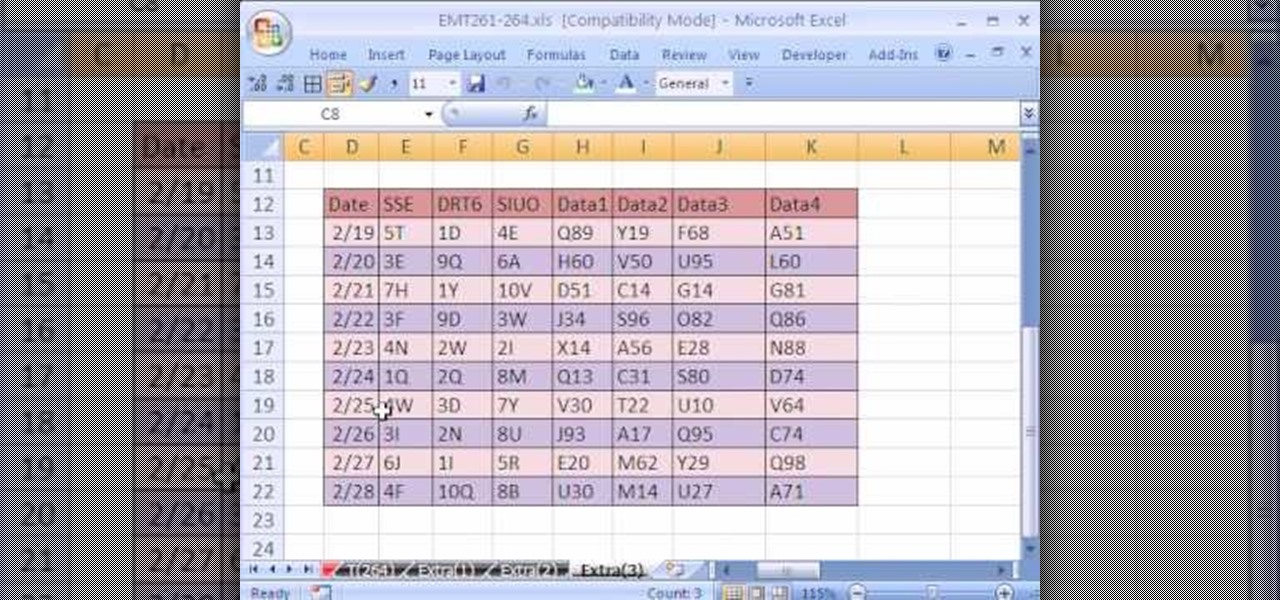
New to Excel? Looking for a tip? How about a tip so mind-blowingly useful as to qualify as a magic trick? You're in luck. In this Excel tutorial from ExcelIsFun, the 264th installment in their series of digital spreadsheet magic tricks, you'll learn how to use a recorded macro to take a data set and add a new column, concatenate data from 3 columns, and delete unwanted columns.