Video: . Extraterrestrial life is life that does not originate from Earth. It is also called alien life, or, if it is a sentient and/or relatively complex individual, an "extraterrestrial" or "alien" (or, to avoid confusion with the legal sense of "alien," a "space alien"). These as yet hypothetical forms of life range from simple bacteria-like organisms to beings far more complex than humans. The possibility that viruses might exist extraterrestrially has also been proposed.

The Billboard Charts have been a measurement of commercial success for pop songs since roughly the time that radios became a household item. In its modern form, Billboard ranks the sales and performance of all singles with its "Hot 100" chart, as well as many other genre-specific rankings.

Recently, Mike over on Samsung Galaxy S4 softModder showed how to scroll from the bottom to the top of a page with a single tap, a feature that Apple is well known for, and something I missed very much on my Galaxy Note 3. However, there's always room for improvement.

ATTN: HUMOUR ALERT Jules Verne was an author of immense imagination, who had a profound effect on speculative fiction, whereas Victoria was a stodgy & pampered royal who led a sheltered and traditional existence. Boring, frumpy, grumpy royal! (Photo from The Guardian, UK)

Ever since the mid-2000s, there's been a lot of bandying back and forth on the Internet over what exactly Steampunk is. Some people think it's one thing, others another thing, and some think that it shouldn't be defined at all.

The figure 8 is the basis of rave light show technique, whether you use gloves or glowsticks (you oldskooler you). If you've been having some trouble getting it down watch this video for a succinct and helpful explanation of the wrist motion that is essential to really good figure 8's.

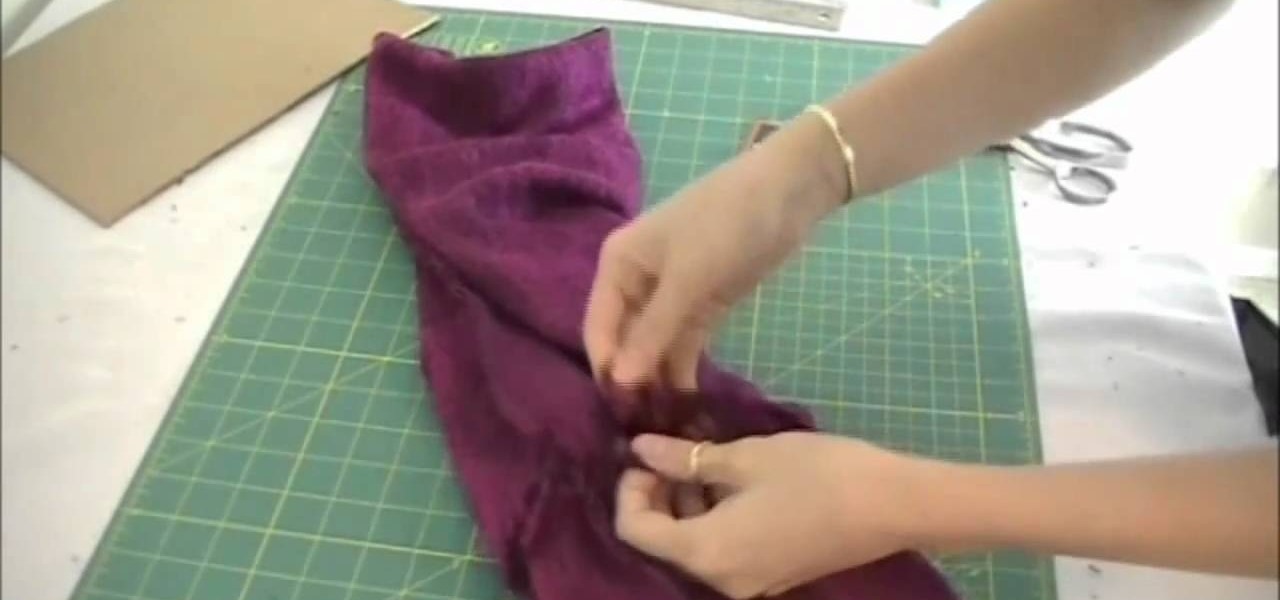
Infinity scarves are ridiculously easy to make at home. All you need is a long strip of thick fabric in a print you enjoy and some basis sewing utensils.
Need a complementary, beautiful hairstyle to go with your Greek goddess costume this Halloween? Then this braided goddess updo is exactly what you're looking for. While this look is great for a Halloween costume, it's also not too showy to be worn on a daily basis.
The bone tool is one of the most important tools in Flash for creating basic animations. It allows you to give your characters virtual bones which you can manipulate to make them move. This video tutorial will show you how to use the bone tool to create a simple animation of a dancing cartoon cow. It is very cute, and this tool will be the basis of many of your future, more cinematic works.
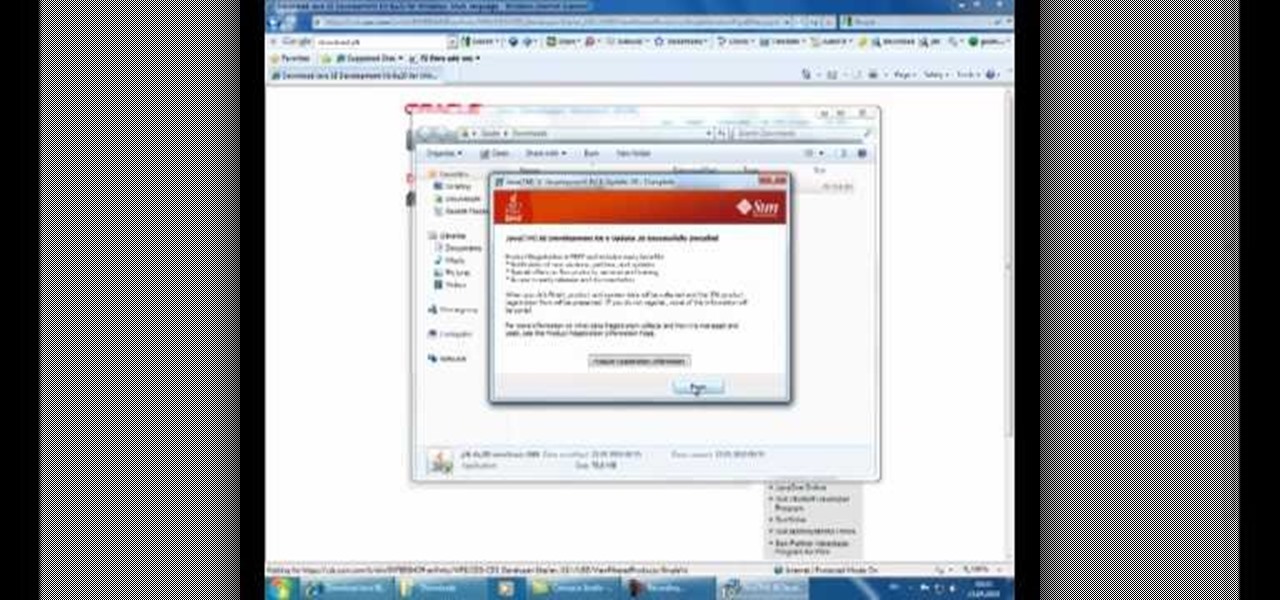
If you want to learn how to program in the Java language, then the first thing you're going to need to do is download and install the JDK. That stands for Java Development Kit, and is the basis for anyone begging in Java, and you need it to get the Javac (Java compiler) running. This video will show you what to do, and will show you how to set a new variable name and value in the Environment Variables under Advanced System Settings on your Windows PC.
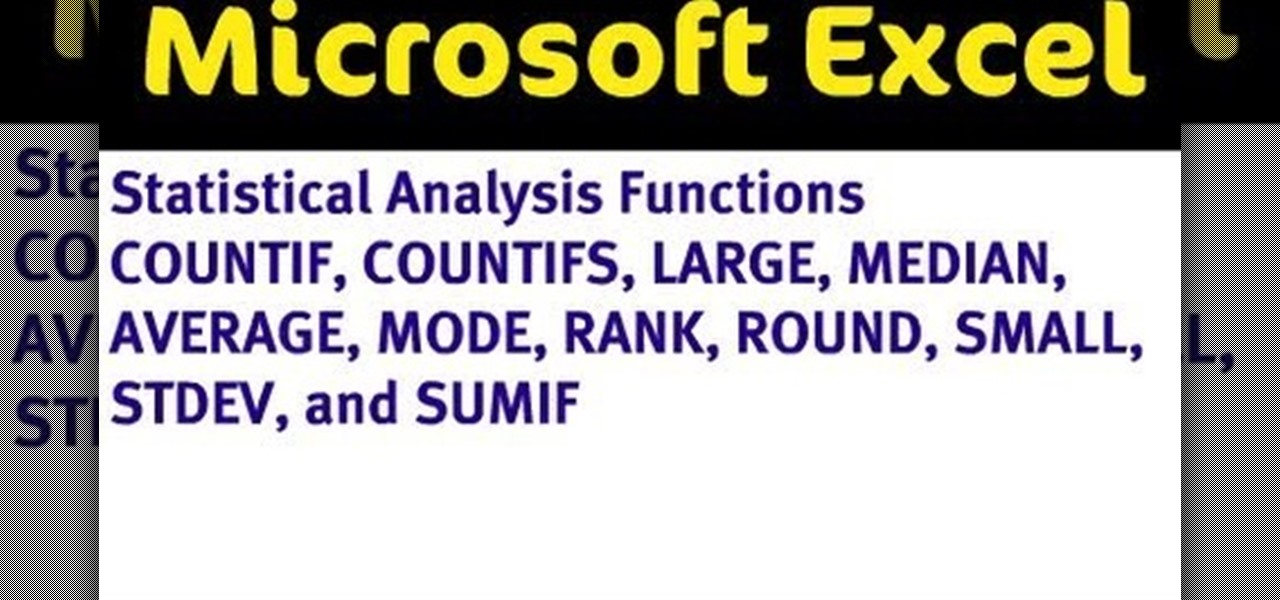
If you use Microsoft Office Excel on anything resembling a regular basis, odds are you work with numbers. Put those numbers to work with this free MS Excel video tutorial, which will teach you how to use a number of Excel's basic statistical functions (e.g., STDEV, AVERAGE, MEDIAN, MODE, RANK, ROUND, LARGE & SMALL).
If you use Microsoft Excel on a regular basis, odds are you work with numbers. Put those numbers to work. Statistical analysis allows you to find patterns, trends and probabilities within your data. In this MS Excel tutorial from everyone's favorite Excel guru, YouTube's ExcelsFun, the 44th installment in his "Excel Statistics" series of free video lessons, you'll learn how to use the SKEW function to calculate the skew in a distribution of data.
f you use Microsoft Excel on a regular basis, odds are you work with numbers. Put those numbers to work. Statistical analysis allows you to find patterns, trends and probabilities within your data. In this MS Excel tutorial from everyone's favorite Excel guru, YouTube's ExcelsFun, the 37th installment in his "Excel Statistics" series of free video lessons, you'll learn how to use the PERCENTILE and QUARTILE functions.
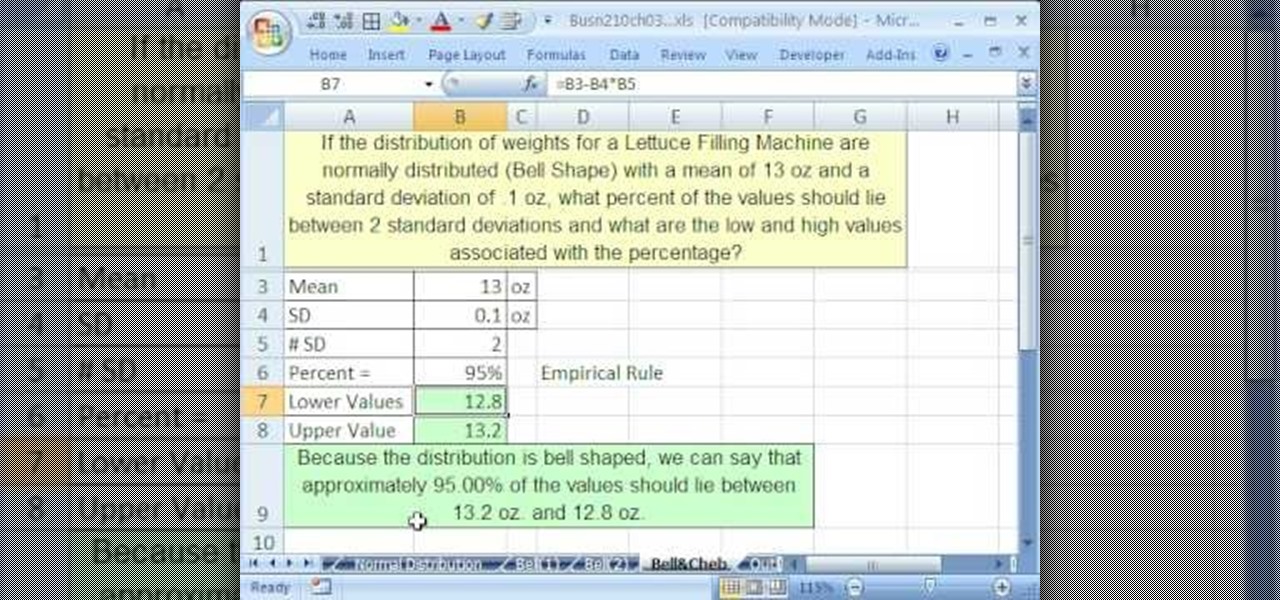
If you use Microsoft Excel on a regular basis, odds are you work with numbers. Put those numbers to work. Statistical analysis allows you to find patterns, trends and probabilities within your data. In this MS Excel tutorial from everyone's favorite Excel guru, YouTube's ExcelsFun, the 47th installment in his "Excel Statistics" series of free video lessons, you'll learn about the basics of the empirical rule (the bell curve) and how to apply it in various ways.
If you use Microsoft Excel on a regular basis, odds are you work with numbers. Put those numbers to work. Statistical analysis allows you to find patterns, trends and probabilities within your data. In this MS Excel tutorial from everyone's favorite Excel guru, YouTube's ExcelsFun, the 89th installment in his "Excel Statistics" series of free video lessons, you'll learn how to use the NORMSINV function for critical values and the NORSDIST function for p-values.
If you use Microsoft Excel on a regular basis, odds are you work with numbers. Put those numbers to work. Statistical analysis allows you to find patterns, trends and probabilities within your data. In this MS Excel tutorial from everyone's favorite Excel guru, YouTube's ExcelsFun, the 91st installment in his "Excel Statistics" series of free video lessons, you'll learn how to use TINV and TDIST functions to find critical values given an unknown sigma value.
If you use Microsoft Excel on a regular basis, odds are you work with numbers. Put those numbers to work. Statistical analysis allows you to find patterns, trends and probabilities within your data. In this MS Excel tutorial from everyone's favorite Excel guru, YouTube's ExcelsFun, the 80th installment in his "Excel Statistics" series of free video lessons, you'll learn how to construct confidence intervals when the sigma is known known using the CONFIDENCE and NORMSINV functions.
If you use Microsoft Excel on a regular basis, odds are you work with numbers. Put those numbers to work. Statistical analysis allows you to find patterns, trends and probabilities within your data. In this MS Excel tutorial from everyone's favorite Excel guru, YouTube's ExcelsFun, the 21st installment in his "Excel Statistics" series of free video lessons, you'll learn how to build labels and counting formulas for a frequency distribution.
If you use Microsoft Excel on a regular basis, odds are you work with numbers. Put those numbers to work. Statistical analysis allows you to find patterns, trends and probabilities within your data. In this MS Excel tutorial from everyone's favorite Excel guru, YouTube's ExcelsFun, the 87th installment in his "Excel Statistics" series of free video lessons, you'll learn how to use NORMSINV to test a hypothesis with population standard deviation (sigma) known and proportions.
If you use Microsoft Excel on a regular basis, odds are you work with numbers. Put those numbers to work. Statistical analysis allows you to find patterns, trends and probabilities within your data. In this MS Excel tutorial from everyone's favorite Excel guru, YouTube's ExcelsFun, the 28th installment in his "Excel Statistics" series of free video lessons, you'll learn how to create quantitative data stem & leaf charts using the REPT and COUNTIF functions.
If you use Microsoft Excel on a regular basis, odds are you work with numbers. Put those numbers to work. Statistical analysis allows you to find patterns, trends and probabilities within your data. In this MS Excel tutorial from everyone's favorite Excel guru, YouTube's ExcelsFun, the 13th installment in his "Excel Statistics" series of free video lessons, you'll learn how to create a column chart from a frequency distribution for categorical data.
If you use Microsoft Excel on a regular basis, odds are you work with numbers. Put those numbers to work. Statistical analysis allows you to find patterns, trends and probabilities within your data. In this MS Excel tutorial from everyone's favorite Excel guru, YouTube's ExcelsFun, the 5th installment in his "Excel Statistics" series of free video lessons, you'll learn how to use relative and absolute cell references to save time when writing formulas.
A good first project for anyone interested in doing woodworking projects on a regular or semi-regular basis is, naturally, a wooden workbench. This carpenter's guide will help you to build a solid work table without breaking the bank in the process. For more information, including a step-by-step breakdown of the assembly process, watch this free video tutorial.
The area of a rectangle is the basis for all geometry. You will need to know how to do this in order to better understand other objects. This video tutorial will show you the formula for area of a rectangle and how to use it. Don't be confused in math class anymore.
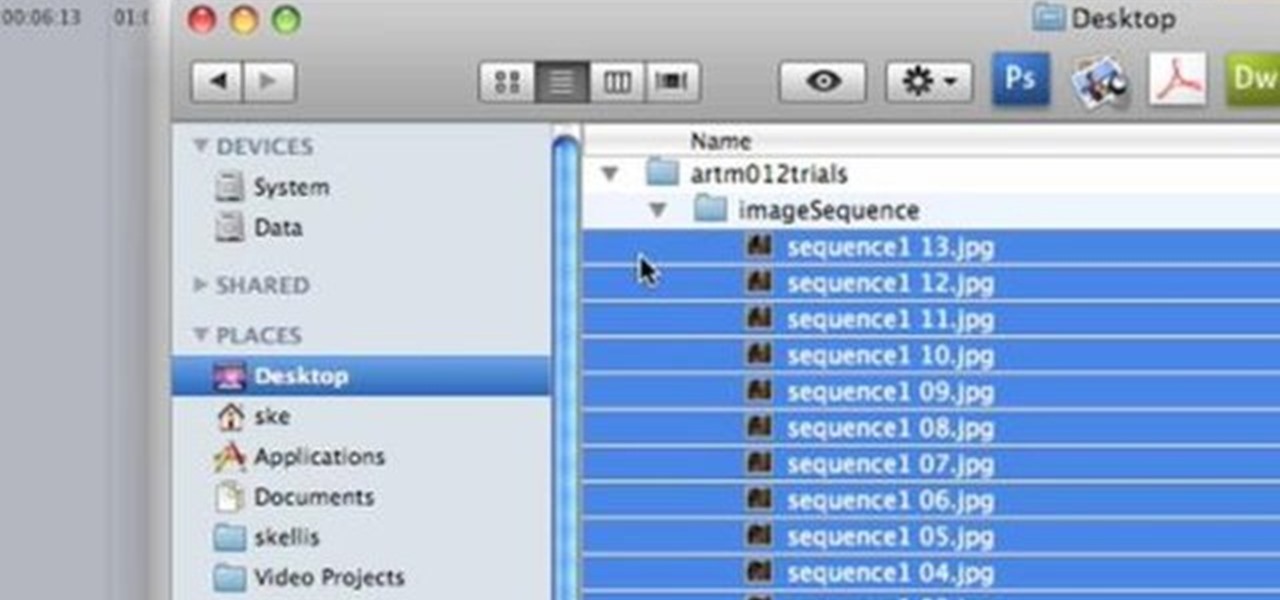
This video editing software tutorial shows you how to export an image sequence from Final Cut Pro. This isn't usually the format people export in, but if you are planning on using the frames for animating or further editing, you may want to export your work on a per frame basis. If this is the case, watch and learn how to export an image sequence from Final Cut Pro.
Learn how to turn classic lilies (or irises) into a kusudama. Use a cuboctahedron frame as a basis (12 lilies) and turn them into double lilies (another 12 are required).
The robes of the Jedi and Sith are great bases for all sorts of Star Wars costumes. If you have some DIY flair and want to make your own Star Wars costume for Halloween or cosplay watch this video to learn how to make your own Jedi or Sith robes, depending on your character.
Looking for a guide on how to resize fonts on a per-website basis? It's easy. So easy, in fact, that this video tutorial can present a complete, step-by-step overview of the process in just over six minutes. For more information, including detailed, step-by-step instructions, take a look.
Firecrackers are one of the greatest noisemaking implements ever conceived, and have formed the basis of great pranks for generations. This video will show you how to pull arguably the most classic firecracker prank of all, the firecracker wakeup call. All you do is put firecrackers in a pot (for safety) near a sleeping person and light 'em off. Hilarious, but dangerous. Be careful, for Pete's sake.
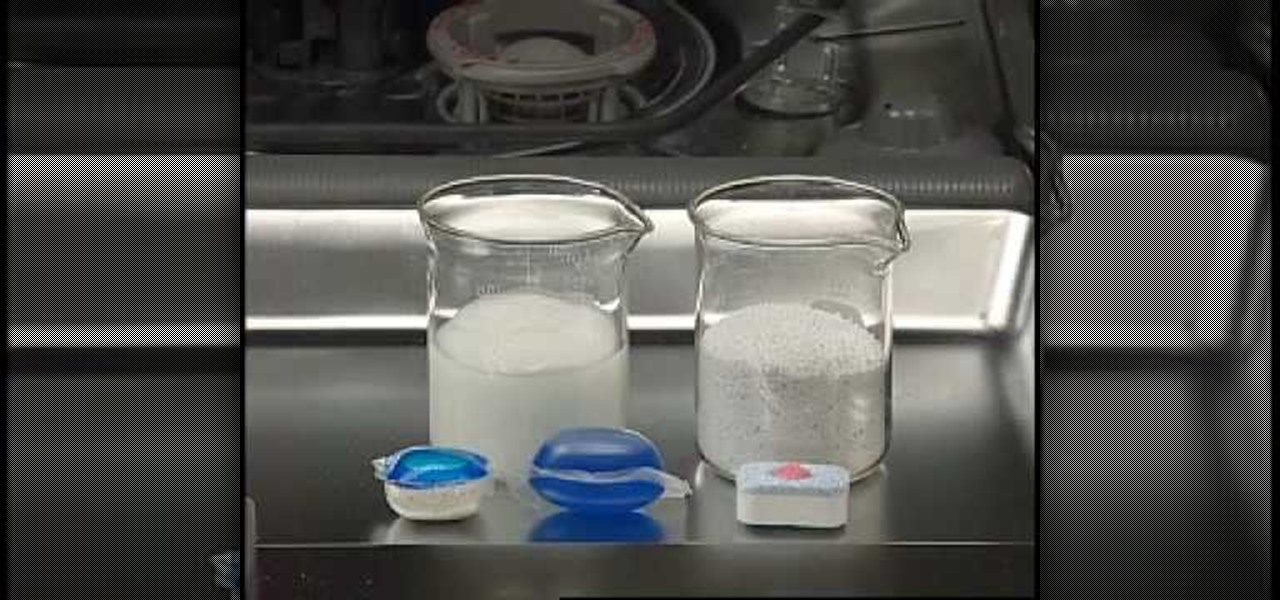
If you have hard water in your area, it can be rough on your dishwasher and sometimes your dishes. If you don't clean your machine on a regular basis, it loses the effectiveness of the machine.
For the budding magician, the card force is one of the most important techniques, forming the basis for many, many wonderful card tricks. In this tutorial youtube staple The Card Trick Master teaches us to perform an easy behind-the-back card force magic trick that is sure to wow your audiences.
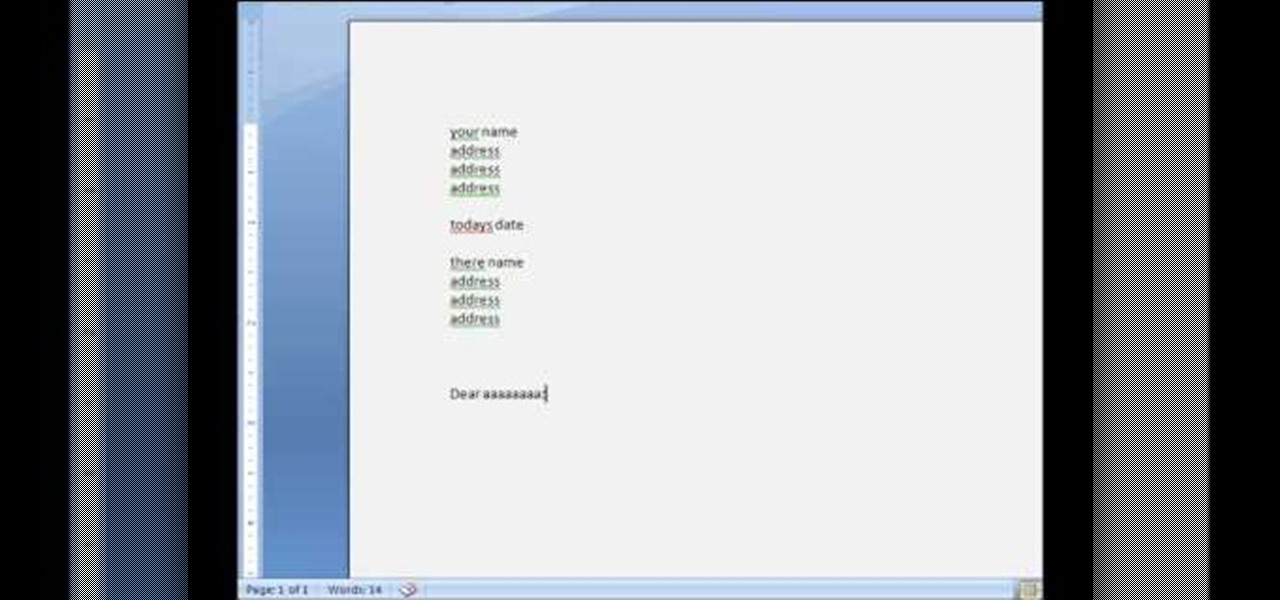
Type professional letters quickly and easily in Microsoft Word 2007
If you use Microsoft Excel on a regular basis, odds are you work with numbers. Put those numbers to work. Statistical analysis allows you to find patterns, trends and probabilities within your data. In this MS Excel tutorial from everyone's favorite Excel guru, YouTube's ExcelsFun, the 48th installment in his "Excel Statistics" series of free video lessons, you'll see comparison of Chebyshev's Theorem and the Empirical Rule (bell curve) and learn when to apply which.
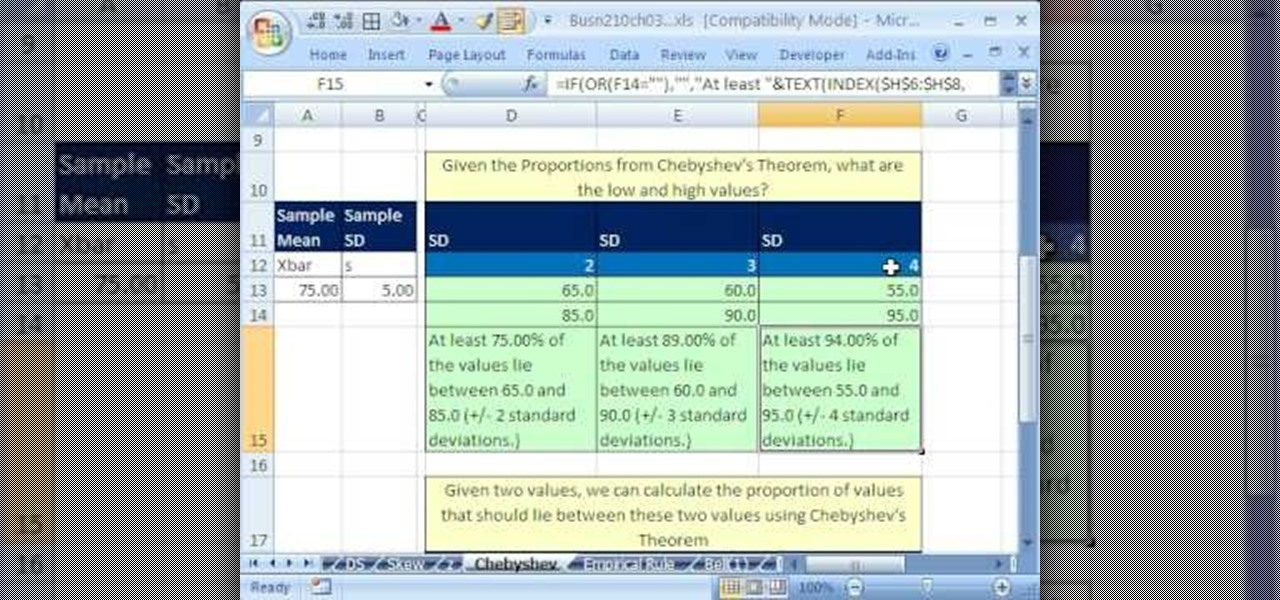
If you use Microsoft Excel on a regular basis, odds are you work with numbers. Put those numbers to work. Statistical analysis allows you to find patterns, trends and probabilities within your data. In this MS Excel tutorial from everyone's favorite Excel guru, YouTube's ExcelsFun, the 46th installment in his "Excel Statistics" series of free video lessons, you'll learn about Chebyshev's Theorem and how to apply it in three different ways.
If you use Microsoft Excel on a regular basis, odds are you work with numbers. Put those numbers to work. Statistical analysis allows you to find patterns, trends and probabilities within your data. In this MS Excel tutorial from everyone's favorite Excel guru, YouTube's ExcelsFun, the 43rd installment in his "Excel Statistics" series of free video lessons, you'll learn how to use the Excel Data Analysis add-in descriptive statistics tool.
If you use Microsoft Excel on a regular basis, odds are you work with numbers. Put those numbers to work. Statistical analysis allows you to find patterns, trends and probabilities within your data. In this MS Excel tutorial from everyone's favorite Excel guru, YouTube's ExcelsFun, the 42nd installment in his "Excel Statistics" series of free video lessons, you'll learn how to calculate the coefficient of variation.
If you use Microsoft Excel on a regular basis, odds are you work with numbers. Put those numbers to work. Statistical analysis allows you to find patterns, trends and probabilities within your data. In this MS Excel tutorial from everyone's favorite Excel guru, YouTube's ExcelsFun, the 30th installment in his "Excel Statistics" series of free video lessons, you'll learn how to create a scatter diagram for 2 quantitative variables.
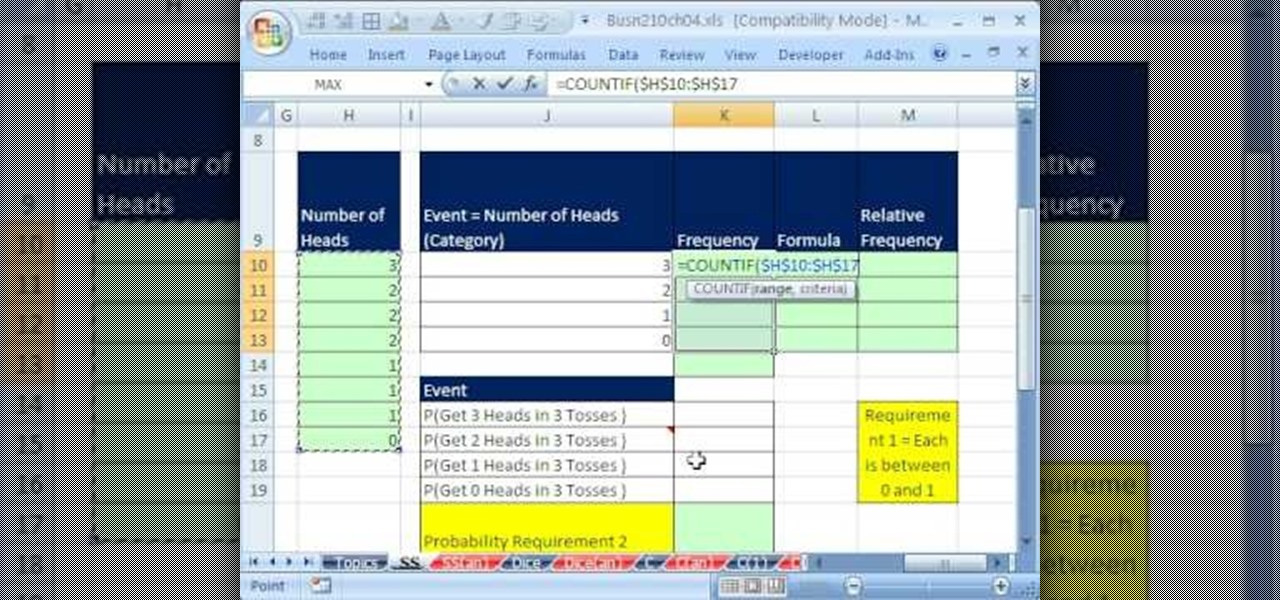
If you use Microsoft Excel on a regular basis, odds are you work with numbers. Put those numbers to work. Statistical analysis allows you to find patterns, trends and probabilities within your data. In this MS Excel tutorial from everyone's favorite Excel guru, YouTube's ExcelsFun, the 51st installment in his "Excel Statistics" series of free video lessons, you'll learn how to understand, work with and find simple probabilities in Microsoft Office Excel.
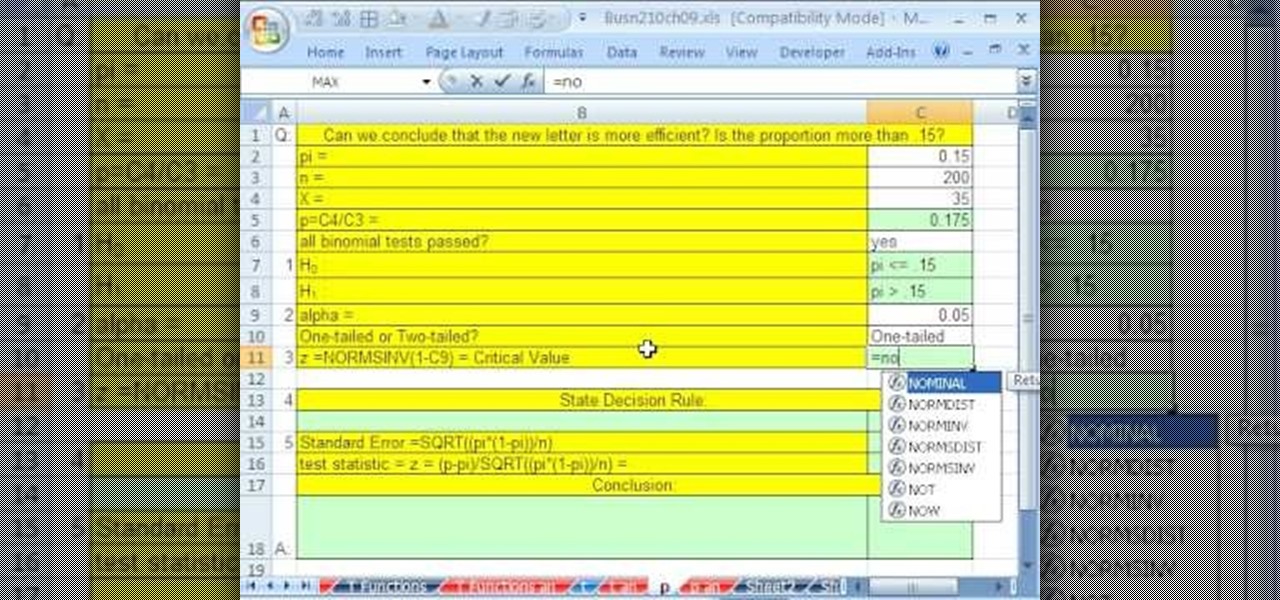
If you use Microsoft Excel on a regular basis, odds are you work with numbers. Put those numbers to work. Statistical analysis allows you to find patterns, trends and probabilities within your data. In this MS Excel tutorial from everyone's favorite Excel guru, YouTube's ExcelsFun, the 93rd installment in his "Excel Statistics" series of free video lessons, you'll learn how to use the NORMSINV and NORMSDIST functions to complete a hypothesis test about a population proportion.
If you use Microsoft Excel on a regular basis, odds are you work with numbers. Put those numbers to work. Statistical analysis allows you to find patterns, trends and probabilities within your data. In this MS Excel tutorial from everyone's favorite Excel guru, YouTube's ExcelsFun, the 83rd installment in his "Excel Statistics" series of free video lessons, you'll learn how to construct confidence intervals when the sigma (population standard deviation) in NOT known using the TINV function.