With Google's recent release of the Software Developers Kit for Chromecast, Android gurus now have a roadmap of sorts to guide them in adding Chromecast functionality to their apps. The results are beginning to pour in.

Sometimes, you just don't want to hit the Power button to turn your screen off. In the current age of touchscreens, you've got to wonder why we even have physical keys anymore.

With constant Twitter updates, grueling commutes home, and a neverending workday, it's no wonder more and more of us have anxiety and stress on a regular basis. While you may not be able to just call it quits for a week and hit Fiji for some scuba fun, you can relive stress temporarily with a massage.

If you're lucky enough to have manageable pin-straight hair then we envy you. Most girls deal with frizz and damaging styling products on a daily basis trying to get their hair to look like yours.

A really beautifully painted Warhammer miniature mounted on a stock base is like Christina Hendrix at the Emmy's, but with trash bags wrapped around her feet instead of shoes. It cheapens your work. This video will show you how to make really cool miniature bases out of cork board and a hot glue gun.

Major chords are like happy kids' movies, which have an upbeat beginning, middle, and end to satisfy innocent minds and sugarcoat harsher realities.

Working with both Macs and PCs covers all bases, but it also adds new problems. If you fall into this category, you probably work with file formats that are not incompatible with the other computers. One of these file types in XML files. This tutorial will show you how to open XML on your Mac.
If you use Microsoft Excel on a regular basis, odds are you work with numbers. Put those numbers to work. Statistical analysis allows you to find patterns, trends and probabilities within your data. In this MS Excel tutorial from everyone's favorite Excel guru, YouTube's ExcelsFun, the 45th installment in his "Excel Statistics" series of free video lessons, you'll learn how to see how to calculate a z-score.
If you use Microsoft Excel on a regular basis, odds are you work with numbers. Put those numbers to work. Statistical analysis allows you to find patterns, trends and probabilities within your data. In this MS Excel tutorial from everyone's favorite Excel guru, YouTube's ExcelsFun, the 35.2nd installment in his "Excel Statistics" series of free video lessons, you'll learn how to use Excel's GEOMEAN function to find geometric mean.
If you use Microsoft Excel on a regular basis, odds are you work with numbers. Put those numbers to work. Statistical analysis allows you to find patterns, trends and probabilities within your data. In this MS Excel tutorial from everyone's favorite Excel guru, YouTube's ExcelsFun, the 40th installment in his "Excel Statistics" series of free video lessons, you'll learn how to calculate range & interquartile range for variability using the MAX, MIN, QUARTILE functions.
If you use Microsoft Excel on a regular basis, odds are you work with numbers. Put those numbers to work. Statistical analysis allows you to find patterns, trends and probabilities within your data. In this MS Excel tutorial from everyone's favorite Excel guru, YouTube's ExcelsFun, the 86th installment in his "Excel Statistics" series of free video lessons, you'll learn how to construct confidence intervals for proportions using NORMSINV function and other formulas.
If you use Microsoft Excel on a regular basis, odds are you work with numbers. Put those numbers to work. Statistical analysis allows you to find patterns, trends and probabilities within your data. In this MS Excel tutorial from everyone's favorite Excel guru, YouTube's ExcelsFun, the 87th installment in his "Excel Statistics" series of free video lessons, you'll learn how to calculate sample size (n) for confidence intervals.
If you use Microsoft Excel on a regular basis, odds are you work with numbers. Put those numbers to work. Statistical analysis allows you to find patterns, trends and probabilities within your data. In this MS Excel tutorial from everyone's favorite Excel guru, YouTube's ExcelsFun, the 27th installment in his "Excel Statistics" series of free video lessons, you'll learn how to create a quantitative data dot plot chart using the REPT and COUNTIF functions.
If you use Microsoft Excel on a regular basis, odds are you work with numbers. Put those numbers to work. Statistical analysis allows you to find patterns, trends and probabilities within your data. In this MS Excel tutorial from everyone's favorite Excel guru, YouTube's ExcelsFun, the 26th installment in his "Excel Statistics" series of free video lessons, you'll learn how to create quantitative data cumulative frequency distributions with pivot tables.
If you use Microsoft Excel on a regular basis, odds are you work with numbers. Put those numbers to work. Statistical analysis allows you to find patterns, trends and probabilities within your data. In this MS Excel tutorial from everyone's favorite Excel guru, YouTube's ExcelsFun, the 16th installment in his "Excel Statistics" series of free video lessons, you'll learn how to cross tabulate & do percentage cross tabulation for categorical data using a pivot table (PivotTable).
If you use Microsoft Excel on a regular basis, odds are you work with numbers. Put those numbers to work. Statistical analysis allows you to find patterns, trends and probabilities within your data. In this MS Excel tutorial from everyone's favorite Excel guru, YouTube's ExcelsFun, the 19th installment in his "Excel Statistics" series of free video lessons, you'll learn how to group categories in a frequency distribution with a formula (2 COUNTIF) and the pivot table (PivotTable) grouping fea...
If you use Microsoft Excel on a regular basis, odds are you work with numbers. Put those numbers to work. Statistical analysis allows you to find patterns, trends and probabilities within your data. In this MS Excel tutorial from everyone's favorite Excel guru, YouTube's ExcelsFun, the 17th installment in his "Excel Statistics" series of free video lessons, you'll learn how to cross tabulate & do percentage cross tabulation for categorical data using formulas rather than pivot tables.
If you use Microsoft Excel on a regular basis, odds are you work with numbers. Put those numbers to work. Statistical analysis allows you to find patterns, trends and probabilities within your data. In this MS Excel tutorial from everyone's favorite Excel guru, YouTube's ExcelsFun, the 3rd installment in his "Excel Statistics" series of free video lessons, you'll learn how to use Excel's sorting and pivot tables (PivotTables) data analysis tools.
If you use Microsoft Excel on a regular basis, odds are you work with numbers. Put those numbers to work. Statistical analysis allows you to find patterns, trends and probabilities within your data. In this MS Excel tutorial from everyone's favorite Excel guru, YouTube's ExcelsFun, the 35th installment in his "Excel Statistics" series of free video lessons, you'll learn how to calculate weighted and geometric means and see how to use the GEOMEAN function.
If you use Microsoft Excel on a regular basis, odds are you work with numbers. Put those numbers to work. Statistical analysis allows you to find patterns, trends and probabilities within your data. In this MS Excel tutorial from everyone's favorite Excel guru, YouTube's ExcelsFun, the 33rd installment in his "Excel Statistics" series of free video lessons, you'll learn how to use the AVEARGE, MEDIAN, MODE, PERCENTILE, QUARTILE and PERCENTILERANK functions to measure location.
If you use Microsoft Excel on a regular basis, odds are you work with numbers. Put those numbers to work. Statistical analysis allows you to find patterns, trends and probabilities within your data. In this MS Excel tutorial from everyone's favorite Excel guru, YouTube's ExcelsFun, the 4th installment in his "Excel Statistics" series of free video lessons, you'll learn how to create a frequency table and percentage frequency table using a Pivot Table (PivotTable).
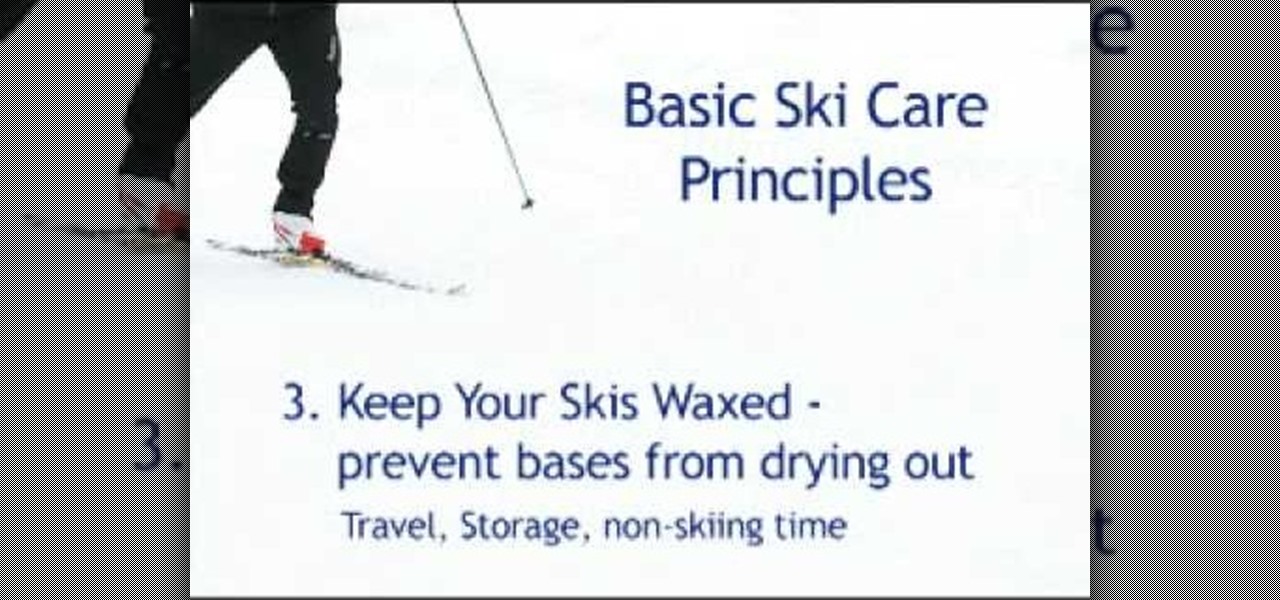
NordicSkiSource.com owner Doug McSpadden illustrates basic practices for caring for your XC skis. The more wax you have the faster your skis. Do not ski through dirt; it will ruin your bases. Keep skis waxed when travelling to keep them from drying out. Don't walk across a parking lot.
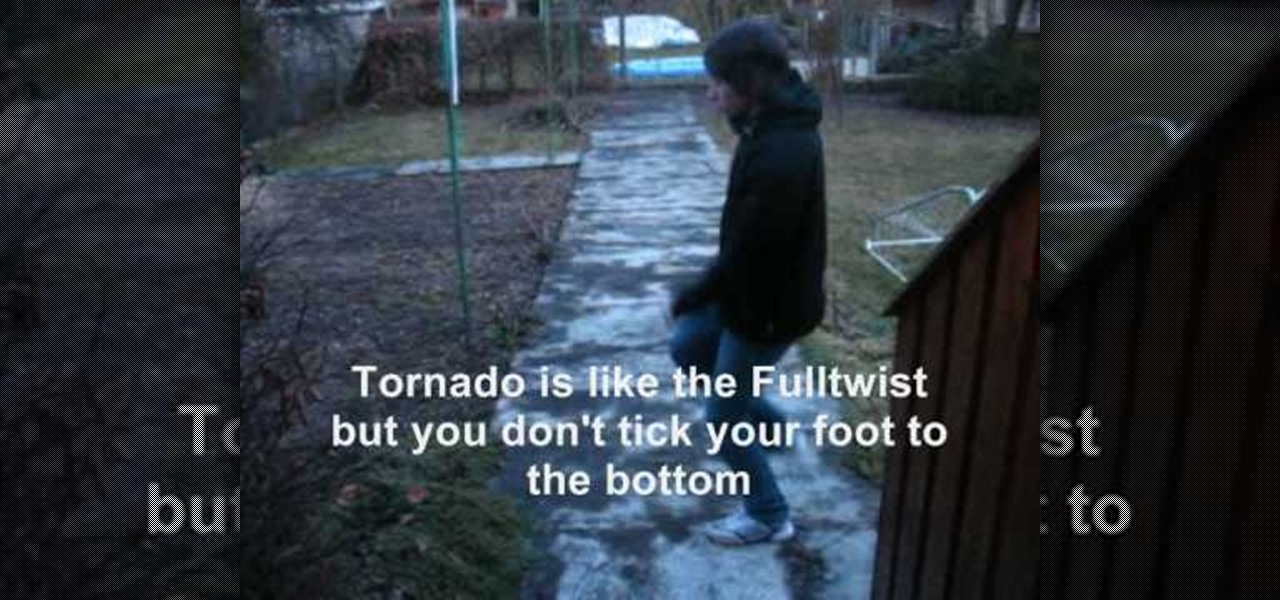
Jumpstyle is all the rage from Europe and can be danced to with hiphop or electronica.
Figure drawing is the basis of fine arts education, so watch this how to video on drawing the human neck. To draw the human neck, pay attention to the muscles and bones that represent its shape. Draw an anatomical human neck with tips from a professional illustrator in this free instructional video on drawing.
Lawrence Perez, from Saddleback College, and his assistant Charlie, give this intermediate-algebra two-part lesson on logarithmic applications, chemistry acids and bases. If you've never taken chemistry, well, you should probably go and take it first.
Studio one single window interface now eliminates multiple windows and complex menus enabling to focus on music in an easy way. The important music creation and production tools are instantly accessible. Studio one directly opens into the start page by default. Here we can find the recent files that enable to easily choose the ongoing productions. The default page also helps to open tutorials and demo songs. We can create songs on the song page using hot keys to access various panels. For exa...
Your kitchen is the heart of your home, and is as individual as you are. No matter what your ultimate goal, there are several initial steps you will take to begin remodeling your current kitchen, regardless of its size or shape.
The research team from Nvidia is returning to SIGGRAPH, an annual hotbed of innovation, with two new advancements in augmented reality displays.
In the realm of internet security, it's becoming clear that augmented reality is not immune to the increasing wave data breaches plaguing users.
A peek inside the code of the Snapchat app has revealed that the company is expanding the search capabilities of its augmented reality camera to include visual search that may link to items within Amazon's massive online store.
Although Magic Leap's founder Rony Abovitz has a lot to say about his product, what people really want are visuals, and it looks like we're about to get a lot more of those in the coming weeks. In a post on Magic Leap's official announcements forum page, the company revealed that it plans to begin a monthly livestream series on Twitch.
Flying under the radar during Magic Leap's big week at the Game Developers Conference, the company settled a potentially ugly lawsuit with a former employee.
It's an ongoing saga, and it's on the verge of ruining one of the most anticipated smartphone releases this year: LG's new POLED displays certainly seem to have a few issues. But the biggest issue of them all — an apparent susceptibility to screen burn-in — may not be the problem we thought it was.
The Force is strong with Lenovo, who is working with Disney and Lucasfilm to deliver an augmented reality headset and lightsaber handle for the forthcoming Star Wars: Jedi Challenges game.
In a recently released video, it was revealed that Formula-E's partner Roborace has developed a driverless race car that can complete laps at full racing speed.
Any truck driver who breathed a sigh of relief when US Secretary of Commerce Steve Mnuchin recently stated that driverless cars "will not affect jobs in a meaningful way for roughly 50 to 100 years" can go back to being anxious about job security again.
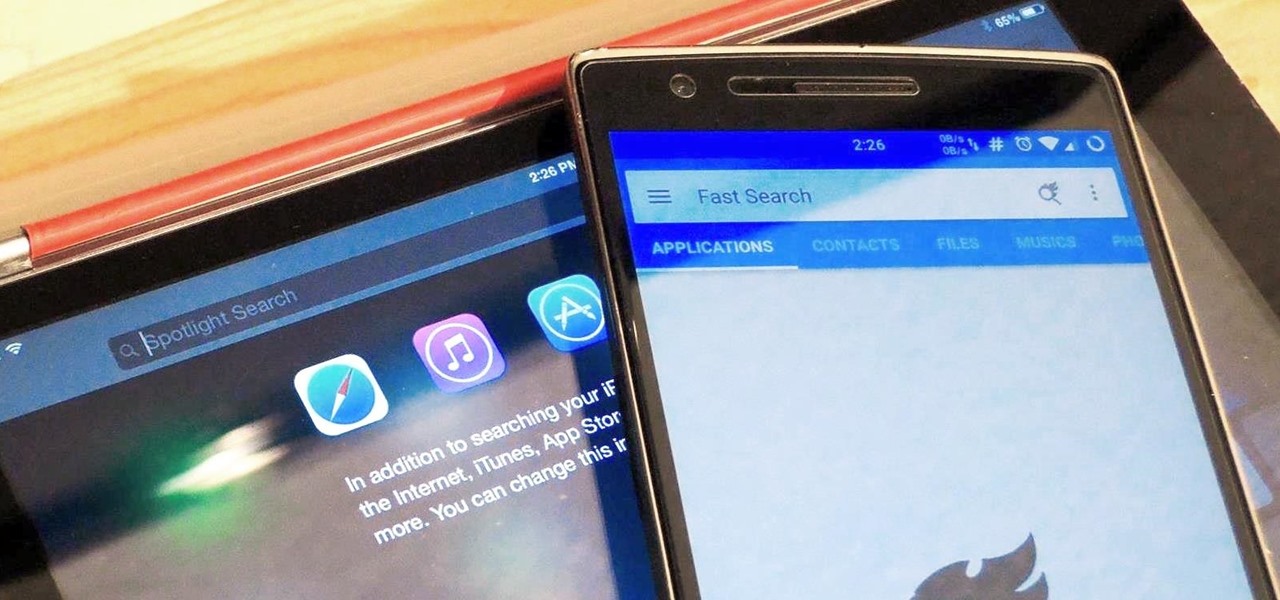
Google Now is great for looking up movie times or finding your parking spot, but if you need to track down a file you downloaded, you're relegated to using a file explorer and, depending on your organizational skills, this can either be extremely easy or a huge pain in the ass. Unfortunately I land in the latter category, which is why I started using Fast Search by developer Mohamad Amin.
When you think about it, YouTube may actually have one of the largest music collections on the planet. This is why, at $10 per month, Google's new YouTube Music Key subscription is a solid value for many users, especially with its inclusion of Google Play Music.
Android has a permission that allows apps to draw on top of other apps, but as fun as that may sound, it has mostly been used to create floating multitasking utilities. While these can certainly be useful, it would still be nice if this permission were taken literally and we could actually draw on top of apps.
Lending someone your phone to make a call is always an awkward situation, as you closely monitor them to make sure they stick to a phone call rather than wandering off into private applications like your photo or messaging apps. You don't necessarily want to eavesdrop on their conversation, but trusting people with your phone is difficult, especially if you have some risqué or embarrassing pictures stored on it.