Lawrence Perez, from Saddleback College, and his assistant Charlie, give this introduction to statistics lesson on using the Z tests for the mean. If you don't know about statistics, well, I don't know what to say.

Learn how to minimize the sum of squared error for regression line problems in stats. Whether you need help studying for that next big stats text or just a hand finishing your homework, you're sure to be well served by this four-part free video math lesson from Salman Khan.

Learn about the difference between z- and t-statistics with this video guide. From Ramanujan to calculus co-creator Gottfried Leibniz, many of the world's best and brightest mathematical minds have belonged to autodidacts. And, thanks to the Internet, it's easier than ever to follow in their footsteps. For all of the details, watch this installment from Internet pedagogical superstar Salman Khan's series of free math tutorials.
From Ramanujan to calculus co-creator Gottfried Leibniz, many of the world's best and brightest mathematical minds have belonged to autodidacts. And, thanks to the Internet, it's easier than ever to follow in their footsteps (or just study for that next big test). With this installment from Internet pedagogical superstar Salman Khan's series of free math tutorials, you'll learn how to calculate a confidence interval in basic statistics.
From Ramanujan to calculus co-creator Gottfried Leibniz, many of the world's best and brightest mathematical minds have belonged to autodidacts. And, thanks to the Internet, it's easier than ever to follow in their footsteps (or just study for that next big test). With this installment from Internet pedagogical superstar Salman Khan's series of free math tutorials, you'll learn how to find a 95% confidence interval in statistics.
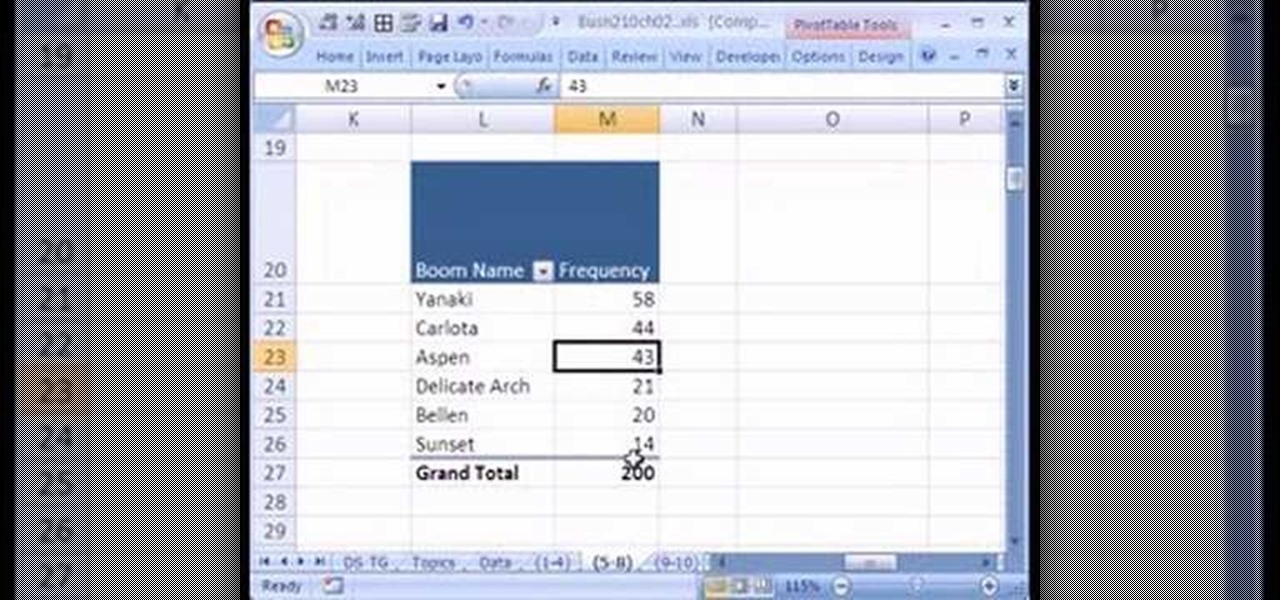
If you use Microsoft Excel on a regular basis, odds are you work with numbers. Put those numbers to work. Statistical analysis allows you to find patterns, trends and probabilities within your data. In this MS Excel tutorial from everyone's favorite Excel guru, YouTube's ExcelsFun, the 15th installment in his "Excel Statistics" series of free video lessons, you'll learn how to use create a frequency distribution, relative frequency distribution, percent frequency distribution and pie chart wi...

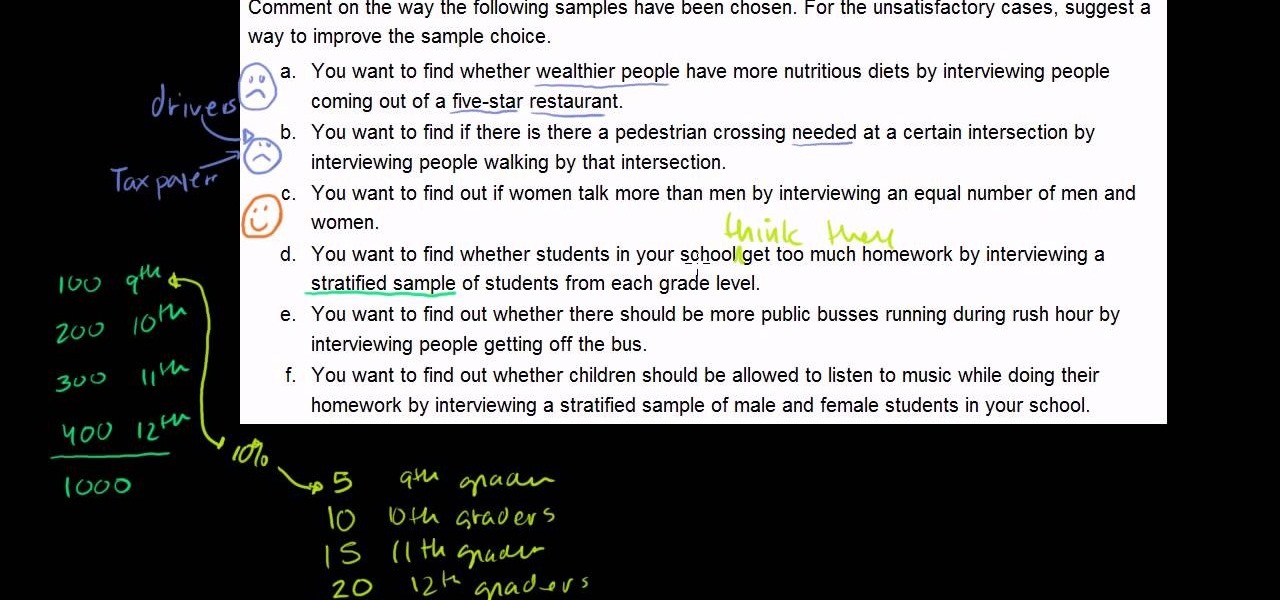
From Ramanujan to calculus co-creator Gottfried Leibniz, many of the world's best and brightest mathematical minds have belonged to autodidacts. And, thanks to the Internet, it's easier than ever to follow in their footsteps (or just finish your homework or study for that next big test). With this installment from Internet pedagogical superstar Salman Khan's series of free math tutorials, you'll learn how to work with surveys and samples in general statistics.
Need a little help in your Statistics class? In this statistics tutorial hosted by The Free Math Tutor, a demonstration of how to use the Sharp EL531W calculator to find the correlation coefficient (r-value) and the equation of a regression line is given. Want some more practice? For exercises and answer sheets, go here.
Learn how to solve statistics problems that require you to find the regression line. Whether you need help studying for that next big stats text or just a hand finishing your homework, you're sure to be well served by this four-part free video math lesson from Salman Khan.
Learn how to solve r-squared problems. Whether you need help studying for that next big stats text or just a hand finishing your homework, you're sure to be well served by this free video math lesson from Salman Khan, which presents a detailed overview of how to calculate r-squared in statistics.
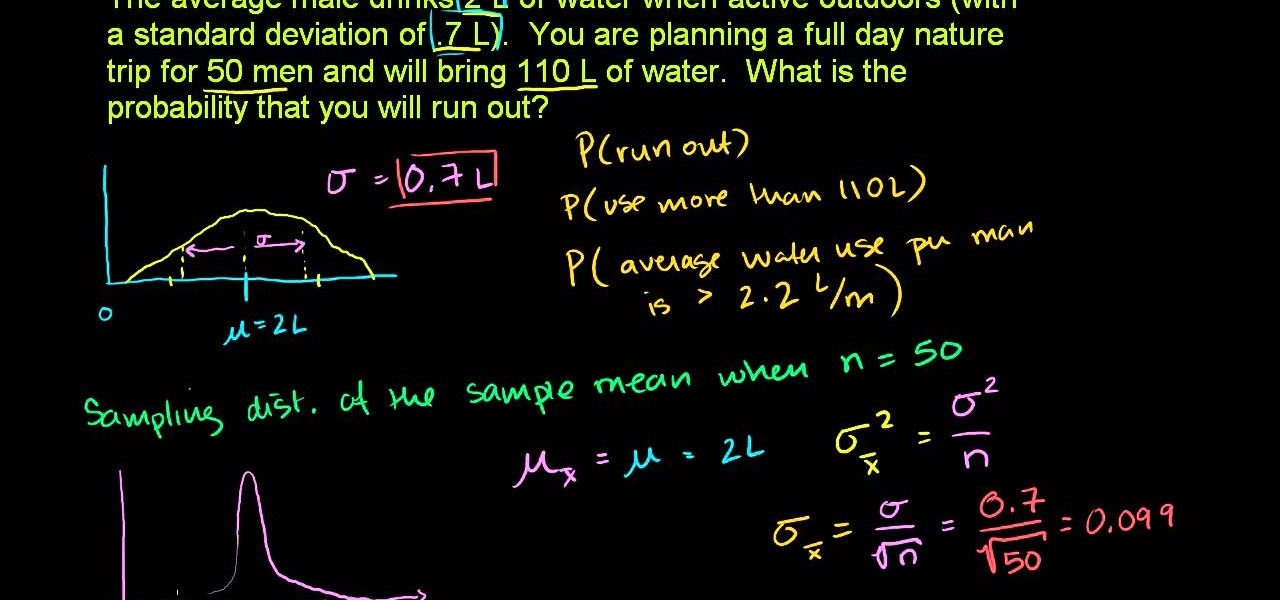
From Ramanujan to calculus co-creator Gottfried Leibniz, many of the world's best and brightest mathematical minds have belonged to autodidacts. And, thanks to the Internet, it's easier than ever to follow in their footsteps (or just study for that next big test). With this installment from Internet pedagogical superstar Salman Khan's series of free math tutorials, you'll learn how to calculate sample distribution in statistics.
If you use Microsoft Excel on a regular basis, odds are you work with numbers. Put those numbers to work. Statistical analysis allows you to find patterns, trends and probabilities within your data. In this MS Excel tutorial from everyone's favorite Excel guru, YouTube's ExcelsFun, the 43rd installment in his "Excel Statistics" series of free video lessons, you'll learn how to use the Excel Data Analysis add-in descriptive statistics tool.
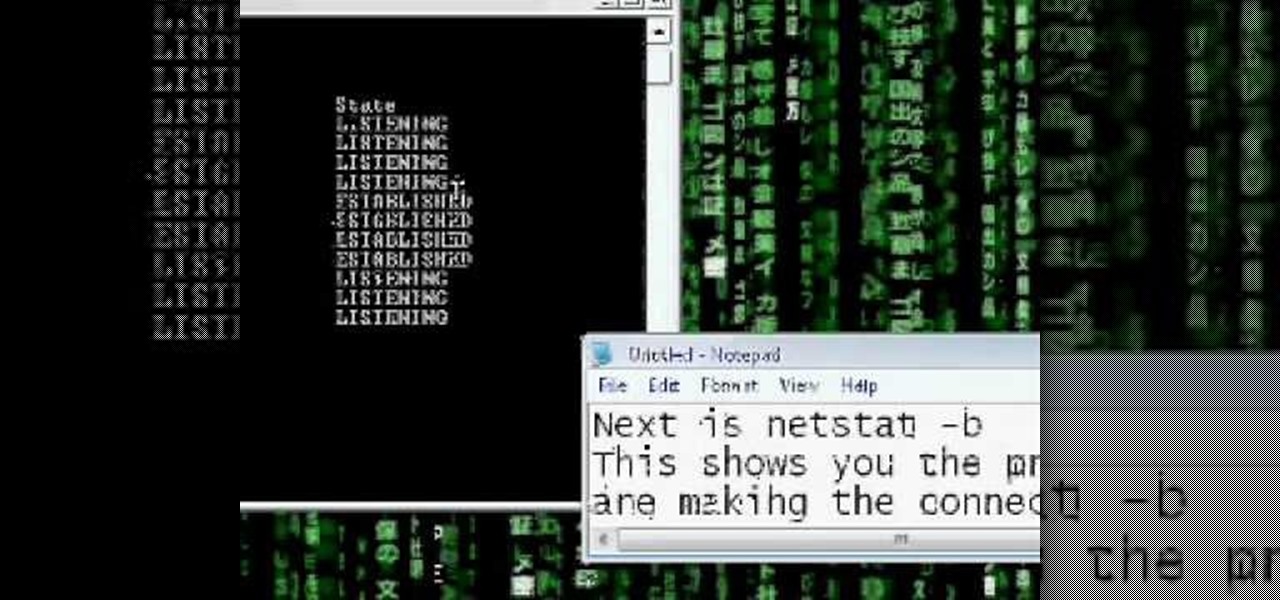
Netstat (network statistics) is a command-line tool that displays network connections (both incoming and outgoing), routing tables, and a number of network interface statistics. It is available on Unix, Unix-like, and Windows NT-based operating systems. This video tutorial presents a basic introduction to working with the netstat tool. Determine whether you've been hacked with this how-to.
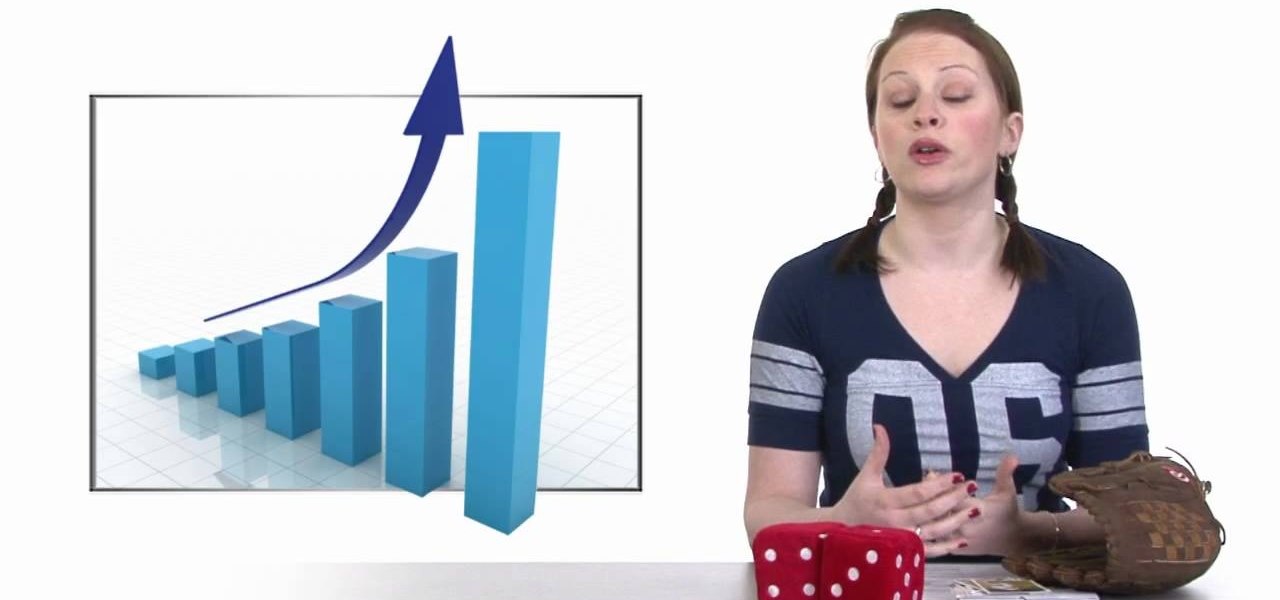
In this video, we learn how to improve your resume with valid statistics. You need solid numbers to back up the information you are writing on your resume, not just words written on the paper. Most applicants look qualified on paper, but don't land interviews because they don't offer proof to validate their claims. When you provide proof of what you are stating, the person who is viewing your resume will be more likely to call you for an interview. Make sure to provide supporting documents an...
Want to see whether your PC is being accessed by hackers? Netstat (network statistics) is a command-line tool that displays network connections (both incoming and outgoing), routing tables, and a number of network interface statistics. It is available on Unix, Unix-like, and Windows NT-based operating systems. This video tutorial presents a basic introduction to working with the netstat tool. Determine whether you've been hacked with this how-to.
Need to secure your track to the road bed for your model railroad? Well, this video tutorial will show you how to do it, not to mention show you how to weather your flex track.
Are your hobbies building model trains? Well, I hope you are building your own model sets the way you want to, but if you're stumped in the model railroading process, check out this nine-part video tutorial to see how to model railroad scenery using extruded foam. If you aren't into miniature rail transport systems, you will be now. Your landscape has to look good for your trains, doesn't it?
In this tutorial, we learn how to use the Quintile Formula in Statistics. To find the quintile rank of a formula that is in a certain set, you will first need to count the number you are given. Then, read the equation so you understand what the R, N, equal side, and other numbers mean. Once you understand what all of these mean, fill in the formula with the correct information. Use the information you are given in the question to fill it into the equation. When finished, you will apply the ru...
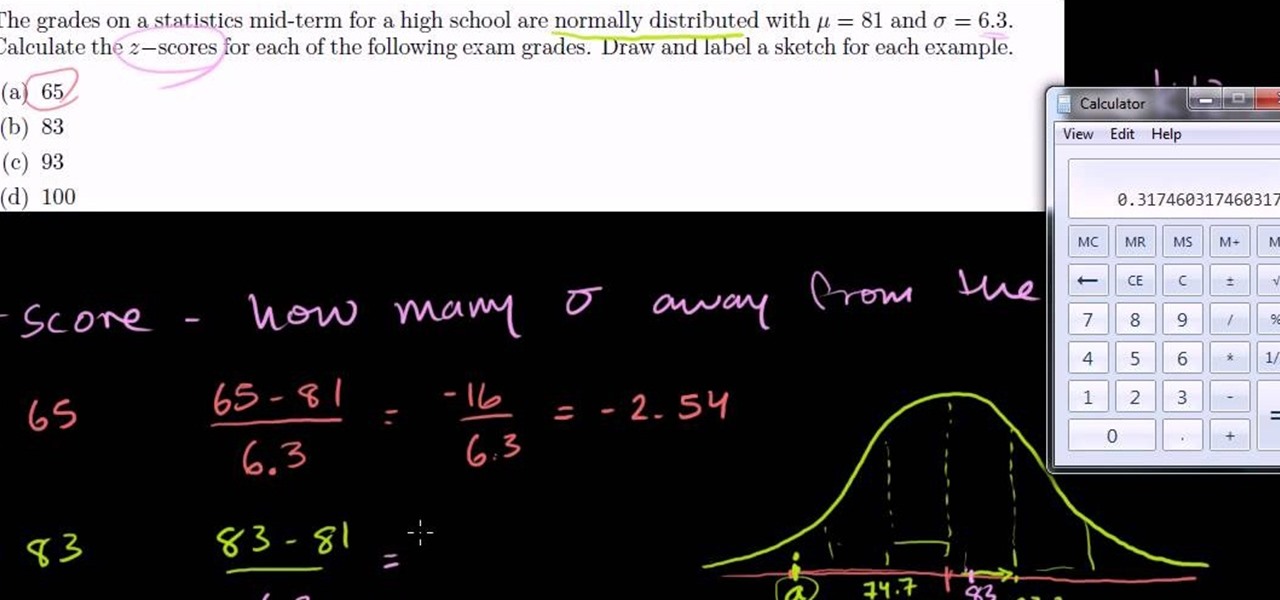
Need help figuring out how to determine a z-score for a normal distribution (or bell curve) in statistics? From Ramanujan to calculus co-creator Gottfried Leibniz, many of the world's best and brightest mathematical minds have belonged to autodidacts. And, thanks to the Internet, it's easier than ever to follow in their footsteps (or just finish your homework or study for that next big test). With this installment from Internet pedagogical superstar Salman Khan's series of free math tutorials...
If you use Microsoft Excel on a regular basis, odds are you work with numbers. Put those numbers to work. Statistical analysis allows you to find patterns, trends and probabilities within your data. In this MS Excel tutorial from everyone's favorite Excel guru, YouTube's ExcelsFun, the very first installment in his "Excel Statistics" series of free video lessons, you'll learn how to get started doing statistical analysis in Microsoft Excel 2007.
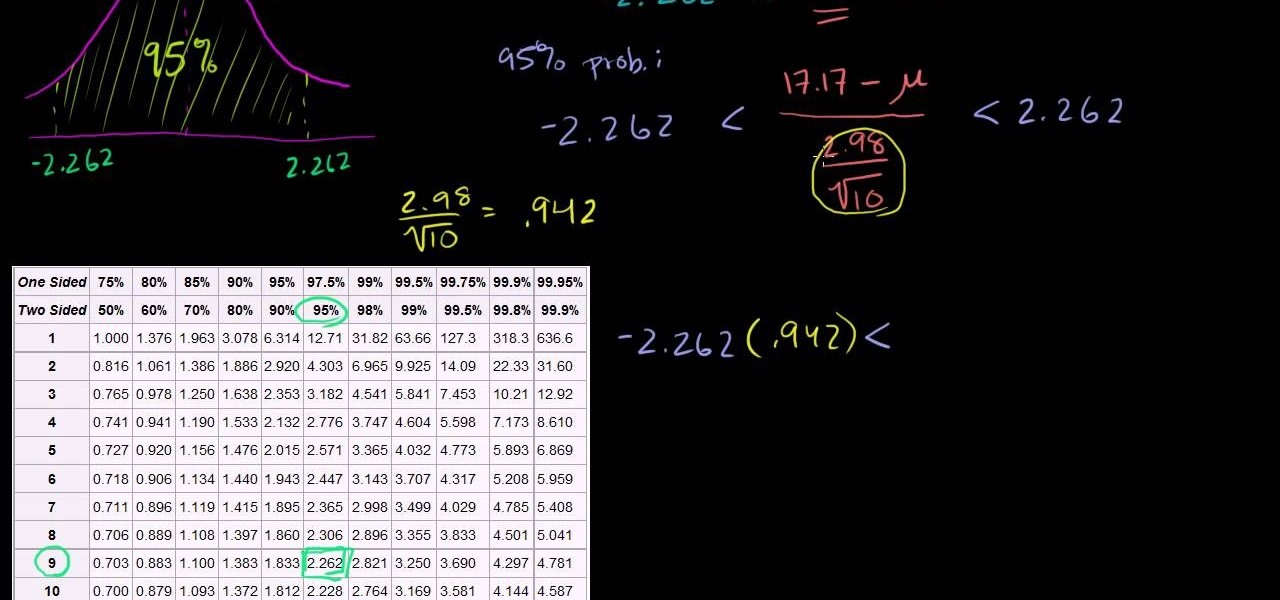
Want to find the value of a t-statistic confidence interval for a small sample? This clip's your ticket. From Ramanujan to calculus co-creator Gottfried Leibniz, many of the world's best and brightest mathematical minds have belonged to autodidacts. And, thanks to the Internet, it's easier than ever to follow in their footsteps. For all of the details, watch this installment from Internet pedagogical superstar Salman Khan's series of free math tutorials.
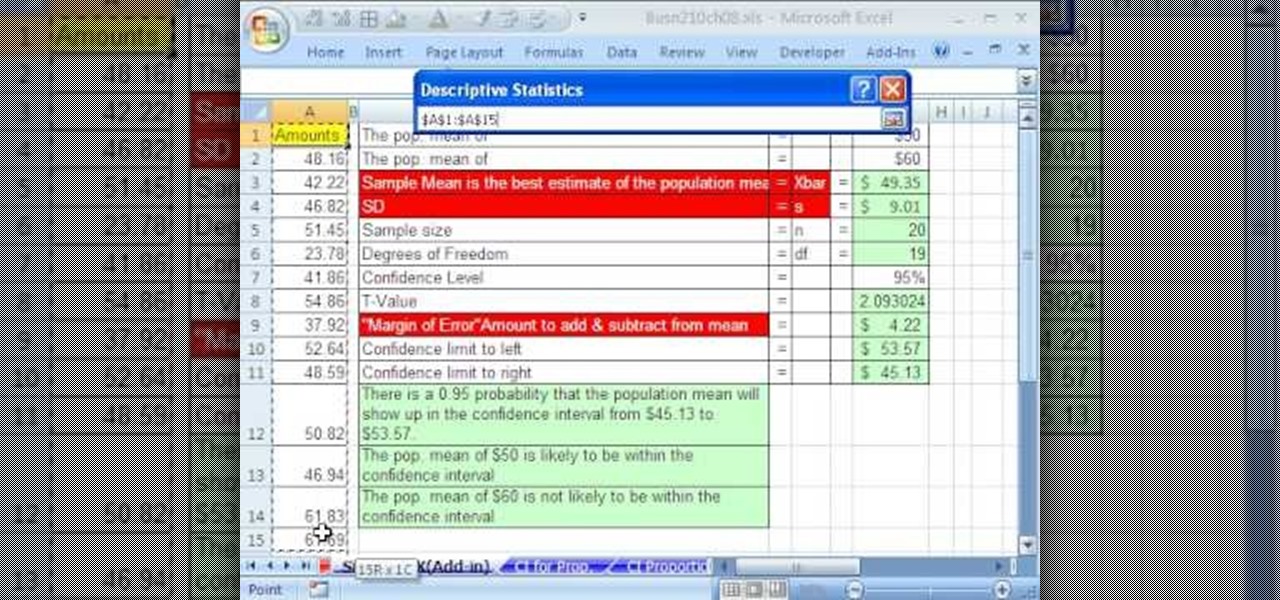
If you use Microsoft Excel on a regular basis, odds are you work with numbers. Put those numbers to work. Statistical analysis allows you to find patterns, trends and probabilities within your data. In this MS Excel tutorial from everyone's favorite Excel guru, YouTube's ExcelsFun, the 84th installment in his "Excel Statistics" series of free video lessons, you'll learn how to construct confidence intervals when the sigma is NOT known using the Descriptive Statistics data analysis add-in.
This video shows you how to change your skill levels in mount and blade. Go to the character menu and click on the statistics button, then click the export button. Exit Mount and Blade. Go to My computer, your local disk drive (usually C), program files, mount & blade, CharExport. In CharExport you should see a file with your character's name, open the file and you will see every stat that your character has. Change them however you want, save the file and close it. Restart Mount and Blade, l...
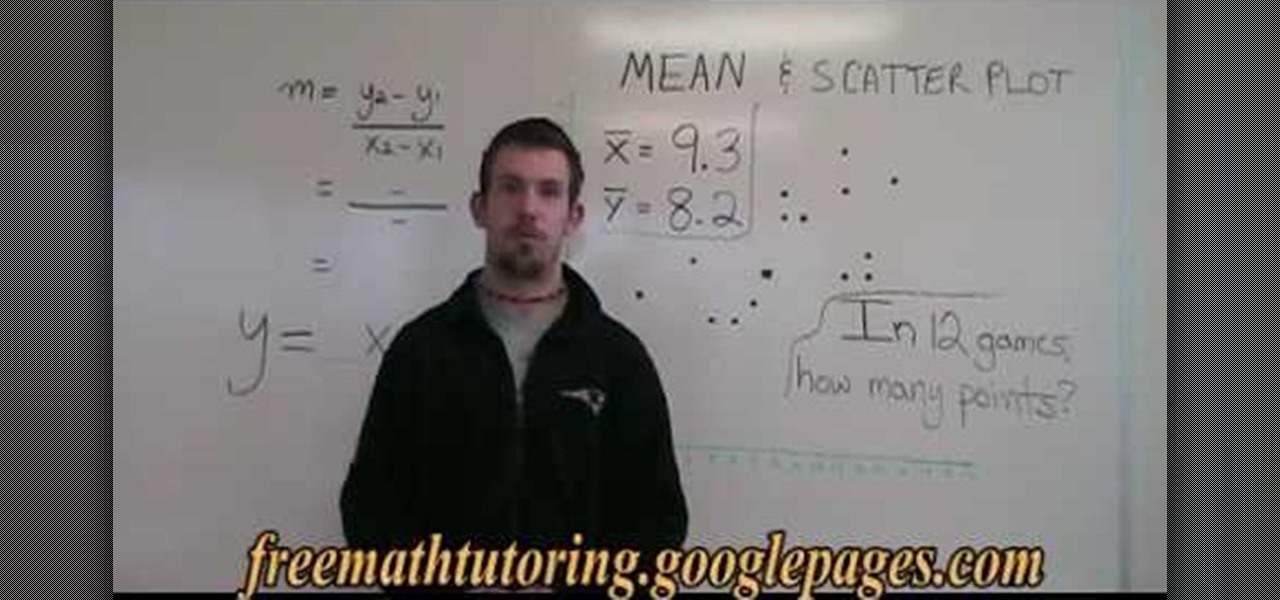
Wondering how to use a mean and scatter plot for statistics? Just follow the few simple steps as below.
Need a new hobby? How about railroad modeling? You can turn a full sized train and rail transport into a scaled model for you to enjoy. Model railroading is a hobby that requires attention to detail, so no slackers here, please.
Companies are already clamoring to figure out strategies for integrating augmented reality into their advertising platforms. AR is going to become a huge asset to marketers, and Apple's ARKit is only going to help that along. Mixed reality producer Bilawal Singh Sidhu has given us a sneak peek of what the world of advertising could be with the ARKit.
One of my favorite new additions to iOS is the ability to view battery usage stats on a per-app basis, which is helpful in knowing exactly which apps are taking up all of my iPhone's battery life. If you jailbreak iOS 8 on your device, you can take Apple's stock battery stats feature even further to give you details on how those apps are actually using the battery.
We knew it was coming, it was just a matter of when. Apple has just announced iOS 11.3, a new update for iPad, iPhone, and iPod touch, and it will include a brand-new set of Animoji for the iPhone X.
If you're at the point where you need to start ballasting your model railroad track, then you might want to check out this video tutorial on wiring. Learn how to wire your model railroad track.
In this clip, you'll learn how to view graphs of statistical data from around the world with Gapminder.com. The website, you'll find, is diverting, often thought-provoking, and easy to use. For more information, including detailed instructions on how to use the site yourself, watch this video tutorial from the folks at Tekzilla.
If you use Microsoft Excel on a regular basis, odds are you work with numbers. Put those numbers to work. Statistical analysis allows you to find patterns, trends and probabilities within your data. In this MS Excel tutorial from everyone's favorite Excel guru, YouTube's ExcelsFun, the 45th installment in his "Excel Statistics" series of free video lessons, you'll learn how to see how to calculate a z-score.
If you use Microsoft Excel on a regular basis, odds are you work with numbers. Put those numbers to work. Statistical analysis allows you to find patterns, trends and probabilities within your data. In this MS Excel tutorial from everyone's favorite Excel guru, YouTube's ExcelsFun, the 35.2nd installment in his "Excel Statistics" series of free video lessons, you'll learn how to use Excel's GEOMEAN function to find geometric mean.
If you use Microsoft Excel on a regular basis, odds are you work with numbers. Put those numbers to work. Statistical analysis allows you to find patterns, trends and probabilities within your data. In this MS Excel tutorial from everyone's favorite Excel guru, YouTube's ExcelsFun, the 40th installment in his "Excel Statistics" series of free video lessons, you'll learn how to calculate range & interquartile range for variability using the MAX, MIN, QUARTILE functions.
If you use Microsoft Excel on a regular basis, odds are you work with numbers. Put those numbers to work. Statistical analysis allows you to find patterns, trends and probabilities within your data. In this MS Excel tutorial from everyone's favorite Excel guru, YouTube's ExcelsFun, the 86th installment in his "Excel Statistics" series of free video lessons, you'll learn how to construct confidence intervals for proportions using NORMSINV function and other formulas.
If you use Microsoft Excel on a regular basis, odds are you work with numbers. Put those numbers to work. Statistical analysis allows you to find patterns, trends and probabilities within your data. In this MS Excel tutorial from everyone's favorite Excel guru, YouTube's ExcelsFun, the 87th installment in his "Excel Statistics" series of free video lessons, you'll learn how to calculate sample size (n) for confidence intervals.
If you use Microsoft Excel on a regular basis, odds are you work with numbers. Put those numbers to work. Statistical analysis allows you to find patterns, trends and probabilities within your data. In this MS Excel tutorial from everyone's favorite Excel guru, YouTube's ExcelsFun, the 27th installment in his "Excel Statistics" series of free video lessons, you'll learn how to create a quantitative data dot plot chart using the REPT and COUNTIF functions.
If you use Microsoft Excel on a regular basis, odds are you work with numbers. Put those numbers to work. Statistical analysis allows you to find patterns, trends and probabilities within your data. In this MS Excel tutorial from everyone's favorite Excel guru, YouTube's ExcelsFun, the 26th installment in his "Excel Statistics" series of free video lessons, you'll learn how to create quantitative data cumulative frequency distributions with pivot tables.
If you use Microsoft Excel on a regular basis, odds are you work with numbers. Put those numbers to work. Statistical analysis allows you to find patterns, trends and probabilities within your data. In this MS Excel tutorial from everyone's favorite Excel guru, YouTube's ExcelsFun, the 16th installment in his "Excel Statistics" series of free video lessons, you'll learn how to cross tabulate & do percentage cross tabulation for categorical data using a pivot table (PivotTable).
If you use Microsoft Excel on a regular basis, odds are you work with numbers. Put those numbers to work. Statistical analysis allows you to find patterns, trends and probabilities within your data. In this MS Excel tutorial from everyone's favorite Excel guru, YouTube's ExcelsFun, the 19th installment in his "Excel Statistics" series of free video lessons, you'll learn how to group categories in a frequency distribution with a formula (2 COUNTIF) and the pivot table (PivotTable) grouping fea...
If you use Microsoft Excel on a regular basis, odds are you work with numbers. Put those numbers to work. Statistical analysis allows you to find patterns, trends and probabilities within your data. In this MS Excel tutorial from everyone's favorite Excel guru, YouTube's ExcelsFun, the 17th installment in his "Excel Statistics" series of free video lessons, you'll learn how to cross tabulate & do percentage cross tabulation for categorical data using formulas rather than pivot tables.