Tapping can help to free you from persistent or inappropriate negative emotions. Sometimes these emotions make sense. If someone close to you dies, or a relationship ends, you're going to feel sad. But sometimes we feel depressed for no good reason, or very angry with someone who hasn't really done anything to deserve it. You're the only judge of whether or not an emotion is appropriate or inappropriate.

Have you ever found something funny in an awkward situation? When you feel a laugh coming, it can sometimes be hard to avoid. Check out these steps to stop your laugh before it gets you in trouble.
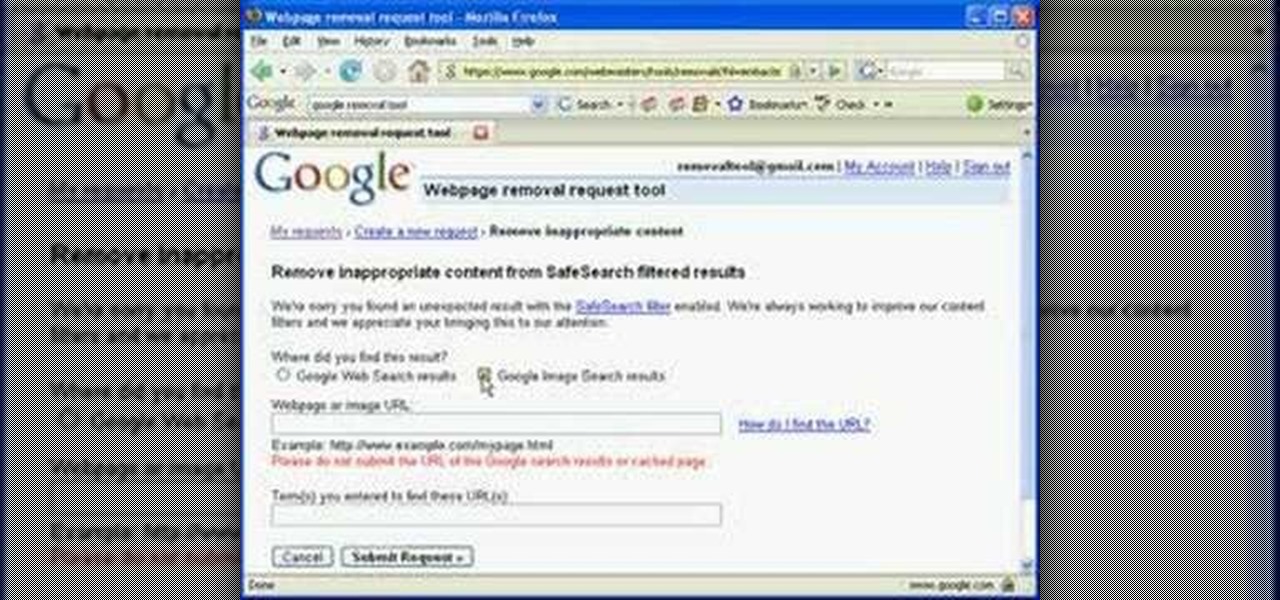
Nowadays, the internet has become a dangerous and disgusting place to hang around. This can especially be true when it comes to thinking about children. Using search engines like Google, can be a good thing, but also a bad one. Putting the wrong words together can result in dirty images or webpages. So in this tutorial, you'll find out how to remove an inappropriate webpage or image from Google. You'll be happy you did and so will your little one. Enjoy!

Linda Matias, President of Career Strides, has written a booklet entitled “How to Say It”, to help people answer tough questions during a job interview.

Learn how to enable restrictions on the Apple iPad to prevent your kids from seeing or hearing inappropriate content. For more information, including a detailed demonstration and complete step-by-step instructions, and to get started childproofing your own iPad, watch this handy iPad users' guide from the folks at CNET.

Instagram recently released their new Instagram Direct messaging feature in their Android and iOS apps, which lets users share private photos and videos directly with individuals or groups of up to 15 users. However, there are no restrictions on who you can send private photos or videos to.

Get a crash course on HScript Expressions, Variables, and Attributes in Houdini 10. If you don't even know what this means, then you probably need to check this video tutorial series out. Understanding how to massage data in Houdini is key to giving yourself the creative edge and allowing you to unleash mind-blowing visual effects. This 18-part video series covers a variety of simple yet essential weapons in your arsenal including Global, Standard and Custom Variables to Math and String Modif...
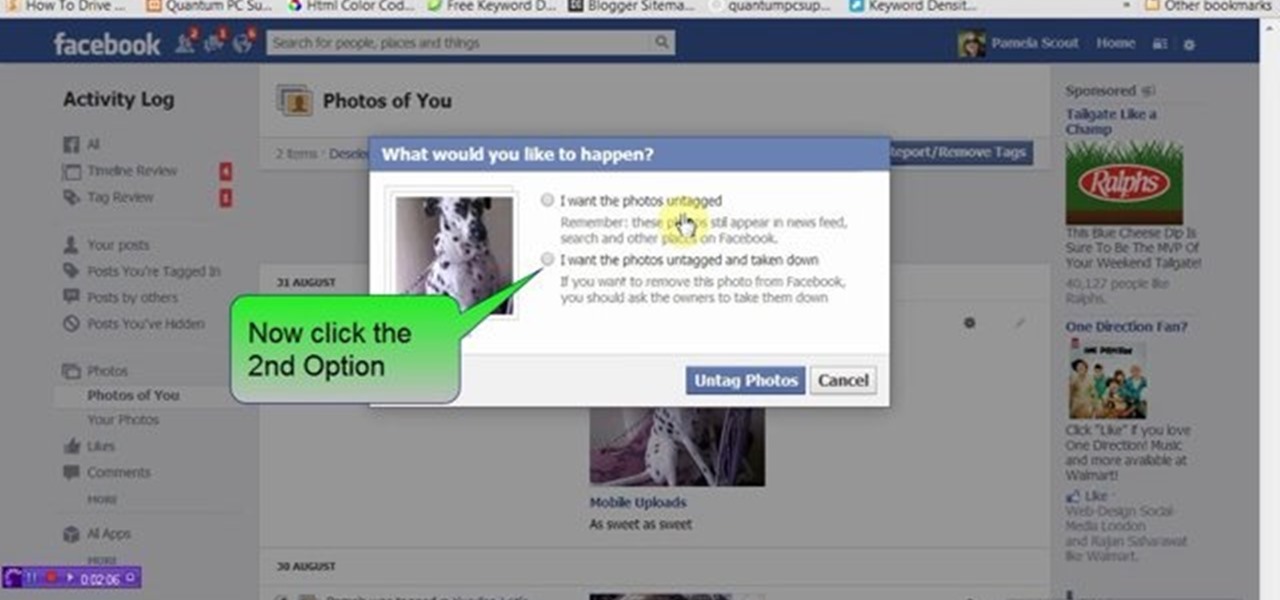
This video will provide an idea how to untag yourself from unrelated or inappropriate images in Facebook. From this video you will learn to untag yourself from multiple images at once.
Your English teacher is a creep. The way he looks at your girlfriend, the way he always spends ages with the girls in the class going over their work but not the boys, just the way he is.
Core Data is a powerful data-management framework introduced with Mac OS X v10.4 Tiger. When you take advantage of Core Data, it slashes the amount of custom code you need to write in order to manage application data. Opening, saving and undo management can all be handled by Core Data, freeing you to concentrate on creating unique features for your application. This video tutorial, which presents a general introduction to using Core Data, will walk you through the process of building a simple...
This five-part series on C# programming covers many things. First, you learn how to save to the Microsoft SQL Server. Then, you'll learn how to retrieve that data. You'll also learn how to navigate the DataSet, edit SQL data, and delete data. If you have Microsoft Visual Studio and SQL Server, give this lesson a try.
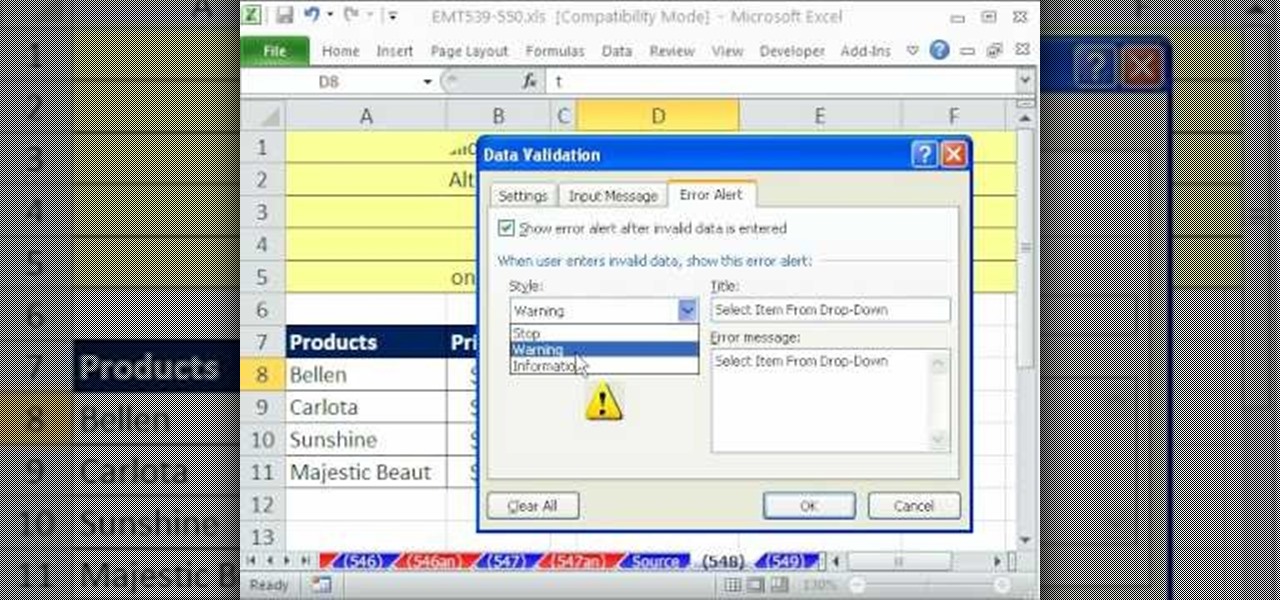
In this video tutorial, viewers learn how to create drop down menus in Microsoft Excel. This task is very easy, fast and easy to do. Begin by highlighting a desired cell. Then click on the Data tab and click on Data Validation under Data Tools. When the Data Validates window opens, click on the Error tab and deselect "Show error alert after invalid data is entered". Then click on OK. Now simply type in the data into the selected cell. This video will benefit those viewers who use Microsoft Ex...
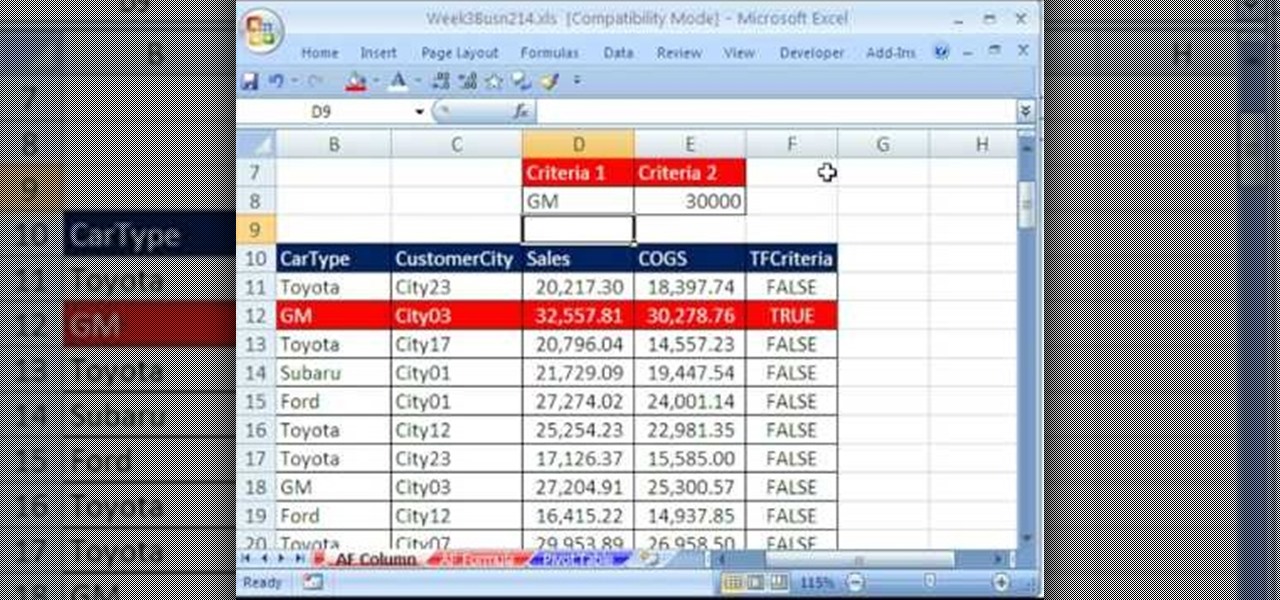
Whether you're interested in learning Microsoft Excel from the bottom up or just looking to pick up a few tips and tricks, you're in the right place. In this tutorial from everyone's favorite digital spreadsheet guru, ExcelIsFun, the 19th installment in his "Highline Excel Class" series of free video Excel lessons, you'll learn about using Advanced Filter to extract data from an Excel List/Table/Database. See these 7 Advanced Filter examples:
Even Halo: Reach on the Xbox 360 has hidden collectable items! All in the convenient (for the people hiding them) size of a small data pad! Earlier you got access to the first 9 data pads that you can get on any difficulty. Next, you will get a look on the next 9 data pads that you can only acquire while being on Legendary difficulty!
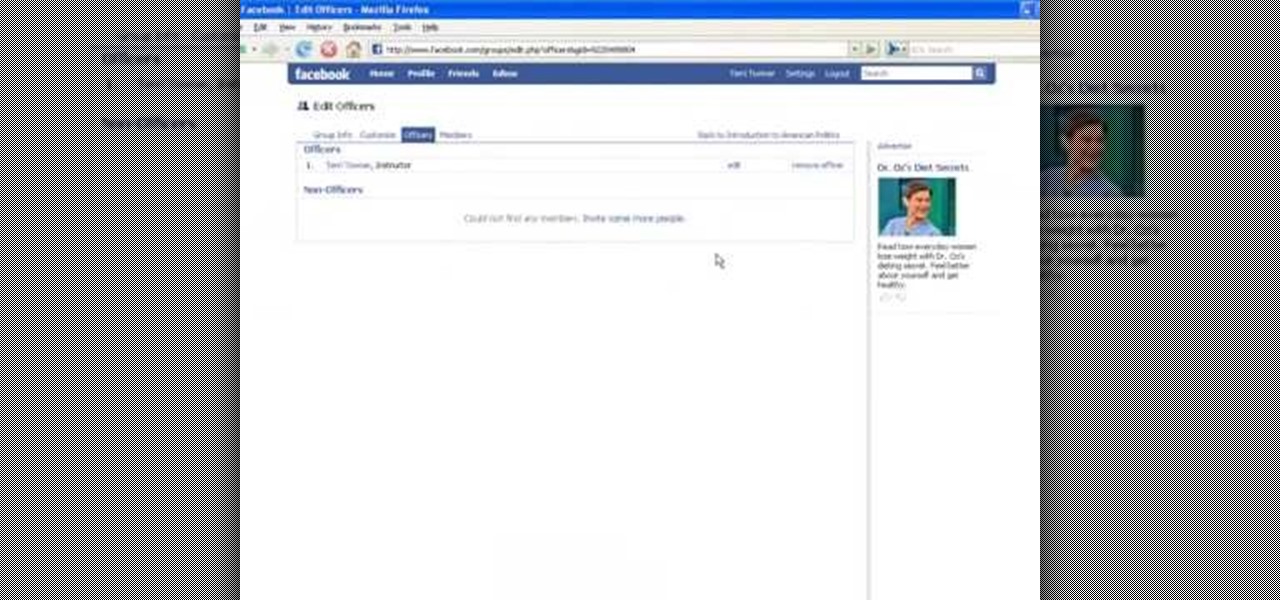
In this tutorial, we learn how to set up a group on Facebook. First, log into your Facebook, then click on "groups", then click "create a new group". Now, give your group a name, description, news, email address, and contact information. When finished, click on "create group". Now you will be able to customized your group by adding images. Once you do this, you can add a website and change your different options. Allow only instructors to upload photos, because students may decide to upload i...
If you use Microsoft Excel on a regular basis, odds are you work with numbers. Put those numbers to work. Statistical analysis allows you to find patterns, trends and probabilities within your data. In this MS Excel tutorial from everyone's favorite Excel guru, YouTube's ExcelsFun, the 32nd installment in his "Excel Statistics" series of free video lessons, you'll learn how to group when the quantitative data are whole numbers, integers or discrete data and how to group when the quantitative ...
New to Microsoft Excel? Looking for a tip? How about a tip so mind-blowingly useful as to qualify as a magic trick? You're in luck. In this MS Excel tutorial from ExcelIsFun, the 255th installment in their series of digital spreadsheet magic tricks, you'll learn how to create a two-variable data table in Excel for what-if analysis. See the PMT function and learn about the formula equivalent to a data table.
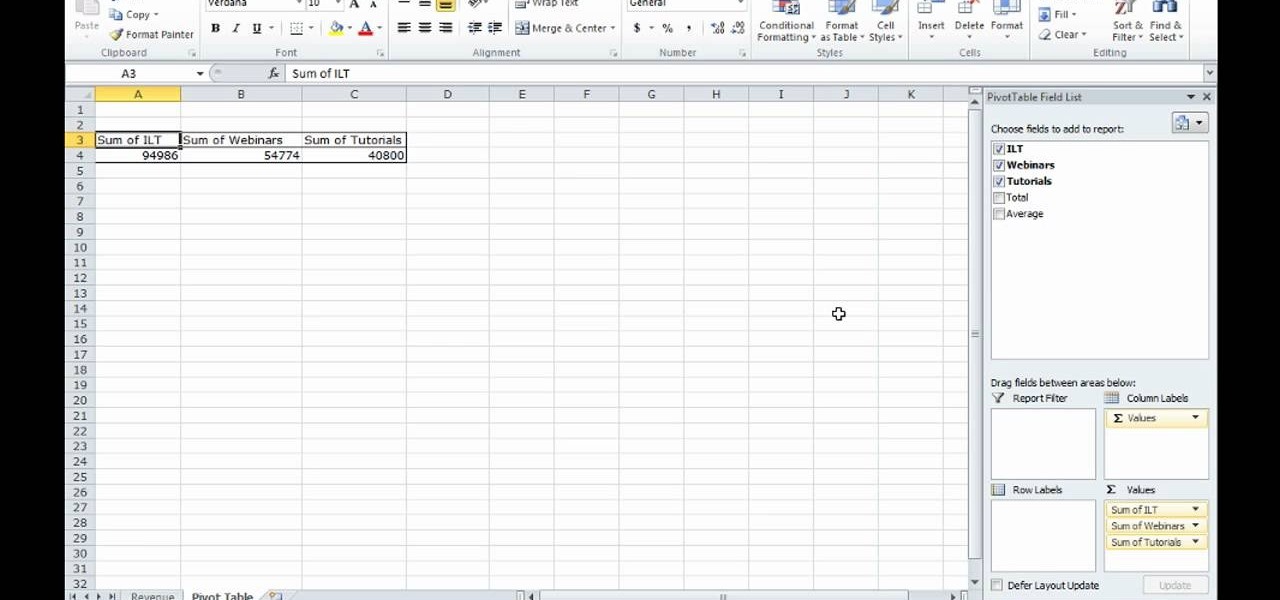
This video shows how to make a quick pivot table data filtering by using Excel 2010's ‘Slicer’ functionality. ‘Slicer’ delivers enhanced visual filtering method to allow you to get the data you need more quickly. When selecting a cell in the pivot table you will find ‘Slicer’ in the filter group of the ‘Insert’ tab. Click on ‘Slicer’ and an 'Insert Slicer' dialogue shows up where you can pick particular data fields from the slider list. Once you click on ‘OK’, the ‘Slicer’ objects with filter...
Welcome to a tennis lesson from FuzzyYellowBalls, the the best place to learn how to play tennis online. Our free video tennis lessons teach you how to play the game in a new way that combines technical analysis, visual learning, and step-by-step progressions.
Data thieves don't have to be programming wizards to get their hands on your personal information. They often find hard drives that contain financial and other sensitive data at flea markets, charity shops, the city dump—even on eBay. In this video tutorial, PC World explains how to completely erase sensitive data from old drives before recycling or discarding them. Wipe your old hard drives with this how-to.
If you use Microsoft Excel on a regular basis, odds are you work with numbers. Put those numbers to work. Statistical analysis allows you to find patterns, trends and probabilities within your data. In this MS Excel tutorial from everyone's favorite Excel guru, YouTube's ExcelsFun, the 24th installment in his "Excel Statistics" series of free video lessons, you'll learn how to create quantitative data frequency distributions with pivot tables. See how to create the correct unambiguous labels ...
If you use Microsoft Excel on a regular basis, odds are you work with numbers. Put those numbers to work. Statistical analysis allows you to find patterns, trends and probabilities within your data. In this MS Excel tutorial from everyone's favorite Excel guru, YouTube's ExcelsFun, the 12th installment in his "Excel Statistics" series of free video lessons, you'll learn how to use Advanced Filter 'Unique Records Only" to extract a list of unique items from a data base, and then use the COUNTI...
Check out this informative video tutorial from Apple on how to format data values with the format bar in Numbers '09.
If you're anything like us, you hated your name for a good three or four years during your childhood, occuring probably not so surprisingly around our awkward puberty years. Whether you like your name or not, putting it in graffiti - transforming it into art, if you will - puts a whole new spin on things.
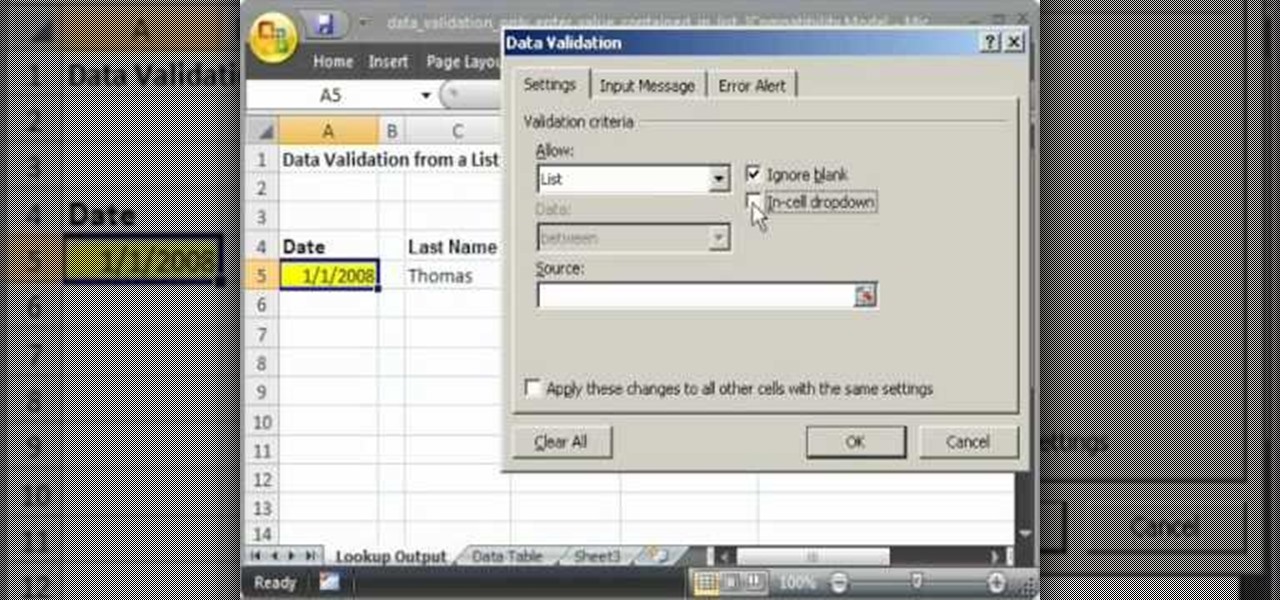
This video shows you how to idiot-proof a data set in Excel pretty much. It demonstrates how to enable data validation in a cell, so that when you type something in it must be in a predetermined list or will not work. Start by typing in your data table in a second tab. His example is a date, then information about certain employees based on that day. To enter the data validation menu, click the cell you want to use and then hit ALT+D+L to bring it up. Go to settings, then under the Allow menu...
Looking to find the standard deviation of your set of values? Standard deviation quantifies how diverse the values of your data set are, and is useful in determining how different your numbers are from each other.
We all have our reasons for erasing personal data from a phone. Whether you just ended a bad relationship whose face you never want to see again (lots of text messages) or just want to restore your privacy on the cell phone, erasing may be your only option.
If you use Microsoft Excel on a regular basis, odds are you work with numbers. Put those numbers to work. Statistical analysis allows you to find patterns, trends and probabilities within your data. In this MS Excel tutorial from everyone's favorite Excel guru, YouTube's ExcelsFun, the 10th installment in his "Excel Statistics" series of free video lessons, you'll learn how about data sets and the nominal, ordinal, interval and ration scales/levels of measurement and see two Pivot Tables that...
Ever use an open hotspot on your Note 3, only to find out that it's severely restricted to what sites you can access? While getting online with free Wi-Fi is great for those who have a limited data plan, when that one site you absolutely need to visit is blocked, you're left frustrated and sent back into the Wi-Fi menu for another access point.
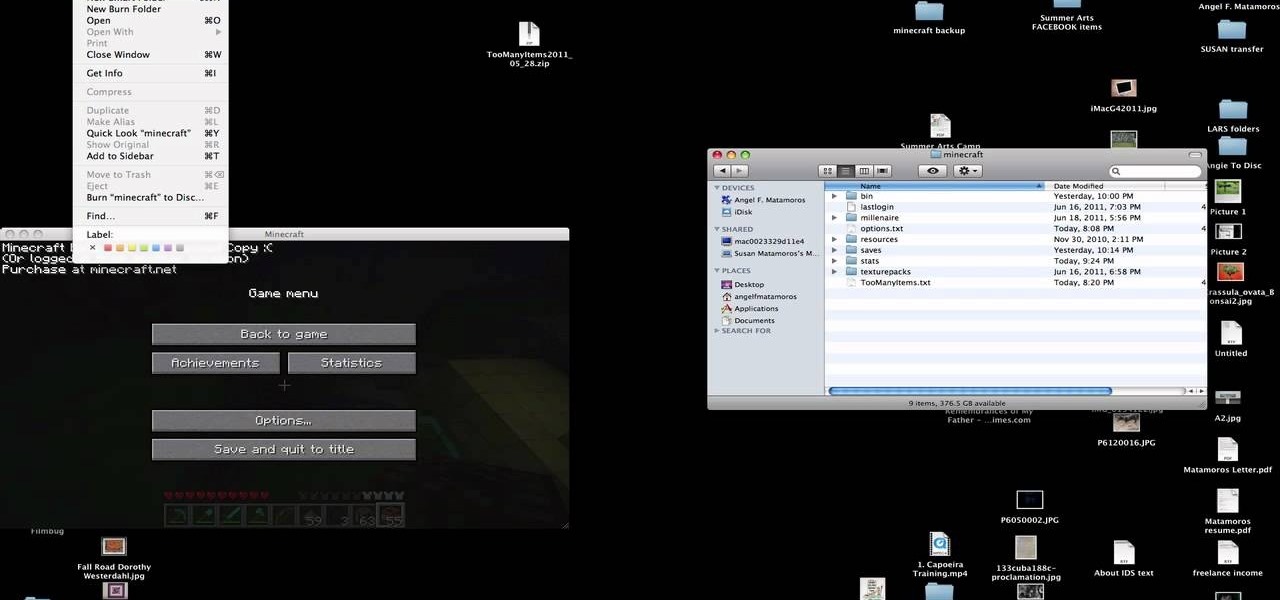
You have worked long and hard creating an entire world of Minecraft data. Make sure you have all of that saved data backed up. Watch this video to learn how to backup your Minecraft data. You will be glad that you did.
Thirty dollars a month may be a little steep for an unlimited data plan for iPad users. To cut down on your data usage, you can download the Offline Pages app to browse articles or blogs offline. InstaPaper is another account you can use as well, and both will cut down on your data usage per month.
Punky pop twosome 3OH!3 are eccentric to say the least. With songs that wax poetic in memorable and tasteful lines like "Do the Helen Keller and talk with your hips," it's impossible to ignore this pop group these days.
Excel is great, and if you're a Mac user, Excel 2008 for Mac has a lot of new and useful great features you can use to maximize efficiency in your spreadsheets. Excel doesn't have to be the boss anymore, you can! The Microsoft Office for Mac team shows you all the great features in this how-to video.
Data can be troubling, especially if there's a ton of it plaguing your Excel worksheet. But Excel 2008 for Mac makes life a little easier and less confusing thanks to a few worksheet tips and features you can utilize to work with your data in worksheet cells. The Microsoft Office for Mac team shows you just how to work with worksheets in this how-to video.
Not every client or coworker likes to mine through a spreadsheet to find all the important data. So, with Excel 2008 for Mac, you can easily share that data without sending the entire Excel spreadsheet. To do this, all you need to do is to use the "copy as picture" option. The Microsoft Office for Mac team shows you just how to insert a spreadsheet snippet in this how-to video.
If you want to manage what sort of data is entered into your Excel spreadsheet, data validation will help you to accomplish just that. In this Excel tutorial from ExcelIsFun, the 549th installment in their series of Excel magic tricks, you'll learn how to use data validation to full effect in your Microsoft Office projects.
A histogram is a summary graph showing a count of data points that fall in various ranges. Histograms are used in statistics and other forms of mathematics. In this video, learn how to create your own histogram using data analysis on the computer. This tutorial will show you how to create a frequency distribution, a cumulative frequency distribution, a histogram chart and an ogive chart with the data analysis add-in.
See how simple it is to create data-driven web sites using ASP.NET 2.0, Visual Web Developer 2005 Express Edition, and SQL Server 2005 Express Edition. Watch this video tutorial to learn how to create a database, add its data, and display that data on a web page.
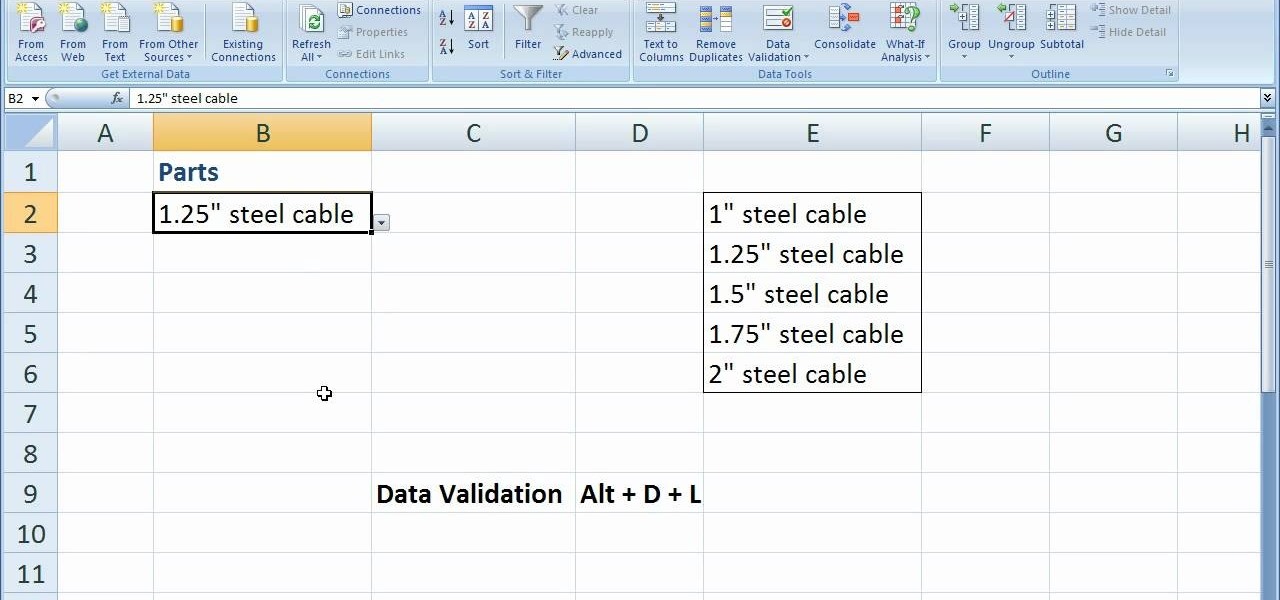
In this software video tutorial you will learn how to create drop down menus in Excel using Data Validation. This example will show you how to display a list of parts in a drop down menu. Create the list of parts somewhere in your worksheet. Then in the cell underneath the one where you want to display the parts, go to the data validation window and enter the data. For this select the cell and then press 'Alt + D + L' to bring up the data validation box. Here you click on 'settings' and selec...
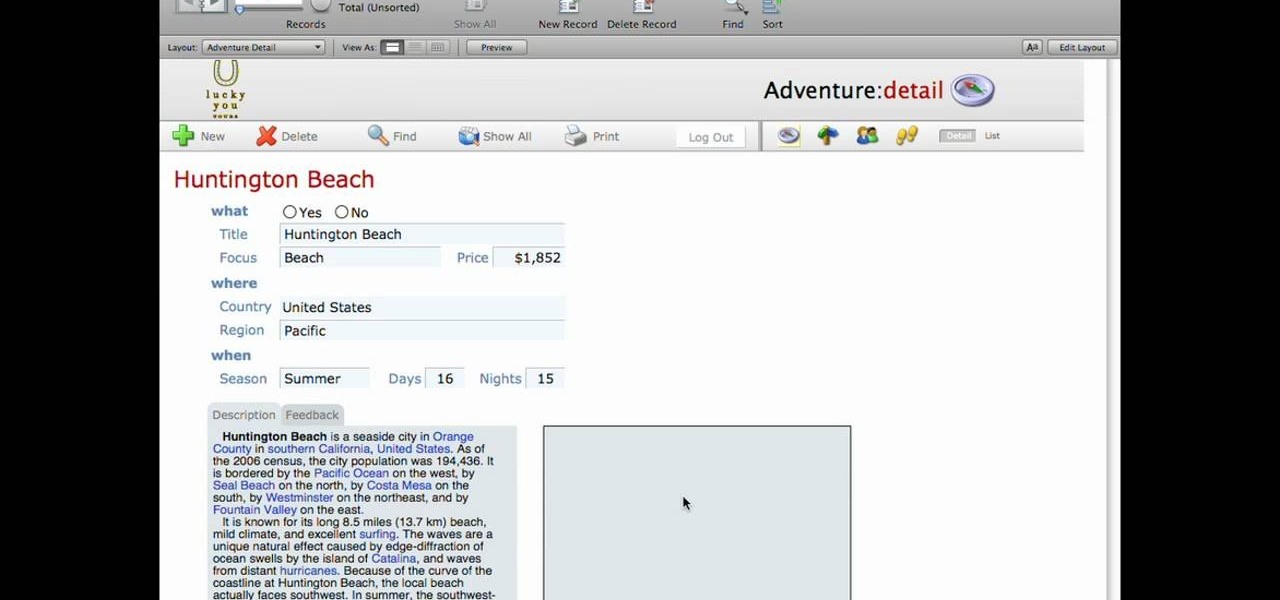
This lynda.com video tutorial shows how to use container fields with FileMaker Pro 10. When you want to create fields in FileMaker database you have the choice on what kind of fields you want to make. Many general fields are self explanatory like text, date etc., but there is a special kind of field called the container field. FileMaker Pro container field is a versatile data type in that it can store any kind of binary data. Container fields can be used to hold binary data in four broad clas...