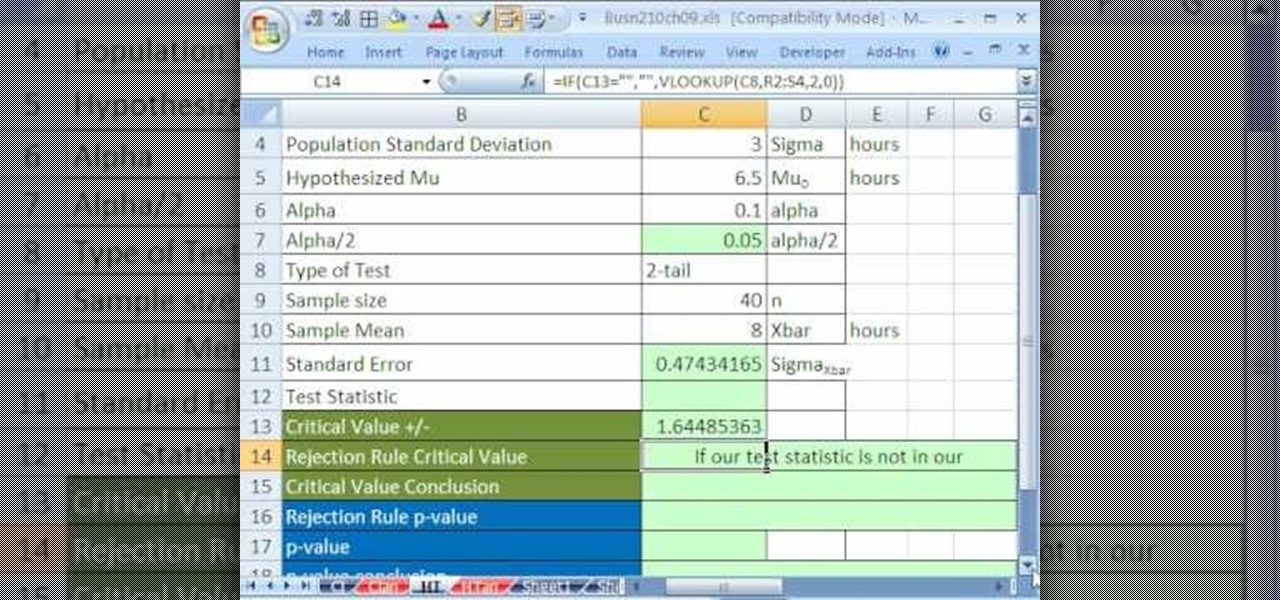
If you use Microsoft Excel on a regular basis, odds are you work with numbers. Put those numbers to work. Statistical analysis allows you to find patterns, trends and probabilities within your data. In this MS Excel tutorial from everyone's favorite Excel guru, YouTube's ExcelsFun, the 91st installment in his "Excel Statistics" series of free video lessons, you'll learn how to use TINV and TDIST functions to find critical values given an unknown sigma value.

If you use Microsoft Excel on a regular basis, odds are you work with numbers. Put those numbers to work. Statistical analysis allows you to find patterns, trends and probabilities within your data. In this MS Excel tutorial from everyone's favorite Excel guru, YouTube's ExcelsFun, the 89th installment in his "Excel Statistics" series of free video lessons, you'll learn how to use the NORMSINV function for critical values and the NORSDIST function for p-values.

In this video the teacher shows us how to use a TI-84 plus graphing calculator to graph a function, adjust the view window, and determine the values of several types of critical points on the graph such as x-intercept, y-intercept, local maximums, and local minimums. After entering the function in the Y= editor she presses the ZOOM button and selects Z-Standard this adjusts the view window to a range of -10 to 10 on both axis. To find each of the critical points requested the teacher uses the...
If you use Microsoft Excel on a regular basis, odds are you work with numbers. Put those numbers to work. Statistical analysis allows you to find patterns, trends and probabilities within your data. In this MS Excel tutorial from everyone's favorite Excel guru, YouTube's ExcelsFun, the 47th installment in his "Excel Statistics" series of free video lessons, you'll learn how to use the NORMSINV function for critical values and the NORSDIST function for p-values. Compare building confidence int...

The Cloud Security Alliance (CSA), a leading IT trade association, has published its first report on risks and recommendations for connected-vehicle security, ahead of when driverless cars are about to see volume production in the near future.
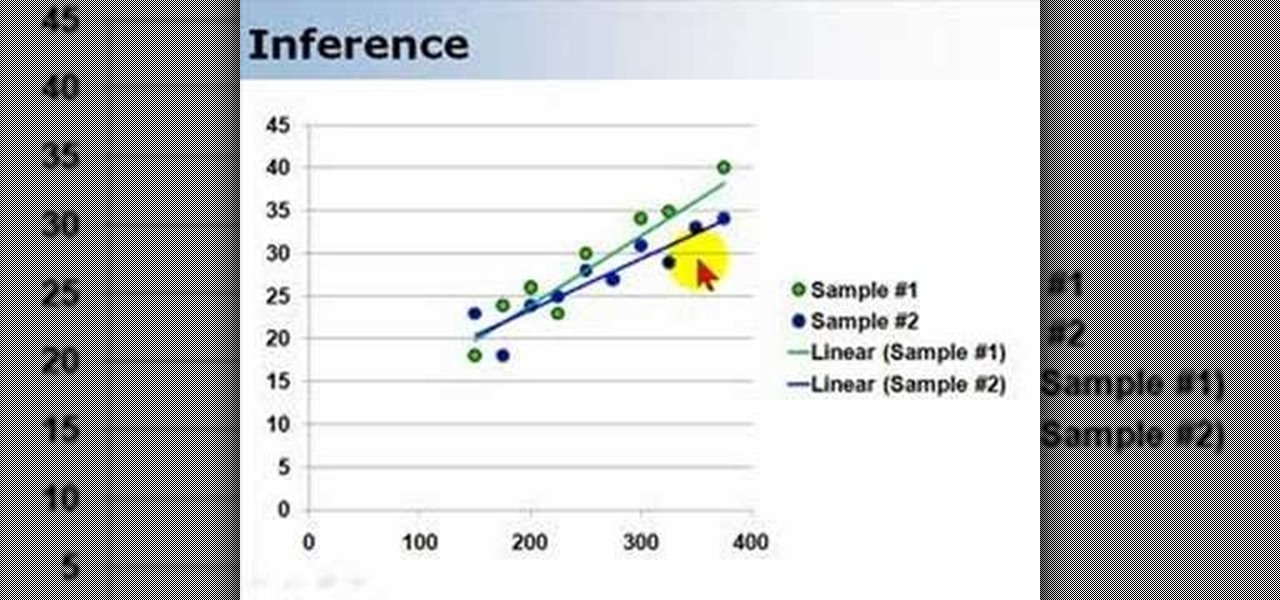
Regression functions are a vital part of statistical analysis of populations, and if you're involved in business, science, or nearly any academic field you should understand how it works. This series of videos will show you how standard regression functions, ANOVA, ordinary least squares, and everything else you need to know.

In this video tutorial, viewers learn about the structure and scoring of the PSAT. The PSAT is basically a shorter version of the SAT. The test lasts for 2 hours and 10 minutes. This test contains 5 sections: two 25-minute critical reading, two 25-minute math and one 30-minute writing. In the critical reading sections, there will be passage-base and sentence completion questions. In the math sections, there will be multiple choice and gridding questions. In the writing section, there will be ...
In this Education video tutorial you will learn how to avoid wrong answers on the SAT critical reading area. Five principles to keep in mind are rephrase the question and predict the answer, answer the question being asked, find evidence in the passage, extreme answers are suspicious and finally remember a little wrong is all wrong. To rephrase the question, read 2 lines before and after, ask the question in your own words and find the answer choice that best matches your prediction. Now comi...
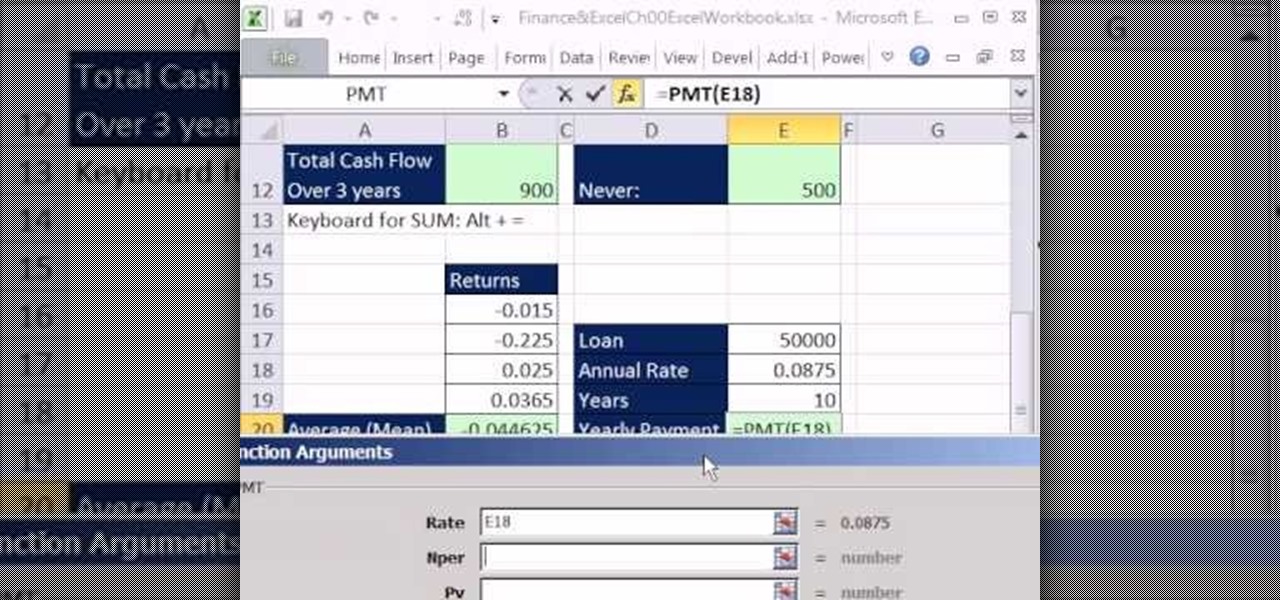
Excel 2008 for Mac makes it easy to create formulas for cells. You could always do it before, but now with the new Formula Builder feature, building formulas just got one step closer to simple. The Microsoft Office for Mac team shows you just how to build formulas by using the new Formula Builder in this how-to video.
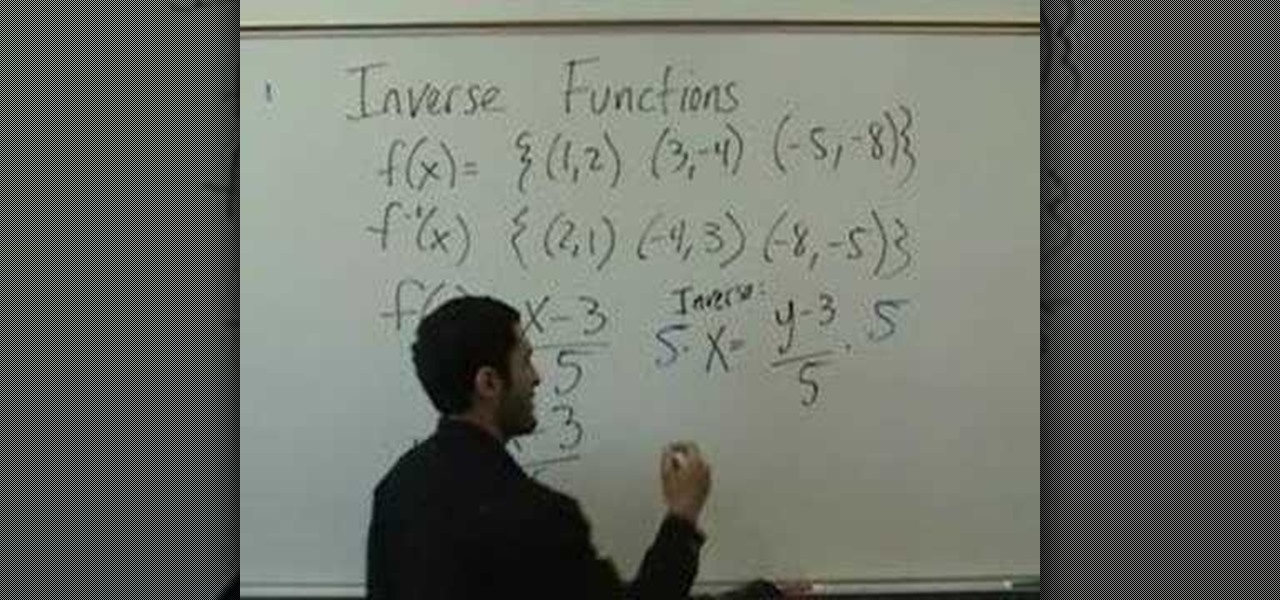
In this video the instructor teaches about inverse functions. Normally in inverse functions problems you are given a function that has a set of points and you are asked to find the inverse of that function. So if the function has a point in the form (x, y) then the inverse function has its points in the form of (y, x). Now when you are given a function f(x) that is in the form of x and asked to find its inverse, equate the function to y. Solve the equation to get the value of variable x in th...
In this video the instructor shows how to graph a piecewise defined function. A piecewise defined function is a function that is defined in separate pieces. In these kind of functions, for different ranges of the value of x, you are given different small functions, all of which together make the whole function. This means your equation of the function is given in the form of smaller functions. Now to graph these kind of equations all you have to do is graph the individual equations in the sam...
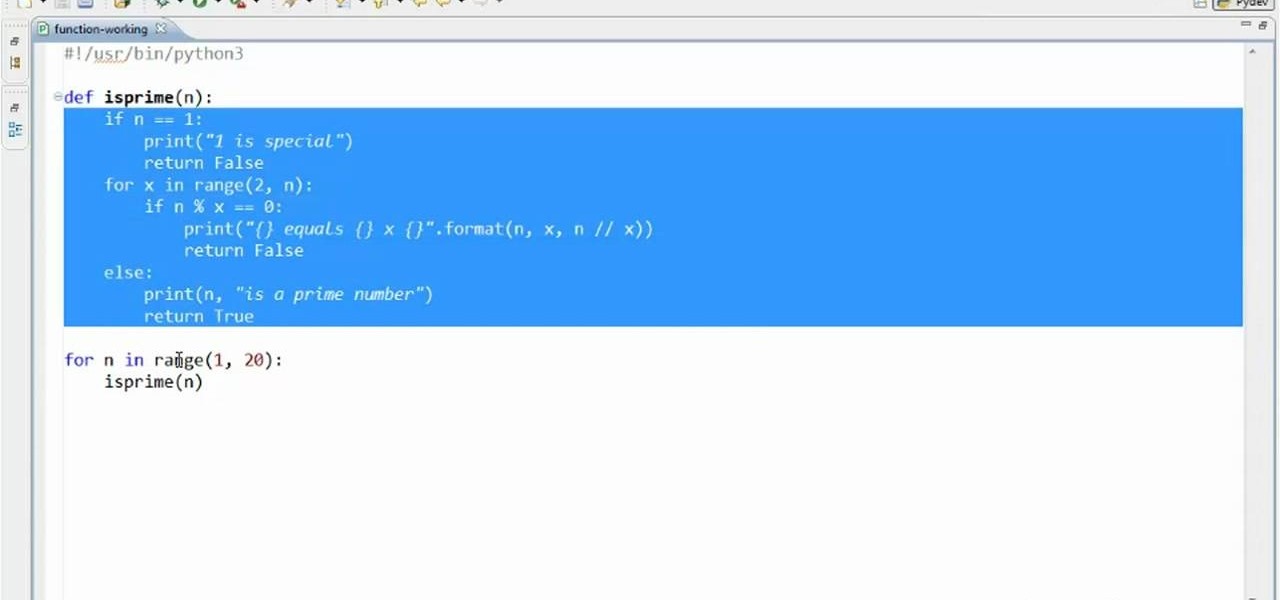
In this clip, you'll learn how to create and call simple functions when coding in Python 3. Whether you're new to the Python Software Foundation's popular general purpose programming language or a seasoned developer looking to better acquaint yourself with the new features and functions of Python 3.0, you're sure to benefit from this free video programming lesson. For more information, including detailed, step-by-step instructions, watch this video guide.
While iOS 11 was famous for its instability, performance issues weren't the only factor holding it back. The OS overhauled the notification system on iPhone, but not necessarily for the better. iOS 12, however, improves upon these changes, bringing critical features that make viewing and interacting with notifications on your iPhone on par with Android.
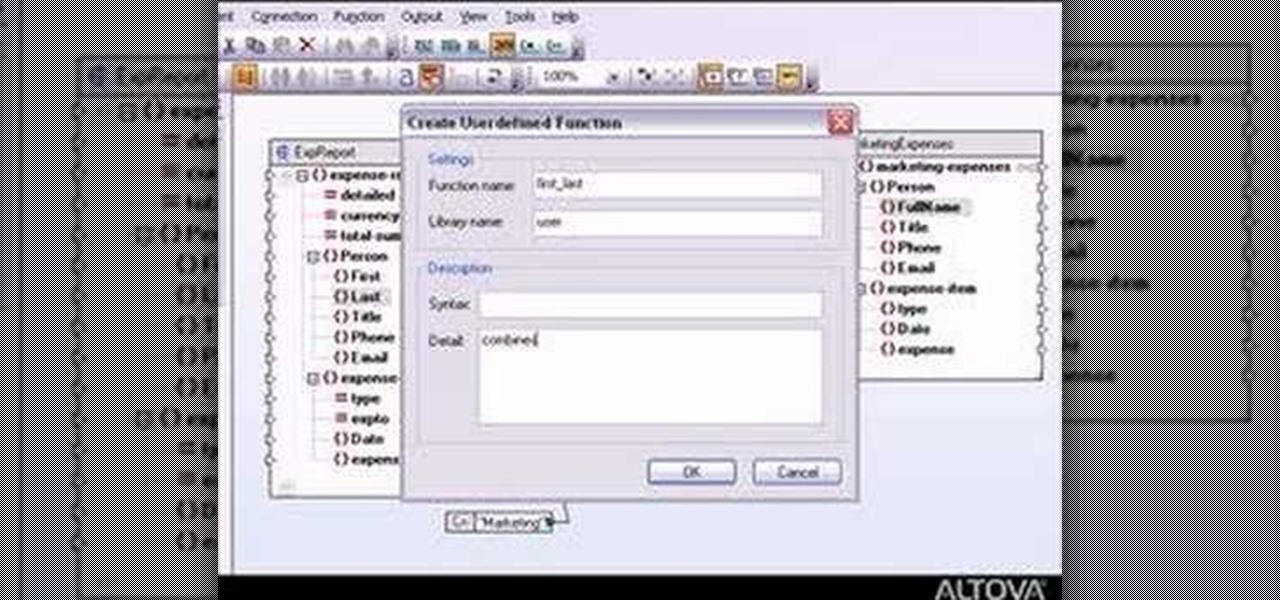
MapForce includes a powerful visual function builder that lets you create new data processing functions in a graphical way using existing functions and libraries. Learn how to combine multiple separate functions that returns a single result with this tutorial.
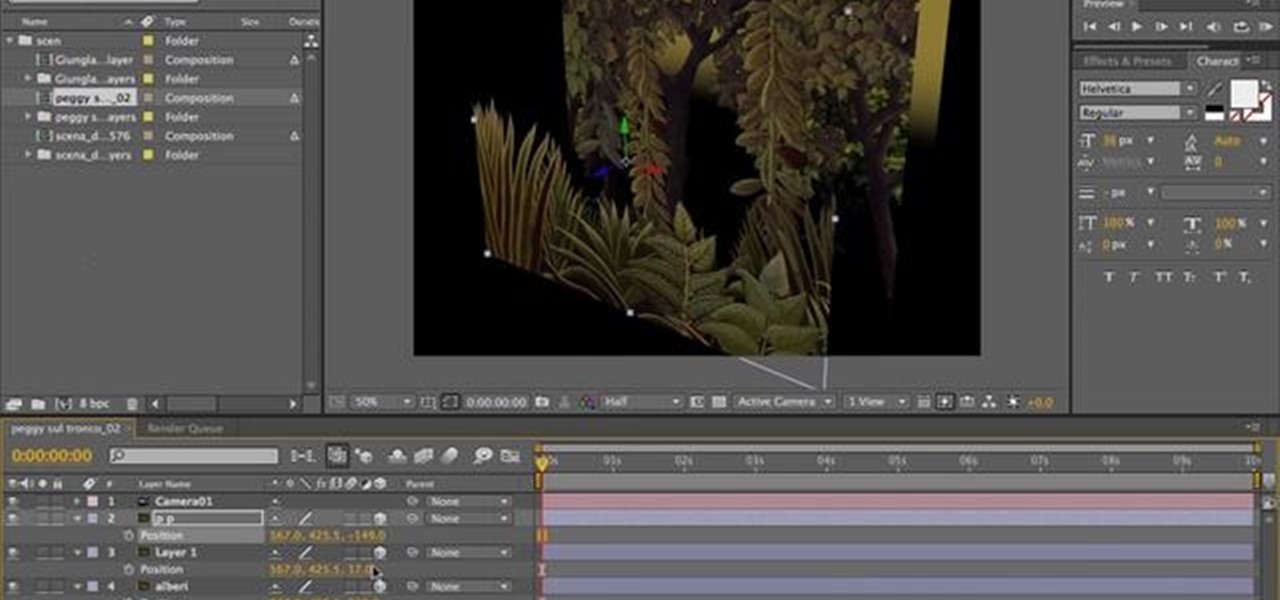
Using a layered photograph, chroma key footage and depth of field, prolific Italian designer Juri Ciana demonstrates precisely how to create a stunningly beautiful 3D composition with After Effects. In this informative video-only tutorial, depth of field and focus is utlized as critical elements that provide the various components of this video composition with a living vibrancy and dynamism.
No matter what kind of business you have, small or big, online-based or not, when you're dealing with email marketing, the number one things your targets will see is the subject line, and if your subject line looks spammy or uninteresting, it's not going to help you one bit.
In this video, we learn how to play Jazz guitar: Functioning & Static Dominant Chords. When you play an A7 going to a D chord, you are playing a functioning dominant, because a five chord always wants to go to a one chord. This is because of the tension in the five chord and how it resolves to the one chord. You will hear that the chord wants to go to a different chord, so make sure you understand this concept as you are playing. If the chord does go to the other, it's referred to as a functi...
Money skills are critical for any adult, which means the best time to teach someone financial responsibility is during the teenage years. These parenting tips are meant to teach your child about income and costs. Use allowance as a tool to show your teenager how to manage their own money.
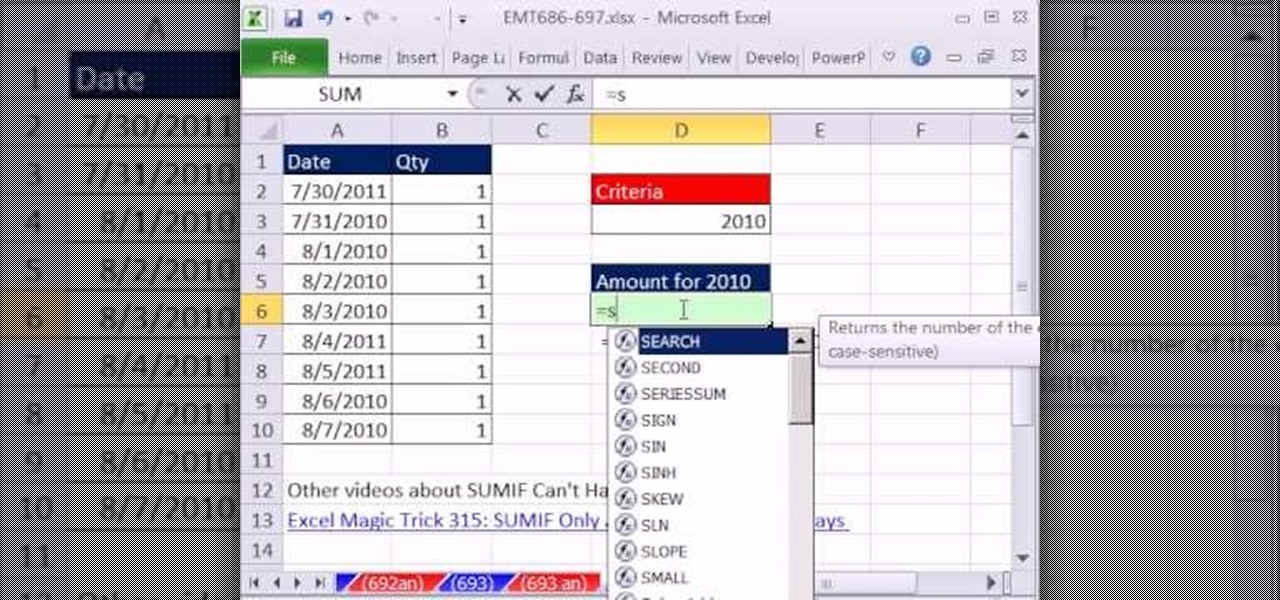
New to Microsoft Excel? Looking for a tip? How about a tip so mind-blowingly useful as to qualify as a magic trick? You're in luck. In this MS Excel tutorial from ExcelIsFun, the 694th installment in their series of digital spreadsheet magic tricks, you'll learn how the SUMIF function (and COUNTIF, etc.) cannot accept arrays. If you need to sum by year from transactional data the SUMIF and YEAR functions cannot be used together. Instead we can use the SUMPRODUCT function.
Need to know how to solve function problems in algebra? From Ramanujan to calculus co-creator Gottfried Leibniz, many of the world's best and brightest mathematical minds have belonged to autodidacts. And, thanks to the Internet, it's easier than ever to follow in their footsteps (or just finish your homework or study for that next big test). With this installment from Internet pedagogical superstar Salman Khan's series of free math tutorials, you'll learn how to work with and solve functions.
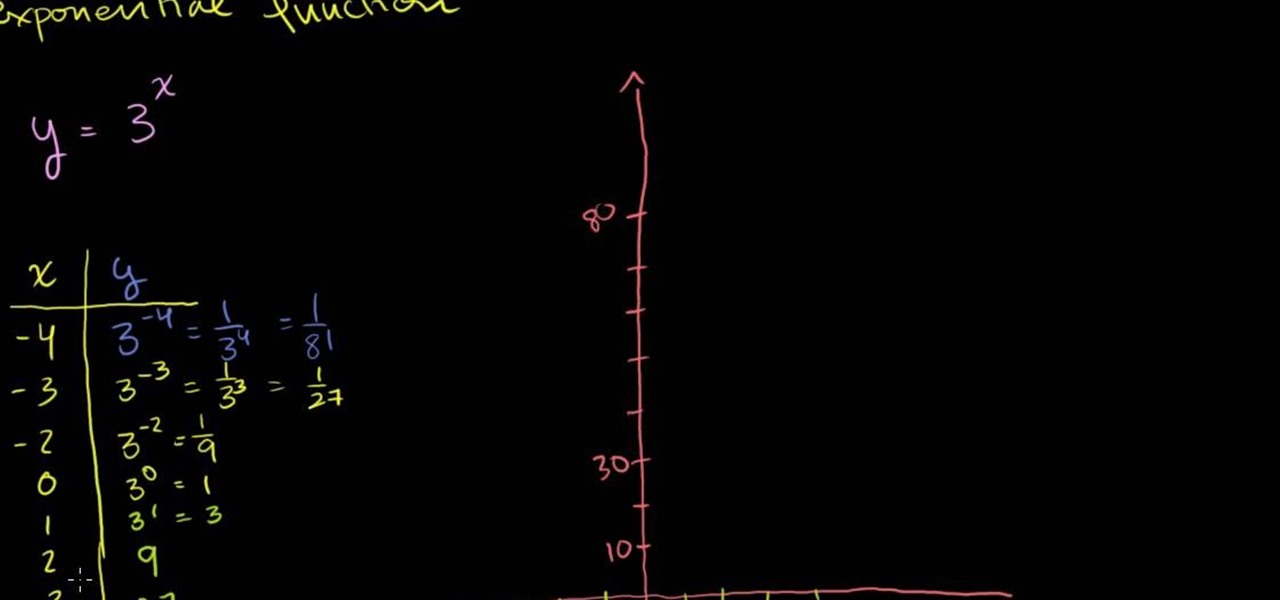
Exponential functions are functions which contains terms which are integers raised to the power of variables. Note that the variables are not raised to the power of integers, but the integers are raised to the power of variables. Variables raised to the power of integers are called as polynomials and are a different class of functions. But exponential functions grow very fast than polynomials with the increase in the value of the variable. To understand the growth of these functions take a si...
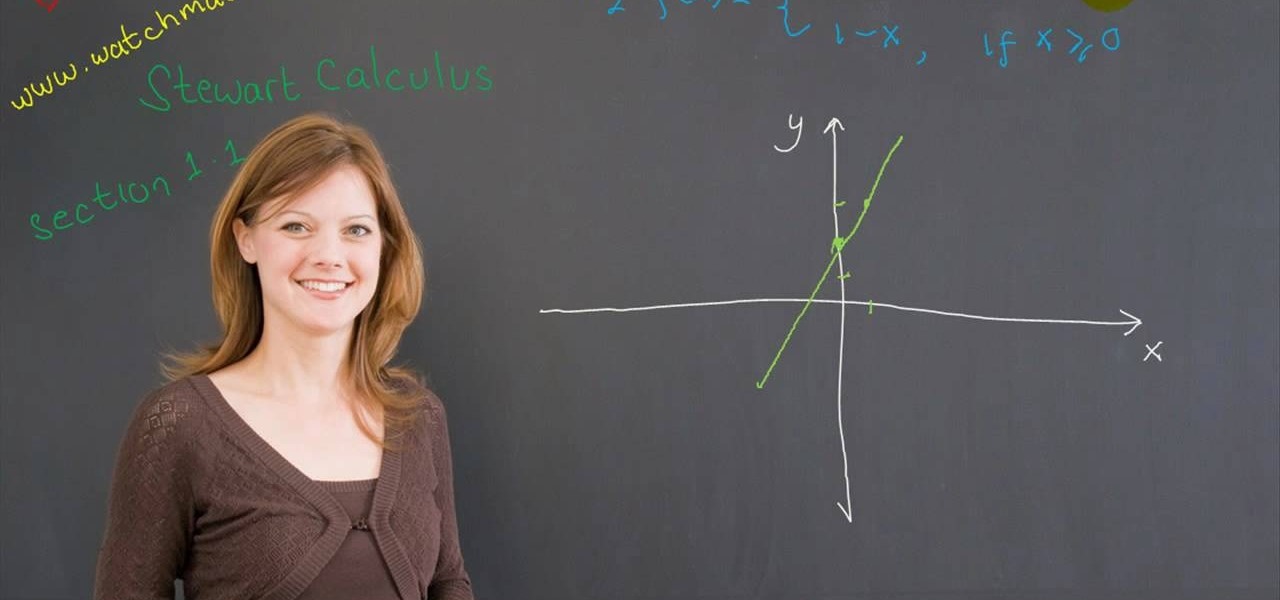
This video teaches us to draw the graph of a piecewise function. This is shown using two examples. In the first example we have 'y' equal to 'x + 2' for x less than zero and '1 - x' for x greater than equal to zero. We plot two points on the function for x less than zero and do the same for the function with x greater than equal to zero. The graph for the first function is erased for x greater than equal to zero, and the same is done for the second function for x less than zero. Note that the...
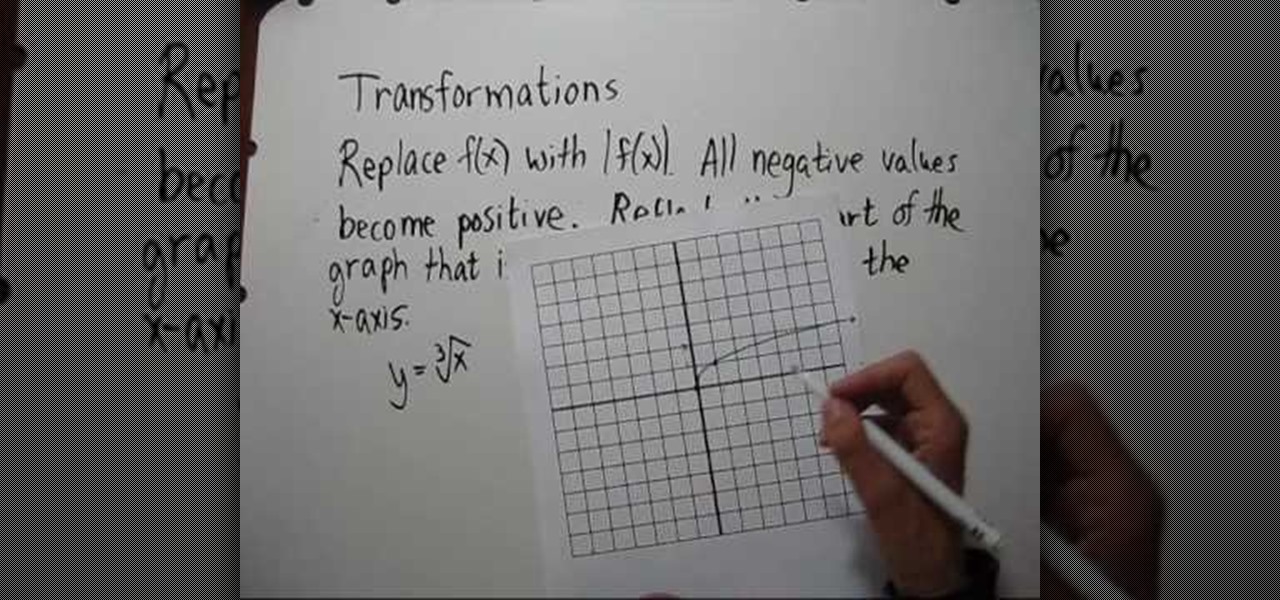
This video shows the method to plot the graph of the absolute value of a function. The video shows the example of the function of cube root of 'x'. The demonstrator first plots the graph of a cube root function. This is done by taking the reference point of positive one and positive eight. The graph is drawn for both negative and positive values of 'x'. After this the graph of absolute function is drawn by taking the absolute value of the cube root function. The resultant graph comes out to b...
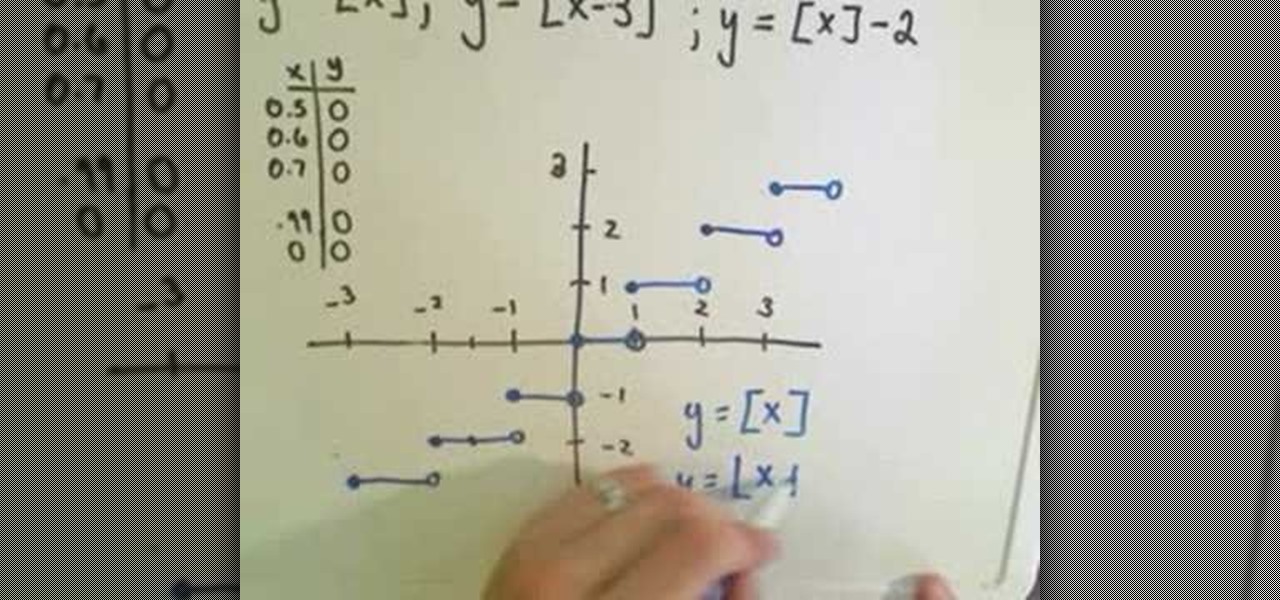
The video shows the explanation of greatest integer function. This video explains this with the help of graphs. The video first describes the basic greatest integer function. This means the greatest integer less than or equal to the number gave. The graph of this function is drawn. The video then shows the variations of this function. The first variation shows the function that replaces the 'x' coordinate with it subtracted by three. This shifts the graph to the right by three units. The seco...
Check out this instructional math video that demonstrates how to calculate mathematical functions and graphs. In this 9th lesson, learn how to solve on SAT Algebra problems using the Official SAT Study Guide (as always). Here are the math problems and their page numbers that this video covers:
What does f(x) mean? What does g(4) mean? We explore this and more in this 3-part series, "Understanding Math Functions."
Trying to sell your house? Increasing its 'curb appeal' is critical to making a good first impression on potential buyers. Update your home's exterior, give your front yard, lawn or garden a facelift and clean the sidewalks.
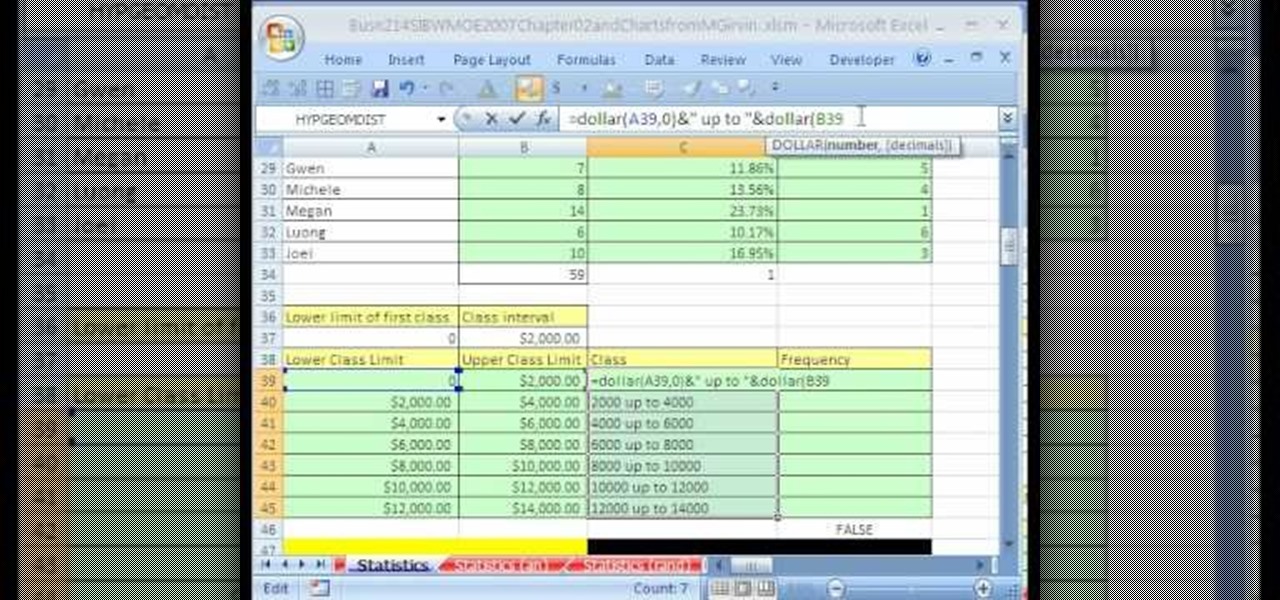
Whether you're interested in learning Microsoft Excel from the bottom up or just looking to pick up a few tips and tricks, you've come to the right place. In this tutorial from everyone's favorite digital spreadsheet guru, ExcelIsFun, the 31st installment in his "Highline Excel Class" series of free video Excel lessons, you'll learn how to build frequency tables and simple histogram charts in Microsoft Excel. Specifically, this video addresses the following subjects:
If you use Microsoft Excel on a regular basis, odds are you work with numbers. Put those numbers to work. Statistical analysis allows you to find patterns, trends and probabilities within your data. In this MS Excel tutorial from everyone's favorite Excel guru, YouTube's ExcelsFun, the 87th installment in his "Excel Statistics" series of free video lessons, you'll learn how to use NORMSINV to test a hypothesis with population standard deviation (sigma) known and proportions.
This test can be used to determine whether the given graph is a function or not.
This tutorial aimed at someone new to Microsoft Excel shows you how to navigate the basic functions of a spreadsheet. It goes over formulas, functions, formula inputs and cell references, all of which you'll need to master in order to use Excel effectively.
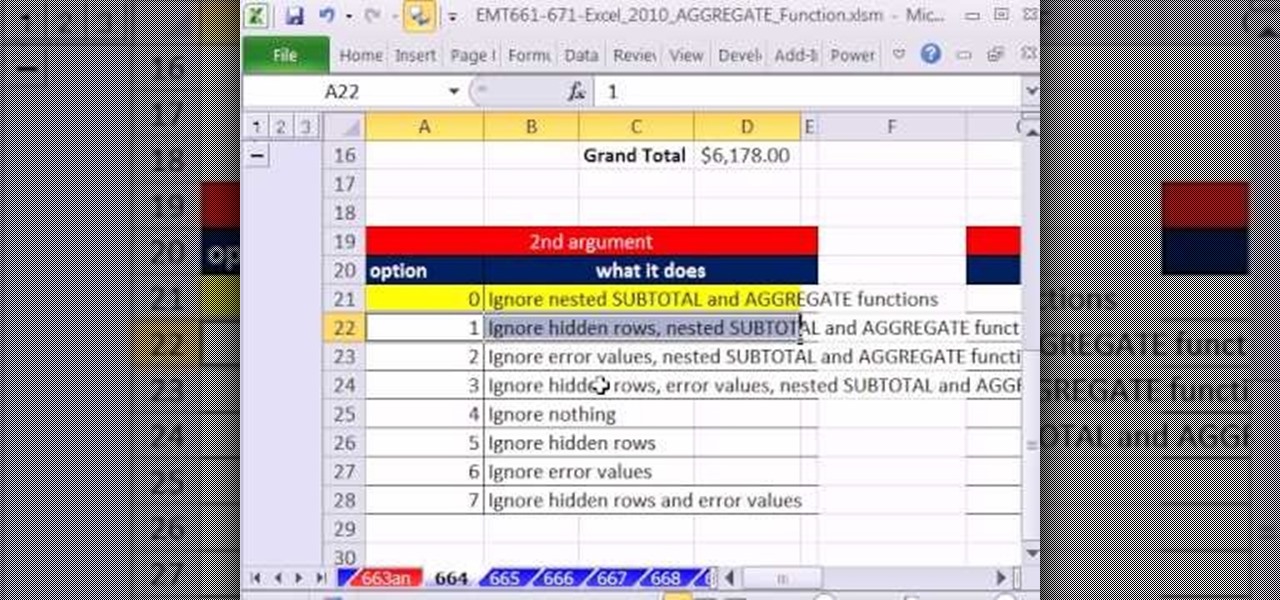
New to Microsoft Excel? Looking for a tip? How about a tip so mind-blowingly useful as to qualify as a magic trick? You're in luck. In this MS Excel tutorial from ExcelIsFun, the 664th installment in their series of digital spreadsheet magic tricks, you'll learn how to make a calculation on a column of values that contain subtotals that you do not want to include in the calculations. The AGGREGATE function will ignore nested SUBTOTAL and AGGREGATE functions when making calculations.
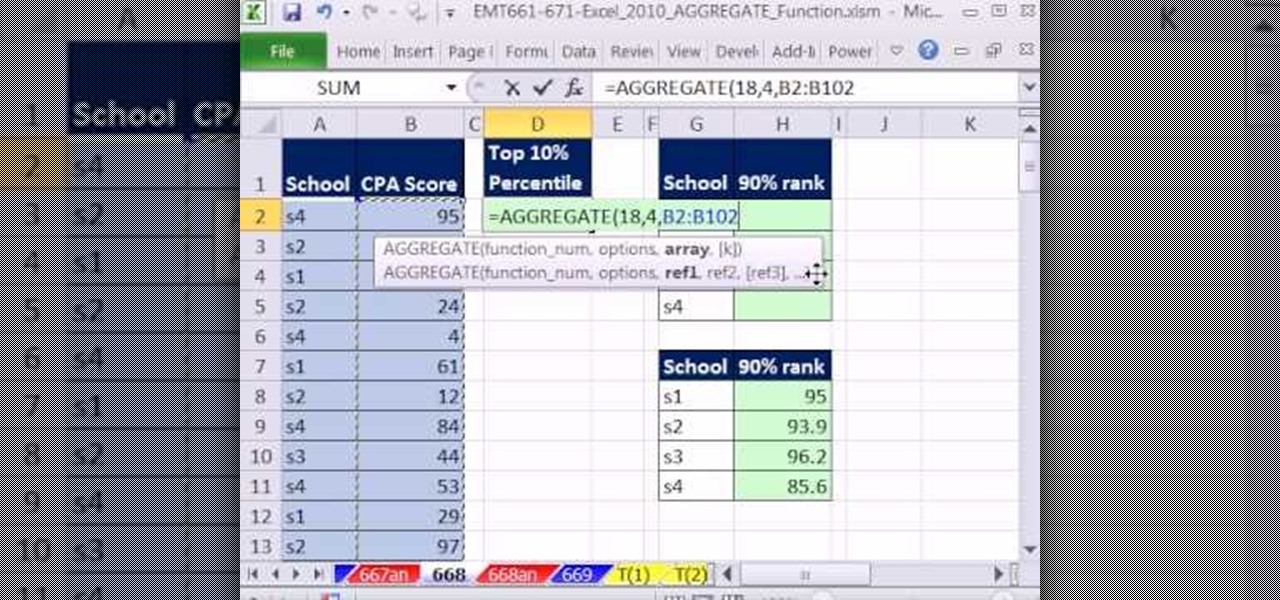
New to Microsoft Excel? Looking for a tip? How about a tip so mind-blowingly useful as to qualify as a magic trick? You're in luck. In this MS Excel tutorial from ExcelIsFun, the 669th installment in their series of digital spreadsheet magic tricks, you'll learn how to use the AGGREGATE function in Microsoft Excel 2010 and later. This new function is better than SUBTOTAL function because 1) the options argument set to 18 will calculate Percentile and 2) AGGREGATE can handle arrays. See how th...
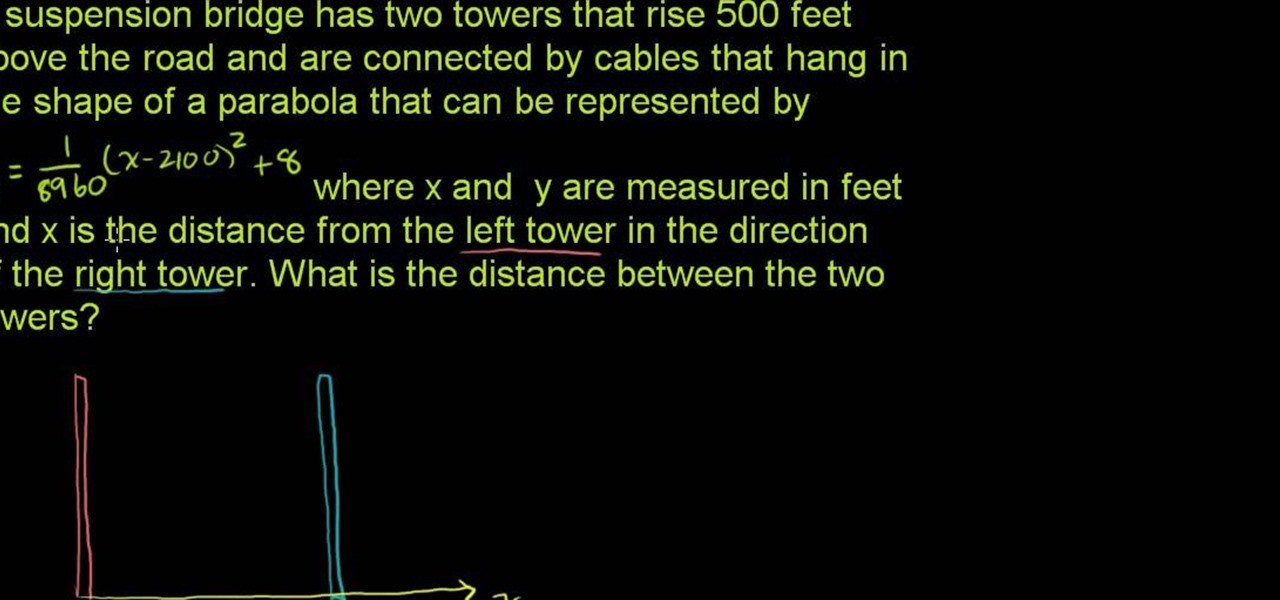
From Ramanujan to calculus co-creator Gottfried Leibniz, many of the world's best and brightest mathematical minds have belonged to autodidacts. And, thanks to the Internet, it's easier than ever to follow in their footsteps (or just finish your homework or study for that next big test). With this installment from Internet pedagogical superstar Salman Khan's series of free math tutorials, you'll learn how to unpack and solve word problems that require you to apply quadratic functions in algebra.
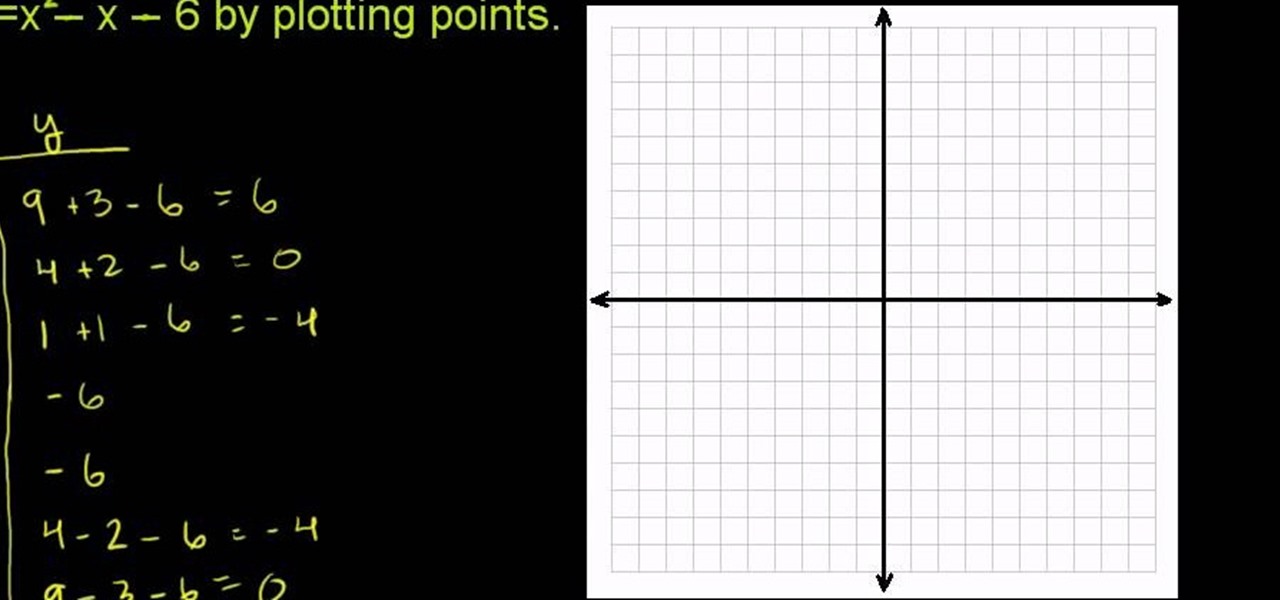
From Ramanujan to calculus co-creator Gottfried Leibniz, many of the world's best and brightest mathematical minds have belonged to autodidacts. And, thanks to the Internet, it's easier than ever to follow in their footsteps (or just finish your homework or study for that next big test). With this installment from Internet pedagogical superstar Salman Khan's series of free math tutorials, you'll learn how to find answers to quadratic function problems in intermediate algebra by graphing.
Need a little help figuring out how to find the inverse of a function in algebra? Watch this free video lesson. From Ramanujan to calculus co-creator Gottfried Leibniz, many of the world's best and brightest mathematical minds have belonged to autodidacts. And, thanks to the Internet, it's easier than ever to follow in their footsteps (or just finish your homework or study for that next big test). With this free math tutorial, you'll learn how to calculate the inverse of a given algebraic fun...
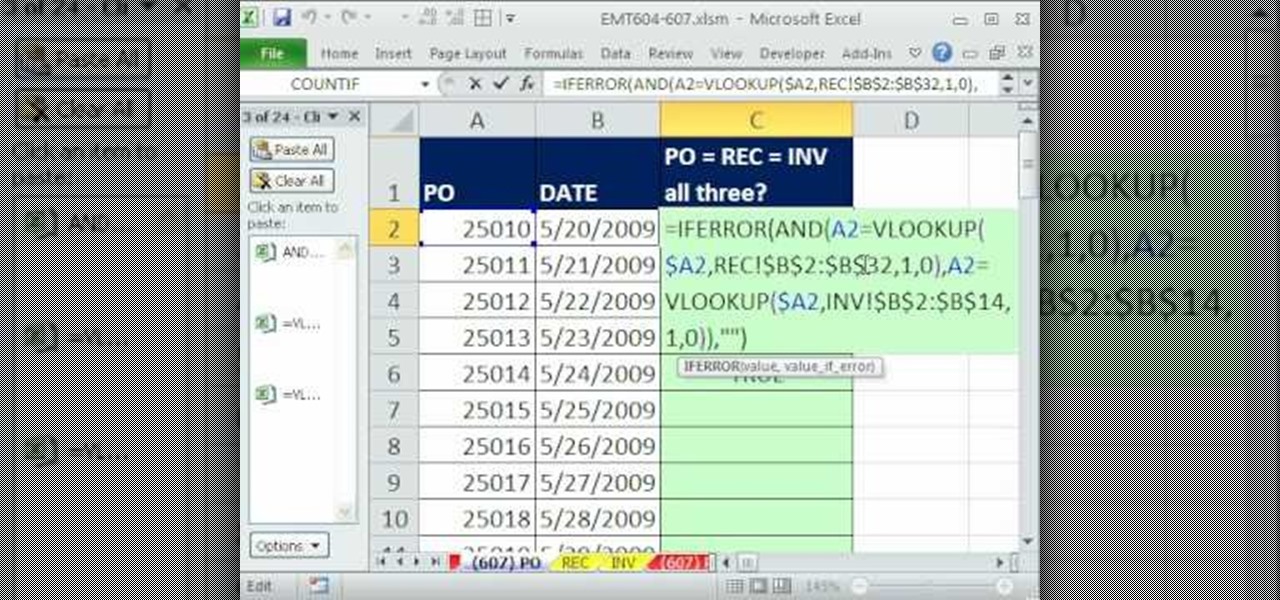
New to Microsoft Excel? Looking for a tip? How about a tip so mind-blowingly useful as to qualify as a magic trick? You're in luck. In this MS Excel tutorial from ExcelIsFun, the 607th installment in their series of digital spreadsheet magic tricks, you'll learn how to match three lists using 2 VLOOKUP functions and the AND function.
Looking for a primer on how to create and work with array formulas in Microsoft Office Excel? You've come to the right place. In this free video tutorial from everyone's favorite MS Excel guru, YouTube's ExcelIsFun, the 12th installment in his series of Excel array formula series, you'll learn how to use the array function MMULT to multiply multiple matrices in matrix algebra. (NB: This is an array function that requires the Ctrl + Shift + Enter trick.)
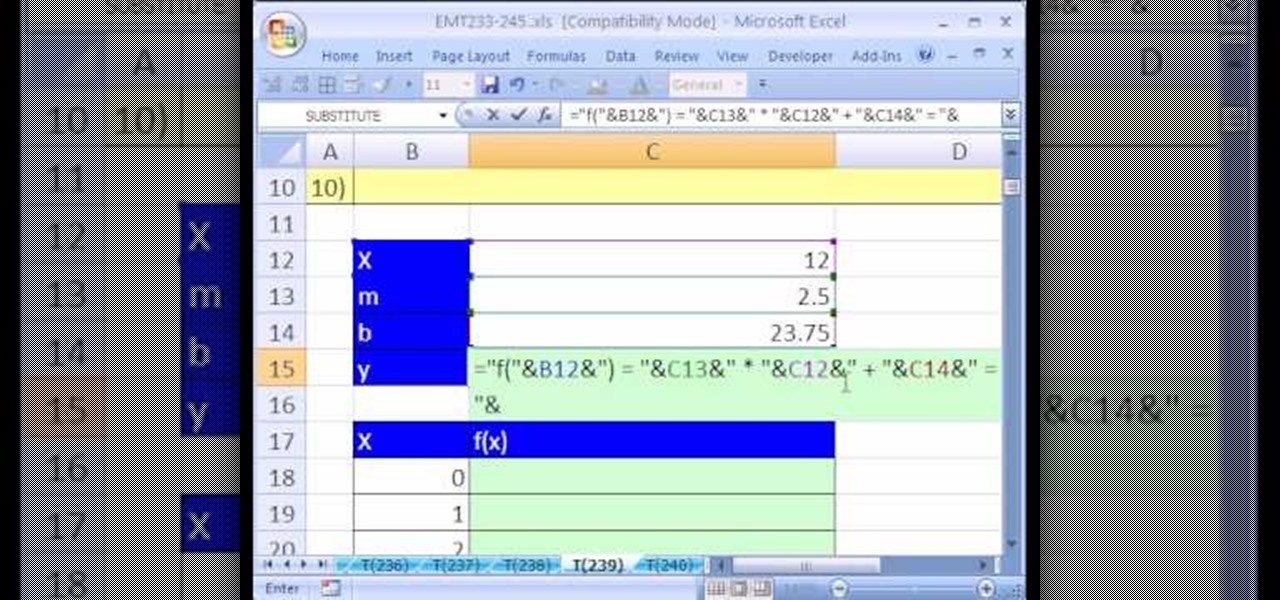
New to Microsoft Excel? Looking for a tip? How about a tip so mind-blowingly useful as to qualify as a magic trick? You're in luck. In this MS Excel tutorial from ExcelIsFun, the 239th installment in their series of digital spreadsheet magic tricks, you'll learn how to create a chart for a linear function of X in Excel as well as how to use a text formula to display a function of X.
In the last iteration of how to train your python, we covered basic string manipulation and how we can use it to better evaluate user input. So, today we'll be covering how to take user input. User input is very important to scripting. How can we do what the user says if we can't tell what the user wants? There are multiple ways to take input, we can give the user a prompt and take input from them directly, or we could use flags/switches, and take their input before the script is even execute...