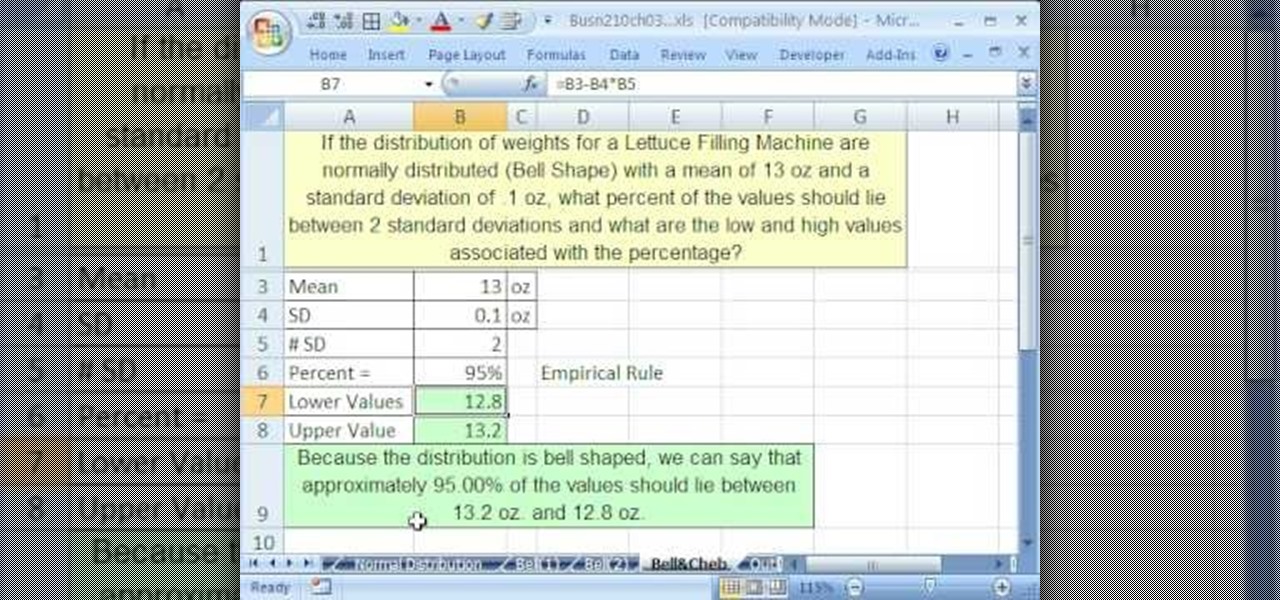
If you use Microsoft Excel on a regular basis, odds are you work with numbers. Put those numbers to work. Statistical analysis allows you to find patterns, trends and probabilities within your data. In this MS Excel tutorial from everyone's favorite Excel guru, YouTube's ExcelsFun, the 48th installment in his "Excel Statistics" series of free video lessons, you'll see comparison of Chebyshev's Theorem and the Empirical Rule (bell curve) and learn when to apply which.
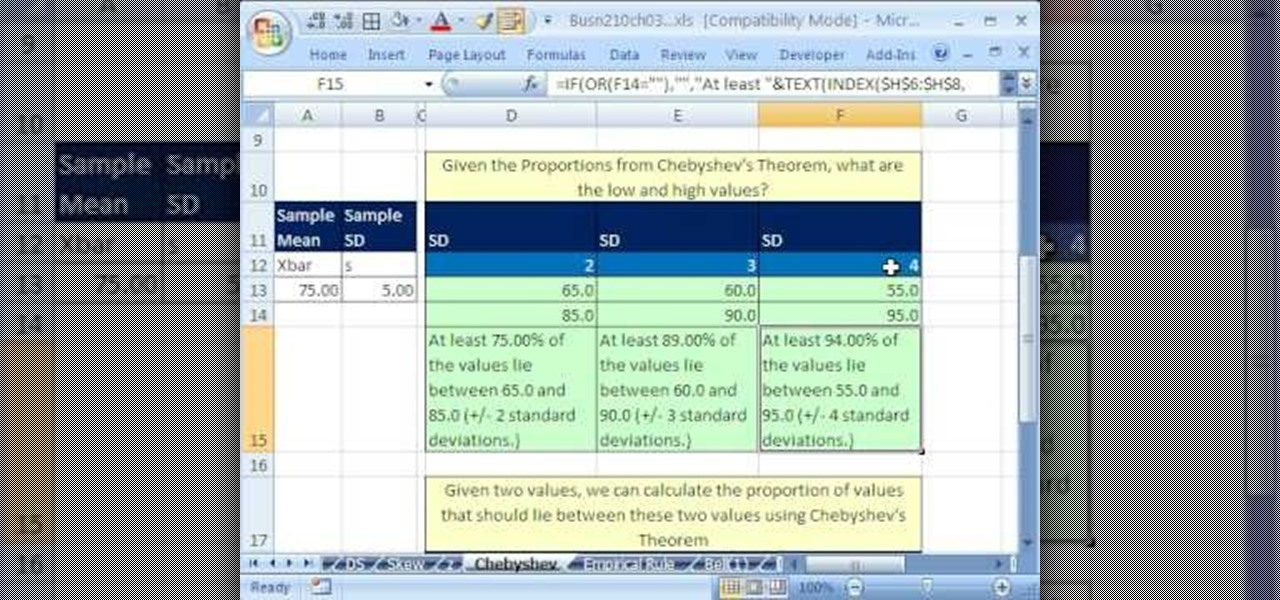
If you use Microsoft Excel on a regular basis, odds are you work with numbers. Put those numbers to work. Statistical analysis allows you to find patterns, trends and probabilities within your data. In this MS Excel tutorial from everyone's favorite Excel guru, YouTube's ExcelsFun, the 46th installment in his "Excel Statistics" series of free video lessons, you'll learn about Chebyshev's Theorem and how to apply it in three different ways.

If you use Microsoft Excel on a regular basis, odds are you work with numbers. Put those numbers to work. Statistical analysis allows you to find patterns, trends and probabilities within your data. In this MS Excel tutorial from everyone's favorite Excel guru, YouTube's ExcelsFun, the 42nd installment in his "Excel Statistics" series of free video lessons, you'll learn how to calculate the coefficient of variation.

If you use Microsoft Excel on a regular basis, odds are you work with numbers. Put those numbers to work. Statistical analysis allows you to find patterns, trends and probabilities within your data. In this MS Excel tutorial from everyone's favorite Excel guru, YouTube's ExcelsFun, the 30th installment in his "Excel Statistics" series of free video lessons, you'll learn how to create a scatter diagram for 2 quantitative variables.
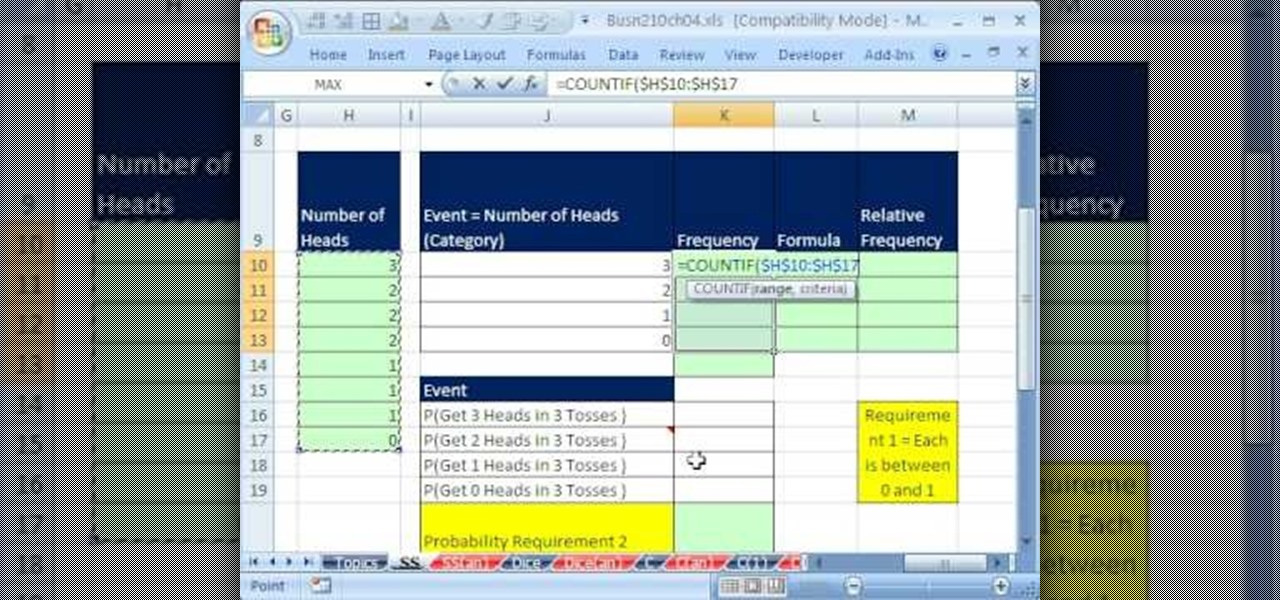
If you use Microsoft Excel on a regular basis, odds are you work with numbers. Put those numbers to work. Statistical analysis allows you to find patterns, trends and probabilities within your data. In this MS Excel tutorial from everyone's favorite Excel guru, YouTube's ExcelsFun, the 51st installment in his "Excel Statistics" series of free video lessons, you'll learn how to understand, work with and find simple probabilities in Microsoft Office Excel.
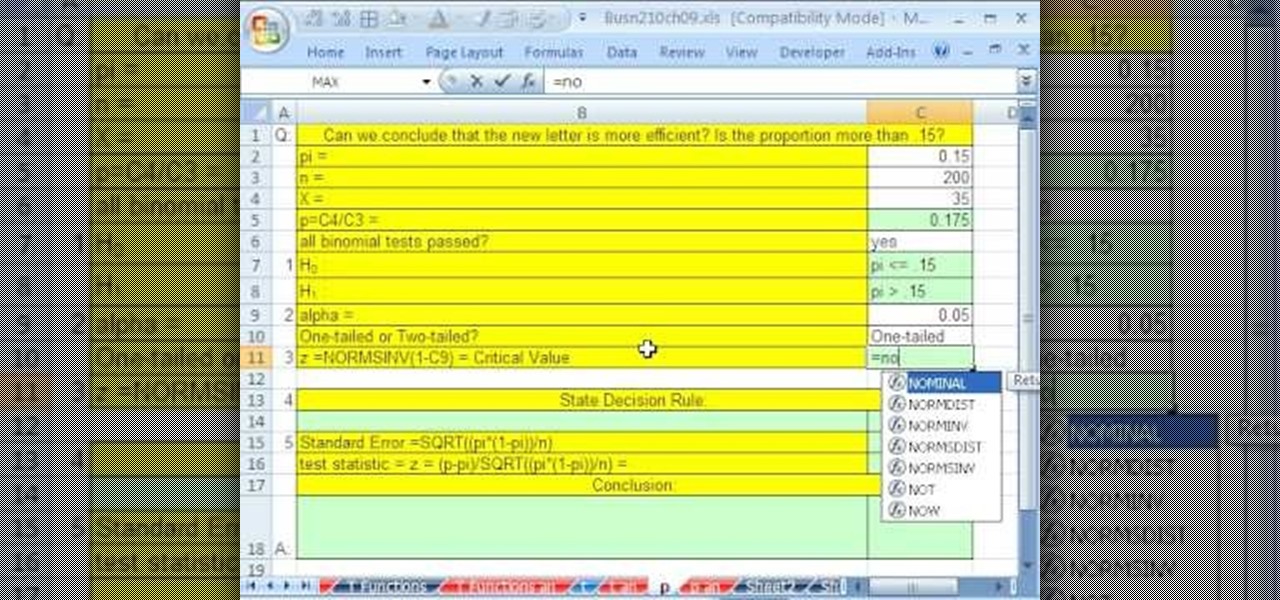
If you use Microsoft Excel on a regular basis, odds are you work with numbers. Put those numbers to work. Statistical analysis allows you to find patterns, trends and probabilities within your data. In this MS Excel tutorial from everyone's favorite Excel guru, YouTube's ExcelsFun, the 93rd installment in his "Excel Statistics" series of free video lessons, you'll learn how to use the NORMSINV and NORMSDIST functions to complete a hypothesis test about a population proportion.

If you use Microsoft Excel on a regular basis, odds are you work with numbers. Put those numbers to work. Statistical analysis allows you to find patterns, trends and probabilities within your data. In this MS Excel tutorial from everyone's favorite Excel guru, YouTube's ExcelsFun, the 83rd installment in his "Excel Statistics" series of free video lessons, you'll learn how to construct confidence intervals when the sigma (population standard deviation) in NOT known using the TINV function.
If you use Microsoft Excel on a regular basis, odds are you work with numbers. Put those numbers to work. Statistical analysis allows you to find patterns, trends and probabilities within your data. In this MS Excel tutorial from everyone's favorite Excel guru, YouTube's ExcelsFun, the 29th installment in his "Excel Statistics" series of free video lessons, you'll learn how to create quantitative data cross tabulation using a pivot table (PivotTable).
If you use Microsoft Excel on a regular basis, odds are you work with numbers. Put those numbers to work. Statistical analysis allows you to find patterns, trends and probabilities within your data. In this MS Excel tutorial from everyone's favorite Excel guru, YouTube's ExcelsFun, the 11th installment in his "Excel Statistics" series of free video lessons, you'll learn how to work with, and create charts for, cross-sectional and time-series data.
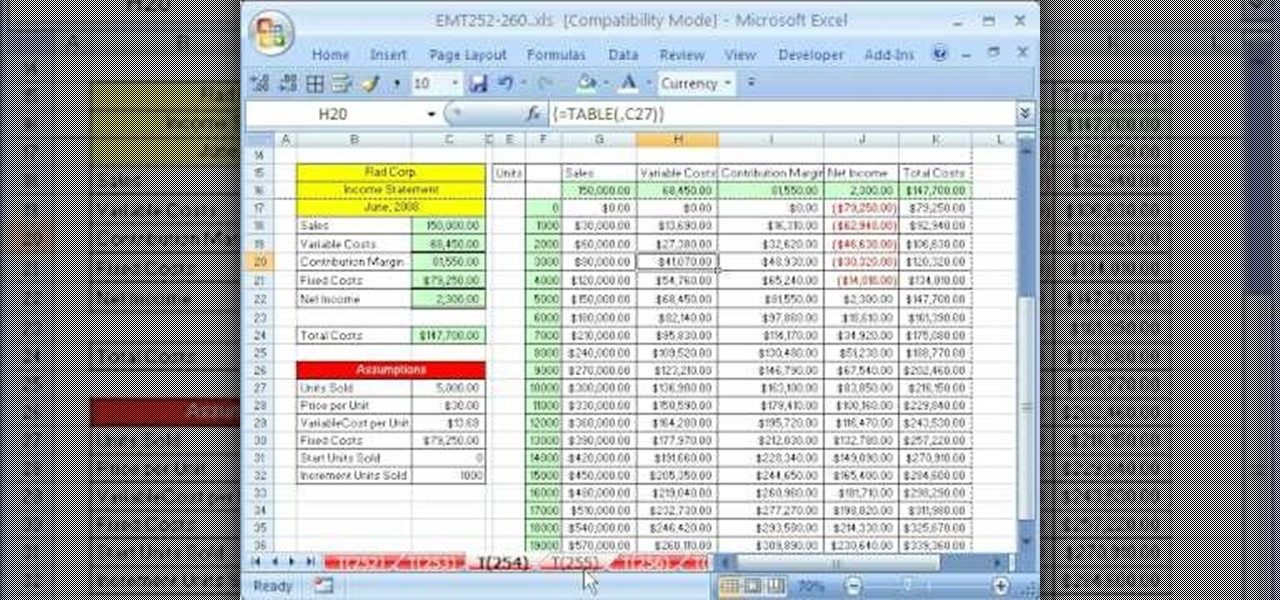
New to Microsoft Excel? Looking for a tip? How about a tip so mind-blowingly useful as to qualify as a magic trick? You're in luck. In this MS Excel tutorial from ExcelIsFun, the 254th installment in their series of digital spreadsheet magic tricks, you'll learn how to do contribution margin income statement analysis across various units using a one-variable data table.
Welcome to a tennis lesson from FuzzyYellowBalls, the the best place to learn how to play tennis online. Our free video tennis lessons teach you how to play the game in a new way that combines technical analysis, visual learning, and step-by-step progressions.
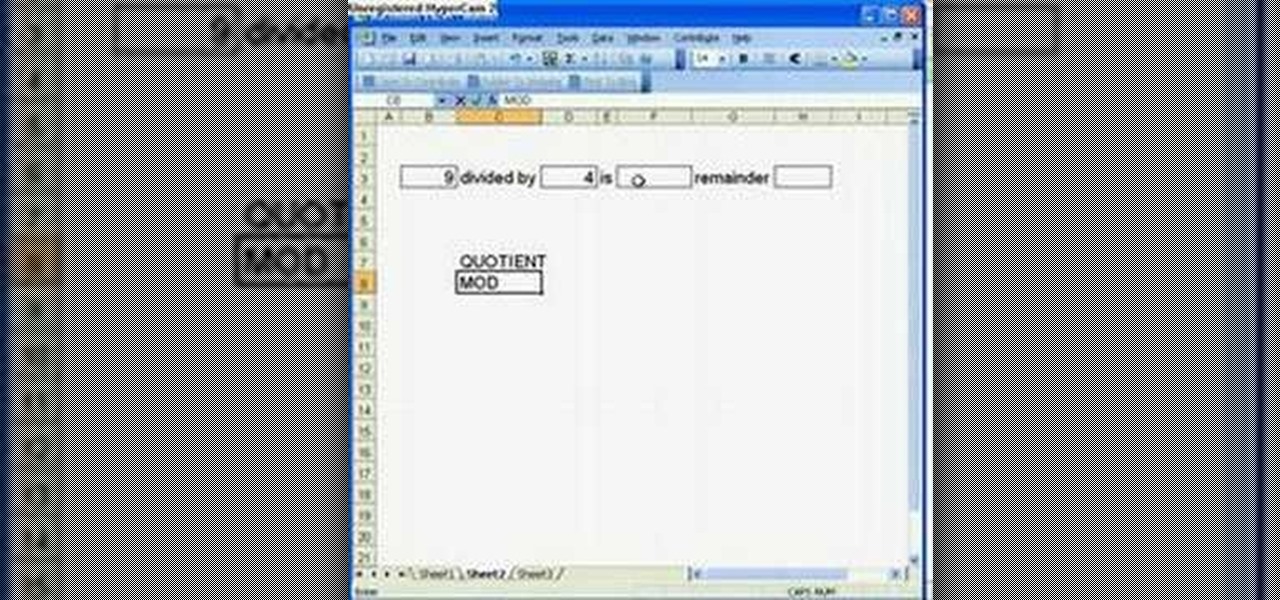
Microsoft Office Excel 2007 spreadsheet manager is a powerful tool that enables information workers to format spreadsheets, as well as analyze and share information to make more informed decisions. In this MS Excel video tutorial, you'll learn about the QUOTIENT and MOD functions. Note that, in urder to use these functions, you'll need to install the analysis ToolPak. For more information, watch this Excel how-to.
This video is a step-by-step analysis of each of the moves of the first bo kata, shu shi no kon, including what attack you are blocking and striking point on the opponent. A great way to learn these moves.
This video shows you how to perform timbei kata and gives an analysis (bunkai) of the timbei and rochin.
This video breaks down the kata, or form, utilizing the kama, the okinawan sickle. The second video gives an analysis (bunkai) of the kata. An excellent series that makes it easy to learn from.
San-cho zai is kata with three sai. This two part video shows you how to perform san-cho zai and then gives a more detailed explaination or analysis (called bunkai).
This video gives an analysis of second bo kata, cho un no kon and shows you how it is executed.
This video gives an analysis of strikes and blocks from the more advanced hojo-undo (but still the basics prior to a kata).
The recent announcement of a $480 million US Army contract awarded to Microsoft over Magic Leap for supplying 100,000 augmented reality headsets shows just a how lucrative the enterprise (and government) sector can be for AR.
The rumor that the iPhone 8 will ship with 3D camera system is not a new one, but a new analysis by Morgan Stanley's Charlie Chan lends credibility to the speculation. Now, it appears more likely than ever that Apple's next iPhone will ship with 3D capabilities, increasing potential for AR and VR integration in the future.
Data makes the world go round. It has gotten to the point that it's considered the most valuable resource, perhaps even more important than oil. Businesses use data to collect critical information about their users and improve their services; governments utilize it to improve things like public transportation; doctors analyze data to find more ways to save lives.
Onshore, or on a boat, have you ever wondered what swims below in the dark water? Using standard equipment and a new process, marine scientists can now get a good look at what is swimming by—just by analyzing the water.
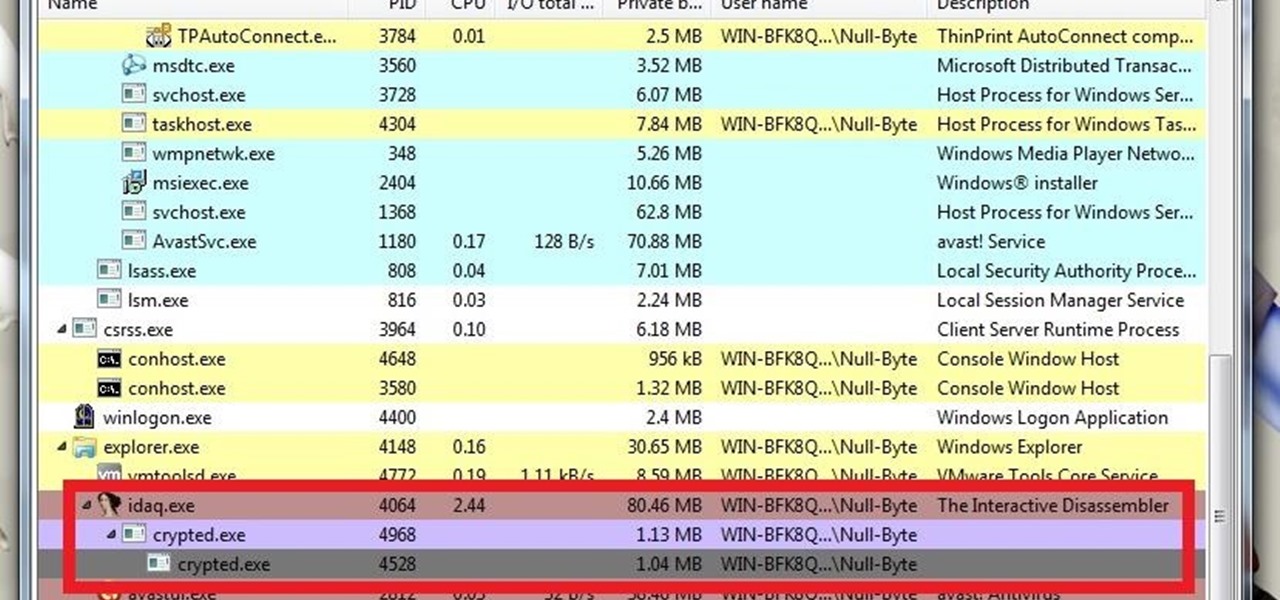
What's up guys? Welcome to a sort of general walkthrough on how one might approach a reversing and analysis on a crypted malware. This is by no means a universal technique so don't assume that this will occur in every scenario, it's more of a demonstration than anything really.
Welcome back, my budding hackers! One of the most basic skills the forensic investigator must master is the acquisition of data in a forensically sound manner. If data is not captured in a forensically sound manner, it may not be admissible in court. In my Kali Forensics series, I showed you how to acquire a forensically sound, bit-by-bit image of a storage device such as a hard drive or flash drive, but now let's dive into live memory.
Have you ever found something in your suitcase that wasn't yours? Maybe it was, but you're almost certain it wasn't. Maybe a friend slipped something in your baggage before your departure flight? Maybe the TSA was playing a joke on you, since they have all the master keys for your approved travel locks?
If you use Microsoft Excel on a regular basis, odds are you work with numbers. Put those numbers to work. Statistical analysis allows you to find patterns, trends and probabilities within your data. In this MS Excel tutorial from everyone's favorite Excel guru, YouTube's ExcelsFun, the 92nd installment in his "Excel Statistics" series of free video lessons, you'll learn how to use the TINV and TDIST functions to test a hypothesis.
If you use Microsoft Excel on a regular basis, odds are you work with numbers. Put those numbers to work. Statistical analysis allows you to find patterns, trends and probabilities within your data. In this MS Excel tutorial from everyone's favorite Excel guru, YouTube's ExcelsFun, the 85th installment in his "Excel Statistics" series of free video lessons, you'll learn how to construct confidence intervals for proportions using NORMSINV function and other formulas.
An intensive analysis of the "blue third," a quarter-tone that lies somewhere between the major and minor third and is a key constituent of the blues scale that all harmonica players must master. With Satan & Adam harpist Adam Gussow.
Learn how to play "Departure" from the anime series Rurouni Kenshin or Samurai X on the piano or keyboard. This piano lesson is split up into two parts. In the first part
New to Excel? Looking for a tip? How about a tip so mind-blowingly useful as to qualify as a magic trick? You're in luck. In this Excel tutorial from ExcelIsFun, the 237th installment in their series of digital spreadsheet magic tricks, you'll learn how to
Making trance music has been the point of departure for most of the world's great DJ's, and your career need be no different. If you want to start making your own trance tracks, watch this video. It will teach you how to do it in great detail using Reason 4.
If you use Microsoft Excel on a regular basis, odds are you work with numbers. Put those numbers to work. Statistical analysis allows you to find patterns, trends and probabilities within your data. In this MS Excel tutorial from everyone's favorite Excel guru, YouTube's ExcelsFun, the 24th installment in his "Excel Statistics" series of free video lessons, you'll learn how to create quantitative data frequency distributions with pivot tables. See how to create the correct unambiguous labels ...
If you use Microsoft Excel on a regular basis, odds are you work with numbers. Put those numbers to work. Statistical analysis allows you to find patterns, trends and probabilities within your data. In this MS Excel tutorial from everyone's favorite Excel guru, YouTube's ExcelsFun, the 12th installment in his "Excel Statistics" series of free video lessons, you'll learn how to use Advanced Filter 'Unique Records Only" to extract a list of unique items from a data base, and then use the COUNTI...
Welcome to a tennis lesson from FuzzyYellowBalls, the the best place to learn how to play tennis online. Our free video tennis lessons teach you how to play the game in a new way that combines technical analysis, visual learning, and step-by-step progressions.
Welcome to a tennis lesson from FuzzyYellowBalls, the the best place to learn how to play tennis online. Our free video tennis lessons teach you how to play the game in a new way that combines technical analysis, visual learning, and step-by-step progressions.
Welcome to a tennis lesson from FuzzyYellowBalls, the the best place to learn how to play tennis online. Our free video tennis lessons teach you how to play the game in a new way that combines technical analysis, visual learning, and step-by-step progressions.
Welcome to a tennis lesson from FuzzyYellowBalls, the the best place to learn how to play tennis online. Our free video tennis lessons teach you how to play the game in a new way that combines technical analysis, visual learning, and step-by-step progressions.
Welcome to a tennis lesson from FuzzyYellowBalls, the the best place to learn how to play tennis online. Our free video tennis lessons teach you how to play the game in a new way that combines technical analysis, visual learning, and step-by-step progressions.
Welcome to a tennis lesson from FuzzyYellowBalls, the the best place to learn how to play tennis online. Our free video tennis lessons teach you how to play the game in a new way that combines technical analysis, visual learning, and step-by-step progressions.
Welcome to a tennis lesson from FuzzyYellowBalls, the the best place to learn how to play tennis online. Our free video tennis lessons teach you how to play the game in a new way that combines technical analysis, visual learning, and step-by-step progressions.