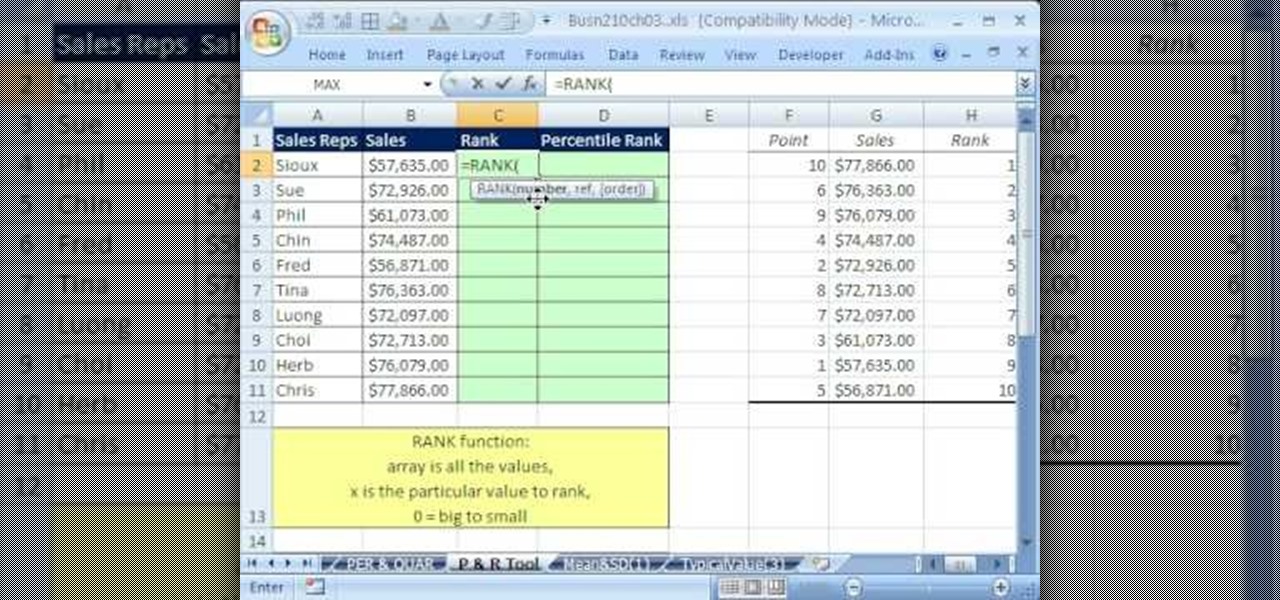
If you use Microsoft Excel on a regular basis, odds are you work with numbers. Put those numbers to work. Statistical analysis allows you to find patterns, trends and probabilities within your data. In this MS Excel tutorial from everyone's favorite Excel guru, YouTube's ExcelsFun, the 38th installment in his "Excel Statistics" series of free video lessons, you'll learn how to use the RANK and PERCENTRANK functions as well as the Data Analysis add-in's Rank & Percentile tools.

"I was wondering if you could take the triad Harmonic Analysis lesson you had done a step further and cover the concept of Transposing chord progressions into other keys?" Before you begin you do have to know some background information about your key signatures, knowing major, minor and diminished steps in triad analysis, and seventh chord harmony. The idea of transposing is that your take a set of notes and change they key it is originally played in. Andrew will walk you through all the ste...

This video is based on a chemistry experiment. This video is going to explain to us how to use gravimetric analysis in order to analyze sulfuric acid. This experiment should not be done for those who do not have a fundamental knowledge of chemical compounds, reactions and chemical safety. He explains first what he is about to do before he does it. Sulfuric acid is acidic and can be toxic if ingested or in contact with the eyes. Take extreme care with this experiment.

All of the the tech industry giants, including Apple, Facebook, and Google, are working on new smartglasses and/or AR headsets, but this week, Google took a major step forward with gesture recognition technology that could make its way into AR wearables, posing a threat to Leap Motion and its hand-tracking controllers.

Now that the Magic Leap One is out in the real world, the mystery behind the company lies not in whether it will actually ship a product, but when it will ship a consumer product. Or, does CEO Rony Abovitz steer the company in a different direction first?

This chess tutorial from Grandmaster Alexandra Kosteniuk is a perfect example of Retrograde Analysis.

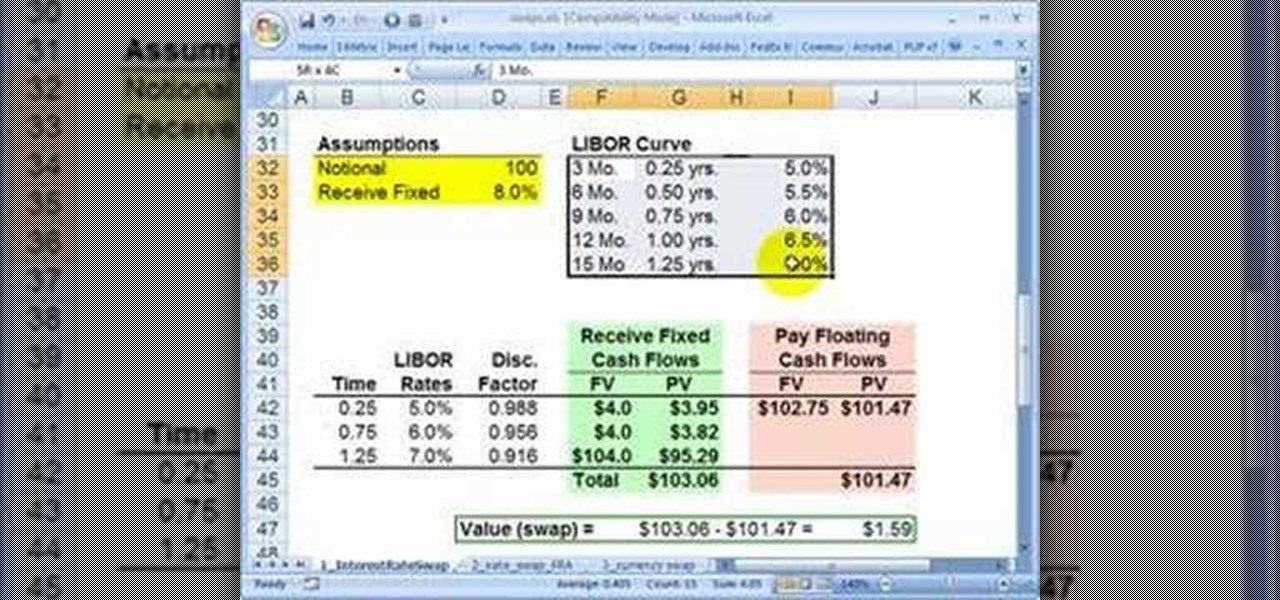
High finance and statistical analysis are too complex for most people once they forget what they learned in high school. If you are an investor or small business owner, you can't afford to forget this stuff. This video will teach you how to value an interest rate swap, good info for financial professionals and students.
If you use Microsoft Excel on a regular basis, odds are you work with numbers. Put those numbers to work. Statistical analysis allows you to find patterns, trends and probabilities within your data. In this MS Excel tutorial from everyone's favorite Excel guru, YouTube's ExcelsFun, the 45th installment in his "Excel Statistics" series of free video lessons, you'll learn how to see how to calculate a z-score.
If you use Microsoft Excel on a regular basis, odds are you work with numbers. Put those numbers to work. Statistical analysis allows you to find patterns, trends and probabilities within your data. In this MS Excel tutorial from everyone's favorite Excel guru, YouTube's ExcelsFun, the 35.2nd installment in his "Excel Statistics" series of free video lessons, you'll learn how to use Excel's GEOMEAN function to find geometric mean.
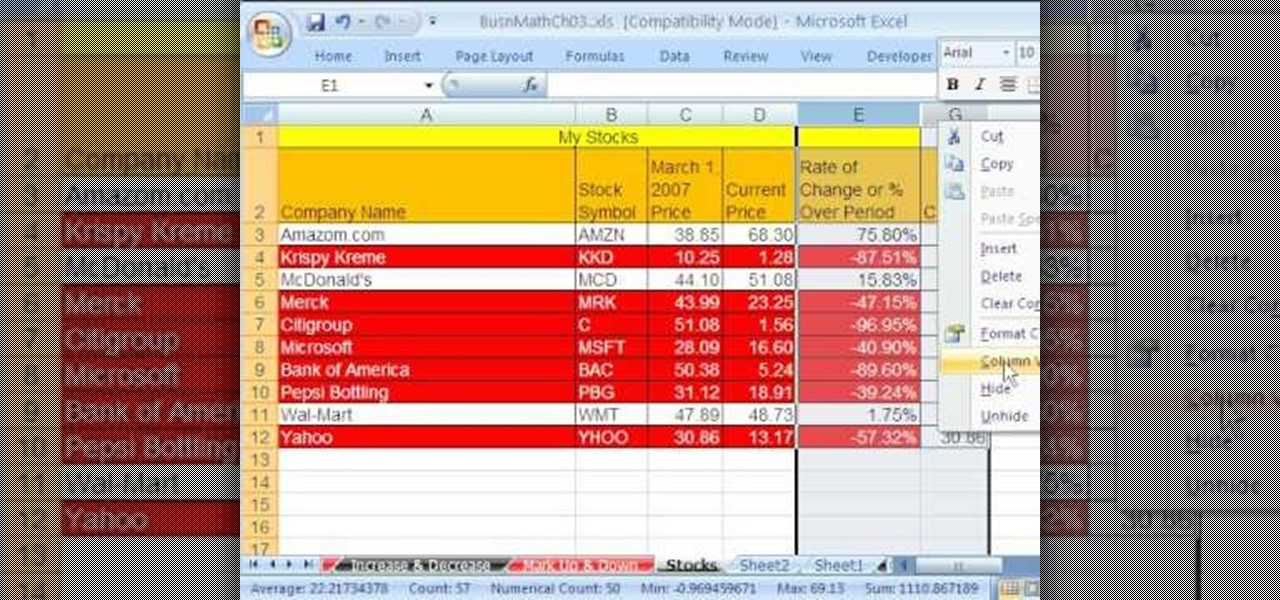
As you might guess, one of the domains in which Microsoft Excel really excels is business math. Brush up on the stuff for your next or current job with this how-to. In this tutorial from everyone's favorite digital spreadsheet guru, YouTube's ExcelIsFun, the 33rd installment in his "Excel Business Math" series of free video lessons, you'll learn how to add current stock prices to a stock analysis table in Excel using a web query.
If you use Microsoft Excel on a regular basis, odds are you work with numbers. Put those numbers to work. Statistical analysis allows you to find patterns, trends and probabilities within your data. In this MS Excel tutorial from everyone's favorite Excel guru, YouTube's ExcelsFun, the 40th installment in his "Excel Statistics" series of free video lessons, you'll learn how to calculate range & interquartile range for variability using the MAX, MIN, QUARTILE functions.
If you use Microsoft Excel on a regular basis, odds are you work with numbers. Put those numbers to work. Statistical analysis allows you to find patterns, trends and probabilities within your data. In this MS Excel tutorial from everyone's favorite Excel guru, YouTube's ExcelsFun, the 86th installment in his "Excel Statistics" series of free video lessons, you'll learn how to construct confidence intervals for proportions using NORMSINV function and other formulas.
If you use Microsoft Excel on a regular basis, odds are you work with numbers. Put those numbers to work. Statistical analysis allows you to find patterns, trends and probabilities within your data. In this MS Excel tutorial from everyone's favorite Excel guru, YouTube's ExcelsFun, the 87th installment in his "Excel Statistics" series of free video lessons, you'll learn how to calculate sample size (n) for confidence intervals.
If you use Microsoft Excel on a regular basis, odds are you work with numbers. Put those numbers to work. Statistical analysis allows you to find patterns, trends and probabilities within your data. In this MS Excel tutorial from everyone's favorite Excel guru, YouTube's ExcelsFun, the 27th installment in his "Excel Statistics" series of free video lessons, you'll learn how to create a quantitative data dot plot chart using the REPT and COUNTIF functions.
If you use Microsoft Excel on a regular basis, odds are you work with numbers. Put those numbers to work. Statistical analysis allows you to find patterns, trends and probabilities within your data. In this MS Excel tutorial from everyone's favorite Excel guru, YouTube's ExcelsFun, the 26th installment in his "Excel Statistics" series of free video lessons, you'll learn how to create quantitative data cumulative frequency distributions with pivot tables.
If you use Microsoft Excel on a regular basis, odds are you work with numbers. Put those numbers to work. Statistical analysis allows you to find patterns, trends and probabilities within your data. In this MS Excel tutorial from everyone's favorite Excel guru, YouTube's ExcelsFun, the 16th installment in his "Excel Statistics" series of free video lessons, you'll learn how to cross tabulate & do percentage cross tabulation for categorical data using a pivot table (PivotTable).
If you use Microsoft Excel on a regular basis, odds are you work with numbers. Put those numbers to work. Statistical analysis allows you to find patterns, trends and probabilities within your data. In this MS Excel tutorial from everyone's favorite Excel guru, YouTube's ExcelsFun, the 19th installment in his "Excel Statistics" series of free video lessons, you'll learn how to group categories in a frequency distribution with a formula (2 COUNTIF) and the pivot table (PivotTable) grouping fea...
If you use Microsoft Excel on a regular basis, odds are you work with numbers. Put those numbers to work. Statistical analysis allows you to find patterns, trends and probabilities within your data. In this MS Excel tutorial from everyone's favorite Excel guru, YouTube's ExcelsFun, the 17th installment in his "Excel Statistics" series of free video lessons, you'll learn how to cross tabulate & do percentage cross tabulation for categorical data using formulas rather than pivot tables.
If you use Microsoft Excel on a regular basis, odds are you work with numbers. Put those numbers to work. Statistical analysis allows you to find patterns, trends and probabilities within your data. In this MS Excel tutorial from everyone's favorite Excel guru, YouTube's ExcelsFun, the 35th installment in his "Excel Statistics" series of free video lessons, you'll learn how to calculate weighted and geometric means and see how to use the GEOMEAN function.
If you use Microsoft Excel on a regular basis, odds are you work with numbers. Put those numbers to work. Statistical analysis allows you to find patterns, trends and probabilities within your data. In this MS Excel tutorial from everyone's favorite Excel guru, YouTube's ExcelsFun, the 33rd installment in his "Excel Statistics" series of free video lessons, you'll learn how to use the AVEARGE, MEDIAN, MODE, PERCENTILE, QUARTILE and PERCENTILERANK functions to measure location.
If you use Microsoft Excel on a regular basis, odds are you work with numbers. Put those numbers to work. Statistical analysis allows you to find patterns, trends and probabilities within your data. In this MS Excel tutorial from everyone's favorite Excel guru, YouTube's ExcelsFun, the 4th installment in his "Excel Statistics" series of free video lessons, you'll learn how to create a frequency table and percentage frequency table using a Pivot Table (PivotTable).
Welcome to a tennis lesson from FuzzyYellowBalls, the the best place to learn how to play tennis online. Our free video tennis lessons teach you how to play the game in a new way that combines technical analysis, visual learning, and step-by-step progressions.
Welcome to a tennis lesson from FuzzyYellowBalls, the the best place to learn how to play tennis online. Our free video tennis lessons teach you how to play the game in a new way that combines technical analysis, visual learning, and step-by-step progressions.
This tutorial goes over how to perform ni-cho zai. This kata utilizes 2 zai (sais), and the video includes the bunkai, or step-by-step analysis.
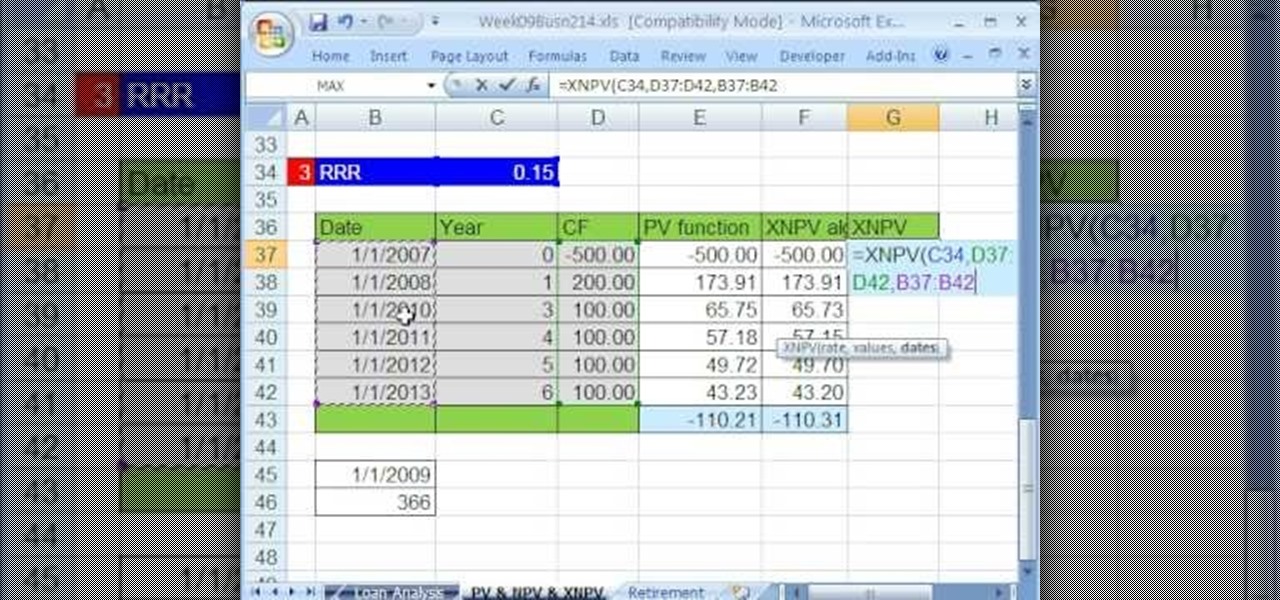
Whether you're interested in learning Microsoft Excel from the bottom up or just looking to pick up a few tips and tricks, you're in the right place. In this tutorial from everyone's favorite digital spreadsheet guru, ExcelIsFun, the 50th installment in his "Highline Excel Class" series of free video Excel lessons, you'll learn how to value an asset as well as perform discounted cash flow analysis with the Excel functions PV, NPV & XNPV.
If you use Microsoft Excel on a regular basis, odds are you work with numbers. Put those numbers to work. Statistical analysis allows you to find patterns, trends and probabilities within your data. In this MS Excel tutorial from everyone's favorite Excel guru, YouTube's ExcelsFun, the 44th installment in his "Excel Statistics" series of free video lessons, you'll learn how to use the SKEW function to calculate the skew in a distribution of data.
f you use Microsoft Excel on a regular basis, odds are you work with numbers. Put those numbers to work. Statistical analysis allows you to find patterns, trends and probabilities within your data. In this MS Excel tutorial from everyone's favorite Excel guru, YouTube's ExcelsFun, the 37th installment in his "Excel Statistics" series of free video lessons, you'll learn how to use the PERCENTILE and QUARTILE functions.
If you use Microsoft Excel on a regular basis, odds are you work with numbers. Put those numbers to work. Statistical analysis allows you to find patterns, trends and probabilities within your data. In this MS Excel tutorial from everyone's favorite Excel guru, YouTube's ExcelsFun, the 47th installment in his "Excel Statistics" series of free video lessons, you'll learn about the basics of the empirical rule (the bell curve) and how to apply it in various ways.
If you use Microsoft Excel on a regular basis, odds are you work with numbers. Put those numbers to work. Statistical analysis allows you to find patterns, trends and probabilities within your data. In this MS Excel tutorial from everyone's favorite Excel guru, YouTube's ExcelsFun, the 89th installment in his "Excel Statistics" series of free video lessons, you'll learn how to use the NORMSINV function for critical values and the NORSDIST function for p-values.
If you use Microsoft Excel on a regular basis, odds are you work with numbers. Put those numbers to work. Statistical analysis allows you to find patterns, trends and probabilities within your data. In this MS Excel tutorial from everyone's favorite Excel guru, YouTube's ExcelsFun, the 91st installment in his "Excel Statistics" series of free video lessons, you'll learn how to use TINV and TDIST functions to find critical values given an unknown sigma value.
If you use Microsoft Excel on a regular basis, odds are you work with numbers. Put those numbers to work. Statistical analysis allows you to find patterns, trends and probabilities within your data. In this MS Excel tutorial from everyone's favorite Excel guru, YouTube's ExcelsFun, the 80th installment in his "Excel Statistics" series of free video lessons, you'll learn how to construct confidence intervals when the sigma is known known using the CONFIDENCE and NORMSINV functions.
If you use Microsoft Excel on a regular basis, odds are you work with numbers. Put those numbers to work. Statistical analysis allows you to find patterns, trends and probabilities within your data. In this MS Excel tutorial from everyone's favorite Excel guru, YouTube's ExcelsFun, the 21st installment in his "Excel Statistics" series of free video lessons, you'll learn how to build labels and counting formulas for a frequency distribution.
If you use Microsoft Excel on a regular basis, odds are you work with numbers. Put those numbers to work. Statistical analysis allows you to find patterns, trends and probabilities within your data. In this MS Excel tutorial from everyone's favorite Excel guru, YouTube's ExcelsFun, the 87th installment in his "Excel Statistics" series of free video lessons, you'll learn how to use NORMSINV to test a hypothesis with population standard deviation (sigma) known and proportions.
If you use Microsoft Excel on a regular basis, odds are you work with numbers. Put those numbers to work. Statistical analysis allows you to find patterns, trends and probabilities within your data. In this MS Excel tutorial from everyone's favorite Excel guru, YouTube's ExcelsFun, the 28th installment in his "Excel Statistics" series of free video lessons, you'll learn how to create quantitative data stem & leaf charts using the REPT and COUNTIF functions.
If you use Microsoft Excel on a regular basis, odds are you work with numbers. Put those numbers to work. Statistical analysis allows you to find patterns, trends and probabilities within your data. In this MS Excel tutorial from everyone's favorite Excel guru, YouTube's ExcelsFun, the 13th installment in his "Excel Statistics" series of free video lessons, you'll learn how to create a column chart from a frequency distribution for categorical data.
If you use Microsoft Excel on a regular basis, odds are you work with numbers. Put those numbers to work. Statistical analysis allows you to find patterns, trends and probabilities within your data. In this MS Excel tutorial from everyone's favorite Excel guru, YouTube's ExcelsFun, the 5th installment in his "Excel Statistics" series of free video lessons, you'll learn how to use relative and absolute cell references to save time when writing formulas.
Need some help improving your golf game? Ever hear of stack and tilt? Want to learn what all the fuss is about? Check out Brady Riggs’ analysis of Eric Axley’s full swing and find out about the “stack & tilt” technique. See exactly how to do this golf move for a better golf swing.
The Nessus vulnerability scanner, is the world-leader in active scanners, featuring high speed discovery, configuration auditing, asset profiling, sensitive data discovery and vulnerability analysis of your security posture. Nessus scanners can be distributed throughout an entire enterprise, inside DMZs, and across physically separate networks. In this network security video tutorial, you'll learn how to hack a network using Nessus 3.
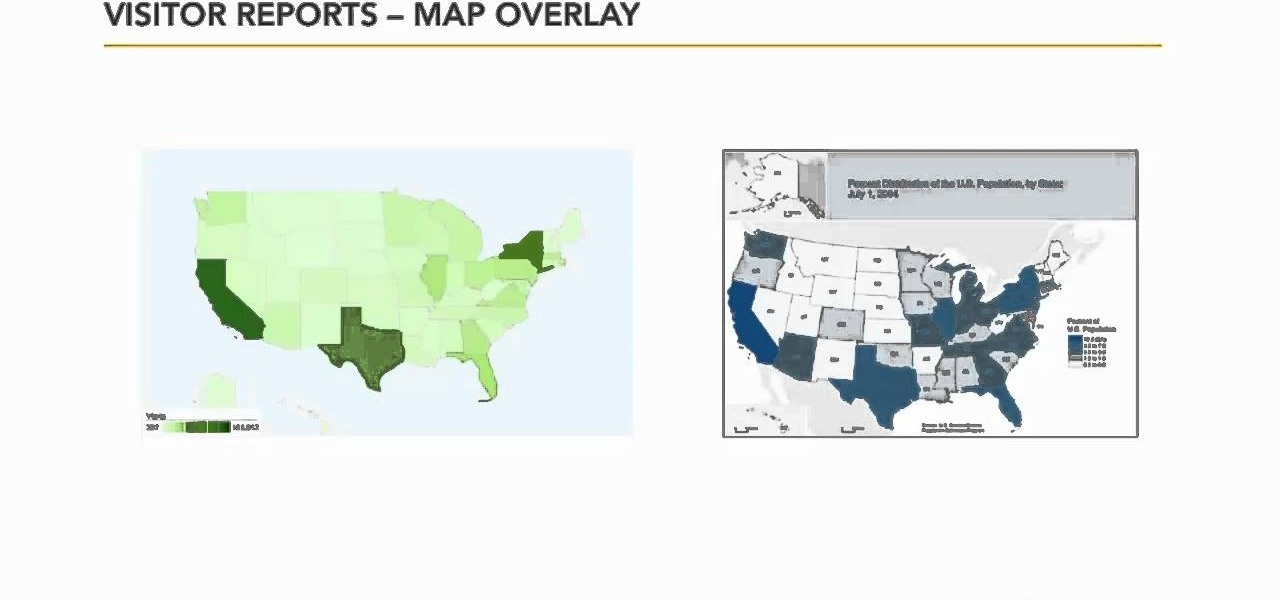
In this video tutorial, we learn how to use the Map Overlay feature when using the Google Analytics web tracking service. Whether you're new to Google's popular web analytics platform or a seasoned pro merely looking to pick up a few new tips and tricks, you're sure to be well served by this free video tutorial from Lynda.
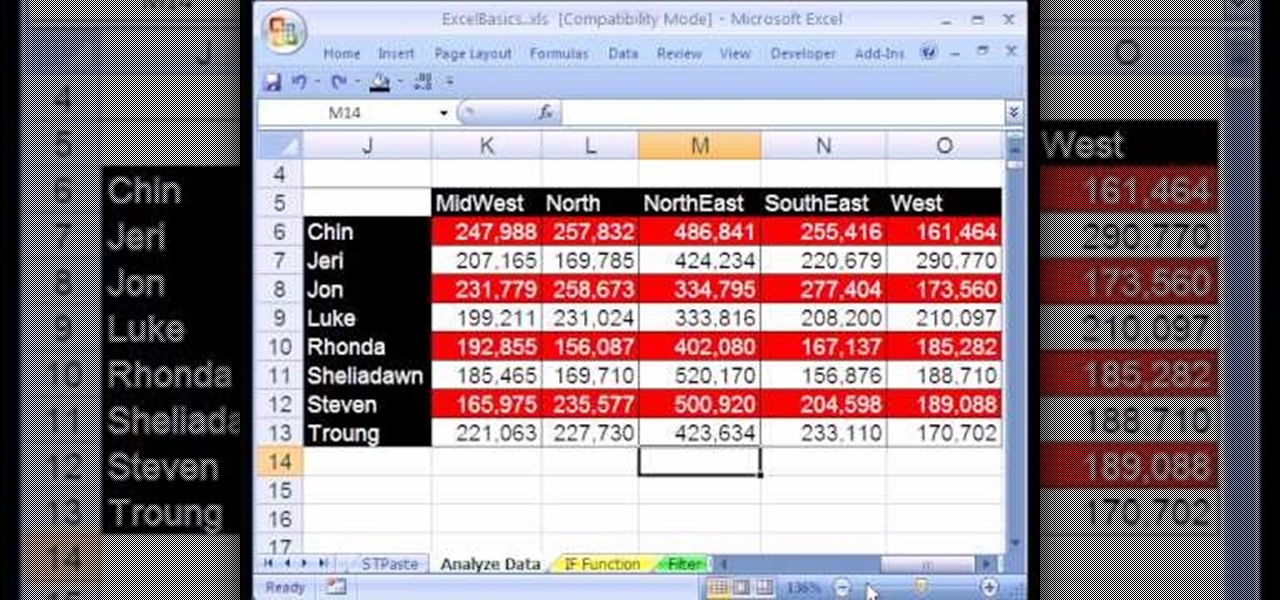
If you're looking to learn how to use Microsoft Excel, a video series from digital spreadsheet guru ExcelIsFun is a great place to start. But which of his many series should you choose? The one titled "Excel Basics," that's which! In this free video MS Excel lesson, the 20th installment in said basics series, you'll learn how to use pivot tables (PivotTables) to analyze and summarize data.