With winter in full swing, it's time to bring the scarves out of the closet. The trend this year is the tube scarf or infinity scarf, and here is how you can take a scarf you already have and update it to this style.

"Scene" bangs is just a fancy way of saying cool-looking, hipster bangs. You can't rock the hipster trend the way it was meant to be rocked if you only have the skinny jeans, loose organic cotton top, and bangles, right?

In this video, we learn how to convert numbers in and out of standard form. Standard form is a useful way of writing down very large numbers and very small numbers. To do this, you will look at the number you have and ignore the zeros that are just at the end. Then, write down the basic numbers. Put a decimal point in this number to make it between one and ten. Now, write down x 10 and put the power for how many places the decimal point moved to get to the new number. This will help you write...

Anyone in the world of makeup knows who Pat McGrath is. The world renowned makeup artist recently did the makeup for a catwalk for designer Roberto Caballi, and instead of taking the usual black smokey eyes look, she went for a new trend this season— BROWN! In this tutorial, you'll learn how to create a bold and beautiful brown smokey eyes look, great for the autumn and winter months.

Dolls may freak the rest of us out, but for a lot of girls in Japan looking like a doll - scarily large, beady eyes, perfect ringlets, and porcelain skin - is its own beauty and style trend.

Braids seem to be the latest Hollywood trend. Very rarely do you see boho stars like Nicole Richie, Blake Lively, Mary-Kate Olsen or Mischa Barton without at least one twisted strand in their hair.

Feeling a tad bored with your look? Get some fashion help from Emmy-nominated costume designer, Cate Adair, on how to dress like a young, hot Hollywood celebrity. Looking like a Hollywood celebrity involves taking fashion risks, such as mixing designer clothing with vintage pieces, wearing over-the-top accessories and bringing back old trends. Find ways to dress like a hot young star with tips found in this how-to video.
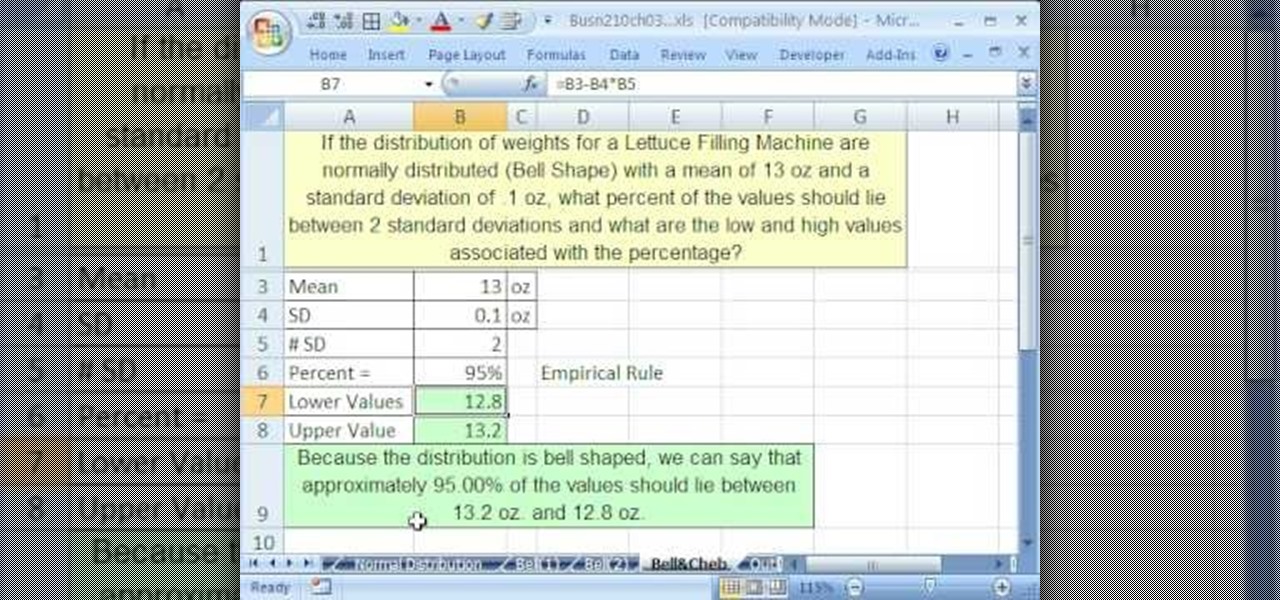
If you use Microsoft Excel on a regular basis, odds are you work with numbers. Put those numbers to work. Statistical analysis allows you to find patterns, trends and probabilities within your data. In this MS Excel tutorial from everyone's favorite Excel guru, YouTube's ExcelsFun, the 48th installment in his "Excel Statistics" series of free video lessons, you'll see comparison of Chebyshev's Theorem and the Empirical Rule (bell curve) and learn when to apply which.
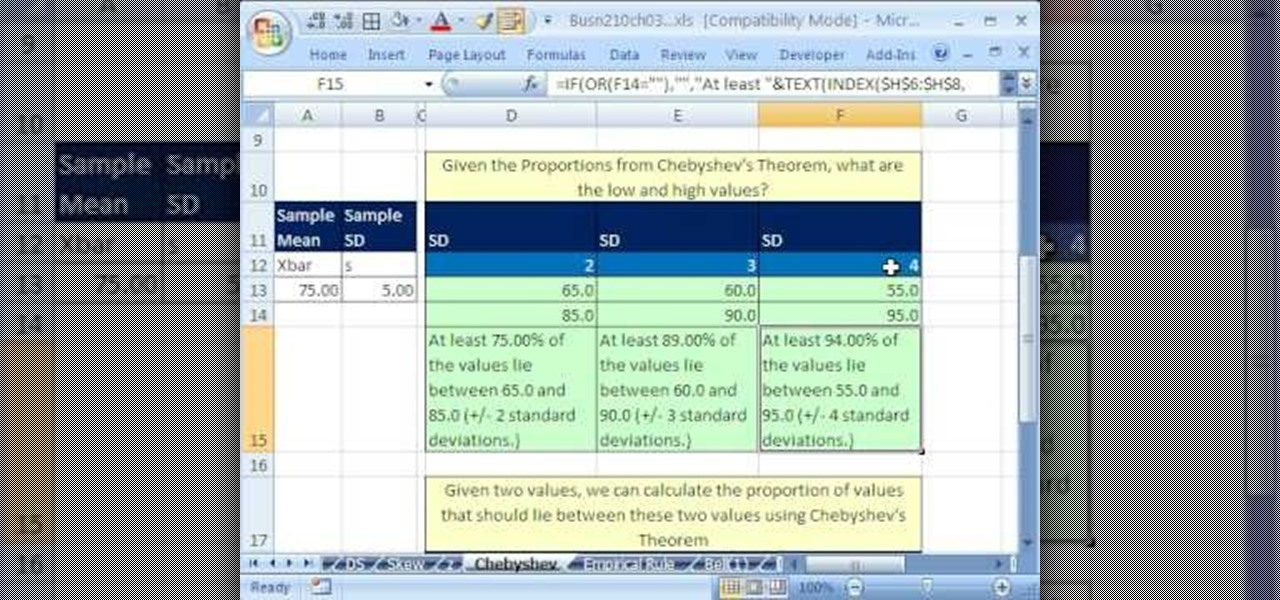
If you use Microsoft Excel on a regular basis, odds are you work with numbers. Put those numbers to work. Statistical analysis allows you to find patterns, trends and probabilities within your data. In this MS Excel tutorial from everyone's favorite Excel guru, YouTube's ExcelsFun, the 46th installment in his "Excel Statistics" series of free video lessons, you'll learn about Chebyshev's Theorem and how to apply it in three different ways.
If you use Microsoft Excel on a regular basis, odds are you work with numbers. Put those numbers to work. Statistical analysis allows you to find patterns, trends and probabilities within your data. In this MS Excel tutorial from everyone's favorite Excel guru, YouTube's ExcelsFun, the 43rd installment in his "Excel Statistics" series of free video lessons, you'll learn how to use the Excel Data Analysis add-in descriptive statistics tool.
If you use Microsoft Excel on a regular basis, odds are you work with numbers. Put those numbers to work. Statistical analysis allows you to find patterns, trends and probabilities within your data. In this MS Excel tutorial from everyone's favorite Excel guru, YouTube's ExcelsFun, the 42nd installment in his "Excel Statistics" series of free video lessons, you'll learn how to calculate the coefficient of variation.
If you use Microsoft Excel on a regular basis, odds are you work with numbers. Put those numbers to work. Statistical analysis allows you to find patterns, trends and probabilities within your data. In this MS Excel tutorial from everyone's favorite Excel guru, YouTube's ExcelsFun, the 30th installment in his "Excel Statistics" series of free video lessons, you'll learn how to create a scatter diagram for 2 quantitative variables.
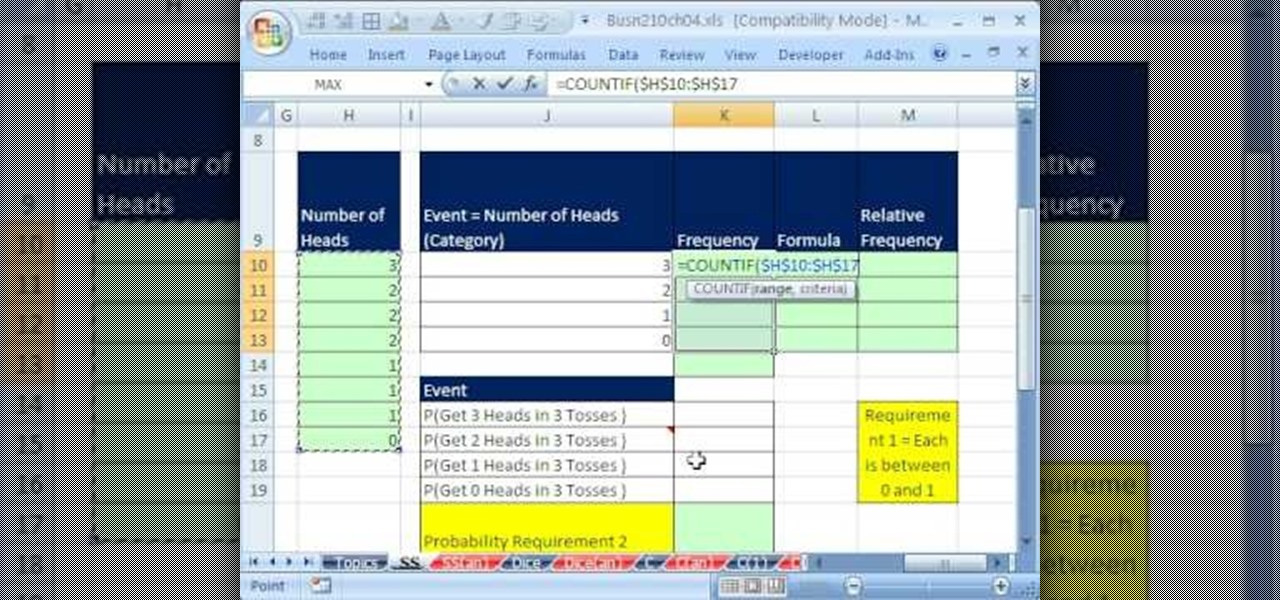
If you use Microsoft Excel on a regular basis, odds are you work with numbers. Put those numbers to work. Statistical analysis allows you to find patterns, trends and probabilities within your data. In this MS Excel tutorial from everyone's favorite Excel guru, YouTube's ExcelsFun, the 51st installment in his "Excel Statistics" series of free video lessons, you'll learn how to understand, work with and find simple probabilities in Microsoft Office Excel.
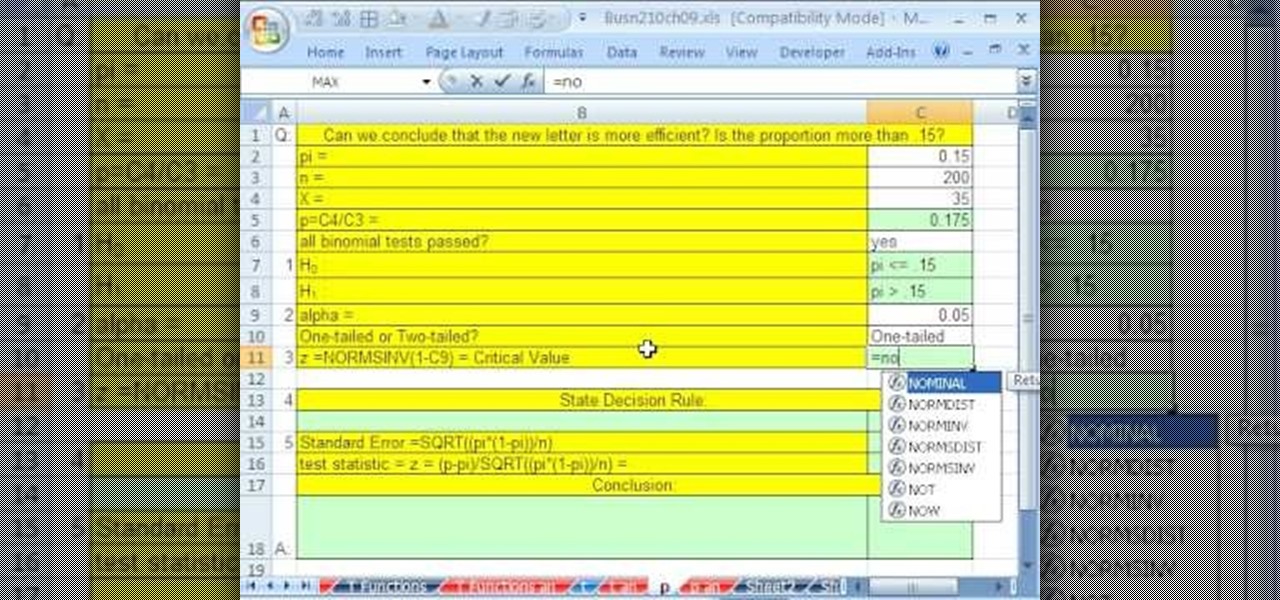
If you use Microsoft Excel on a regular basis, odds are you work with numbers. Put those numbers to work. Statistical analysis allows you to find patterns, trends and probabilities within your data. In this MS Excel tutorial from everyone's favorite Excel guru, YouTube's ExcelsFun, the 93rd installment in his "Excel Statistics" series of free video lessons, you'll learn how to use the NORMSINV and NORMSDIST functions to complete a hypothesis test about a population proportion.
If you use Microsoft Excel on a regular basis, odds are you work with numbers. Put those numbers to work. Statistical analysis allows you to find patterns, trends and probabilities within your data. In this MS Excel tutorial from everyone's favorite Excel guru, YouTube's ExcelsFun, the 29th installment in his "Excel Statistics" series of free video lessons, you'll learn how to create quantitative data cross tabulation using a pivot table (PivotTable).
If you use Microsoft Excel on a regular basis, odds are you work with numbers. Put those numbers to work. Statistical analysis allows you to find patterns, trends and probabilities within your data. In this MS Excel tutorial from everyone's favorite Excel guru, YouTube's ExcelsFun, the 11th installment in his "Excel Statistics" series of free video lessons, you'll learn how to work with, and create charts for, cross-sectional and time-series data.
If you use Microsoft Excel on a regular basis, odds are you work with numbers. Put those numbers to work. Statistical analysis allows you to find patterns, trends and probabilities within your data. In this MS Excel tutorial from everyone's favorite Excel guru, YouTube's ExcelsFun, the 13th installment in his "Excel Statistics" series of free video lessons, you'll learn how to install the Excel 2007 Data Analysis add-in.
Chances are if you've used a computer in the last decade or so, you've probably used Microsoft Office at some point. Activating Microsoft Office standard 2007 will give you access to functions you might not have even known existed that can increase your productivity and improve your work flow. This video will show you to activate Microsoft Office standard 2007.
Looking to find the standard deviation of your set of values? Standard deviation quantifies how diverse the values of your data set are, and is useful in determining how different your numbers are from each other.
The manicure look in this how-to video walks a line between toughness and polishing, mixing the trend of all black manicures and the classic French tip. All you need is black nail polish and a steady of hand. Learn how to do a french manicure with black tips by watching this video nail care tutorial.
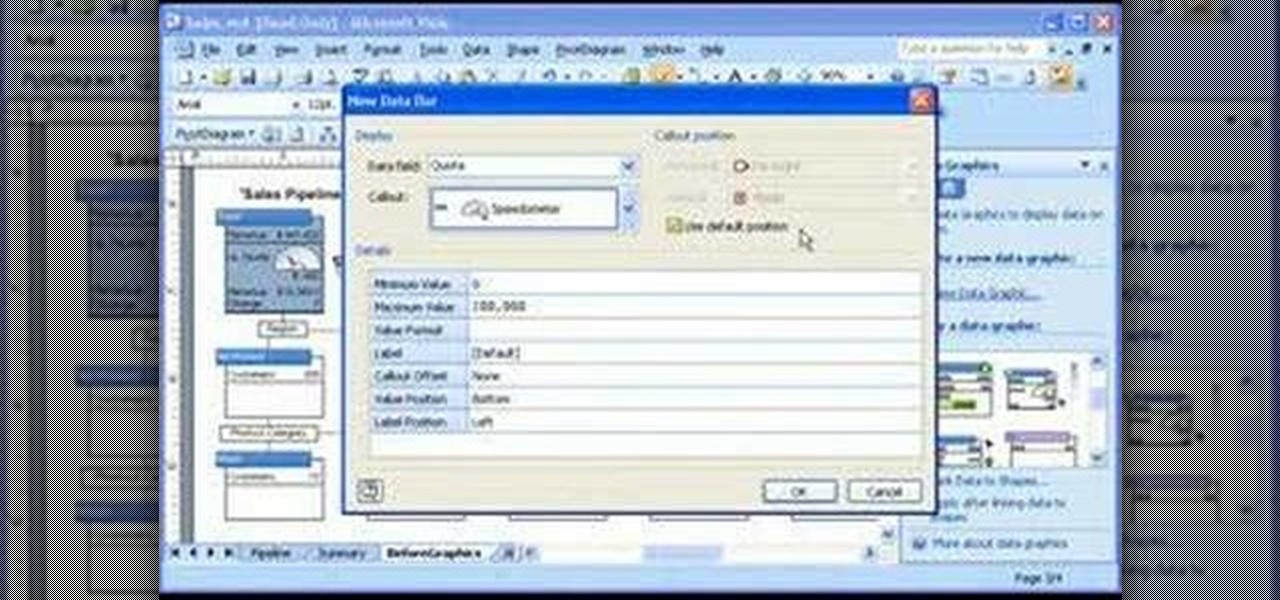
Take a look at this instructional video and learn how to customize progress meters, icons, color coding, and other graphical elements to emphasize sales trends, product performance, critical deadlines, or whatever information is contained in the data behind your diagram.
In this AeroCast episode, UND Aerospace discusses the Slow Flight maneuver as performed in the Piper Warrior (PA-28-161), referencing the procedures and standards outlined in the UND Warrior Standardization Manual. All performance tolerances are based on the performance standards set forth by the FAA Private Pilot Practical Test Standards. Since the most critical phases of flight occur at airspeeds less than cruise, a pilot must always be comfortable with his or her airplane’s handling charac...
In this AeroCast episode, Anthony Bottini discusses the Power On Stall maneuver as performed in the Piper Warrior (PA-28-161), referencing the procedures and standards outlined in the UND Aerospace Warrior Standardization Manual. All performance tolerances are based on the performance standards set forth by the FAA Private Pilot Practical Test Standards. Power On Stall practice is vital in increasing a pilot’s proficiency in regards to stall recognition and stall recovery techniques during an...
Over the course of the past century or so, media consumption has gone from a few readers enjoying their local print publication to billions of users viewing countless hours of video across the globe each day. This was a gradual evolution at first, but recent advancements in mobile connectivity have sent us into a climb the likes of which we have never seen before.
Welcome back, my budding hackers! In previous tutorials, we've looked at some of the basic commands and concepts for using Linux. Along the way, I realized that I've failed to provide you with some basic background material on the stdin, stdout, and stderror.
This is a video tutorial in the Education category where you are going to learn how to compare 2 distributions with the Z-Score formula. In this example Doug's class has X bar as 71 and a standard deviation of 4. Corey's class has X bar as 68 and a standard deviation of 11. If both Doug and Corey beat the class average and have the same standard score, will Doug have a lower grade than Corey? If both of them have a standard score of 1.5, then Doug will get 77 marks and Corey will get 84.5 mar...
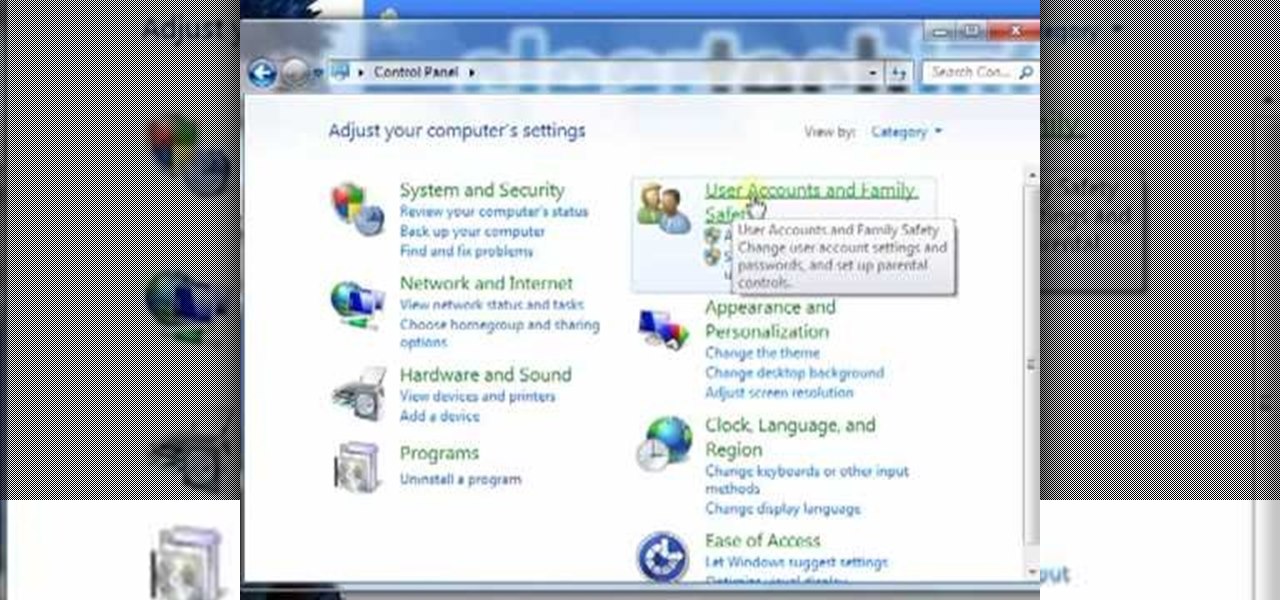
In this video tutorial, viewers learn how to create a new standard user and administrator account. Begin by clicking on the Start menu and select Control Panel. Then click on User Accounts and Family Safety and click on User Accounts. Now select the "Manage another account" option and click on "Create a new account". Users are able to name the account and select the account type (Standard or Administrator). Finish by clicking on Create Account. Users are then able to make changes to the accou...
In this video the tutor explains about the standard error of the mean. He starts explaining by drawing the diagram of a distribution and now he takes ten samples from the distribution and starts plotting them. He says that in theory if we do it infinite times then we can obtain the sampling distribution of the sampling mean. For the example he takes the number of samples as 10. Now depending on these values of n we can get different sampling distributions. Now he intends to find the mean of t...
Keith M. Bower explains the meaning of mean and standard deviation. This educational video gives insight in the basics of statistics. The relations between population mean and sample mean and between population standard deviation and sample standard deviation are explained. The mean gives an idea on the central tendency. Standard deviation gives an idea about how spread out the data are. Keith also explains how these two parameters, the joint sufficient statistics, define a normal distributio...
Learn how to do the standard skills in Fifa 09, it looks like every player in the game can do these. These are special tricks, but they are necessary if you want to play online or ever score. This includes a foot flick, slide tackle, 360 roulette and reverse stopovers.
There's nothing quite like getting lost in the TikTok void. While you'll likely never run into the same video twice, the same can't be said for popular sounds and fads. Some trends get so viral, it feels like you hear the same song or track every other TikTok. Just know this: you don't have to put up with any trend you're sick of.
The past year brought about a number of trends in the smartphone space. More immersive displays, better processors, and portrait mode for cameras come to mind as big steps forward. One of the most polarizing trends that continued in 2017 is the removal of the 3.5 mm headphone jack from flagship phones. The number of manufacturers that have completely dispensed with wired audio is staggering, so let's run down the full list!
Excel is great, and if you're a Mac user, Excel 2008 for Mac has a lot of new and useful great features you can use to maximize efficiency in your spreadsheets. Excel doesn't have to be the boss anymore, you can! The Microsoft Office for Mac team shows you all the great features in this how-to video.
A rough definition of standard deviation is that it is a measure of expressing the observed variations about the average in statistical data i.e. by how much do the observed values vary from the mean. This video continues from the previous solved example and demonstrates the mathematical interpretation of the standard deviation that was calculated. We begin with stating the mean and standard deviation values and then calculating the upper and lower bounds of the data based on the standard dev...
You don't need a high definition television to take advantage of AppleTV! This tutorial shows you how to set up your Apple TV to function with a standard definition television set. You'll need an HDMI to DVI cable anda VGA to DVI adapter, and use the yellow composite video cords. Then adjust your settings, and you're ready to start watching your new Apple TV!
An untuned guitar can be huge setback for a lot of players. Get your guitar in tune and get that song sounding right with help from this tutorial on how to tune your guitar to standard tuning.
Jazz music, along the lines of jazz greats like Coltrane and Thelonius Monk, is usually associated with the piano and the sax (as well as backup clarinets, oboes, etc.). But an equally fit instrument for playing jazz tunes is the acoustic guitar, which offers a light contrast to the larger, deeper toned instruments.
In this ASP.Net video tutorial, Chris Pels will show how to use nested master pages to create individual master pages that represent different standard content layouts for a web site. First, see how several major commercial web sites use a standard set of content layouts. Next, see how to nest a master page within another master page, and use the design time support in Visual Studio 2008. Then, learn the considerations for establishing a “page architecture” which represents the major types of...
It looks like the Huawei P20 Pro won't be the only phone with a triple camera for much longer. Rumors indicate the upcoming LG V40 ThinQ will share the same number of cameras. And just like with dual cameras, LG is showing that there is more than one way to arrange them.
The latest trend in smartphone design is all about the display. Manufacturers want larger screens with smaller bezels. The rumors are heating up about Google's next big release, the Pixel 2, and with that, we may have a clue that shows us Google is hopping on the display train.