If you use Microsoft Excel on a regular basis, odds are you work with numbers. Put those numbers to work. Statistical analysis allows you to find patterns, trends and probabilities within your data. In this MS Excel tutorial from everyone's favorite Excel guru, YouTube's ExcelsFun, the 83rd installment in his "Excel Statistics" series of free video lessons, you'll learn how to construct confidence intervals when the sigma (population standard deviation) in NOT known using the TINV function.

If you use Microsoft Excel on a regular basis, odds are you work with numbers. Put those numbers to work. Statistical analysis allows you to find patterns, trends and probabilities within your data. In this MS Excel tutorial from everyone's favorite Excel guru, YouTube's ExcelsFun, the 29th installment in his "Excel Statistics" series of free video lessons, you'll learn how to create quantitative data cross tabulation using a pivot table (PivotTable).

If you use Microsoft Excel on a regular basis, odds are you work with numbers. Put those numbers to work. Statistical analysis allows you to find patterns, trends and probabilities within your data. In this MS Excel tutorial from everyone's favorite Excel guru, YouTube's ExcelsFun, the 11th installment in his "Excel Statistics" series of free video lessons, you'll learn how to work with, and create charts for, cross-sectional and time-series data.

If you use Microsoft Excel on a regular basis, odds are you work with numbers. Put those numbers to work. Statistical analysis allows you to find patterns, trends and probabilities within your data. In this MS Excel tutorial from everyone's favorite Excel guru, YouTube's ExcelsFun, the 13th installment in his "Excel Statistics" series of free video lessons, you'll learn how to install the Excel 2007 Data Analysis add-in.
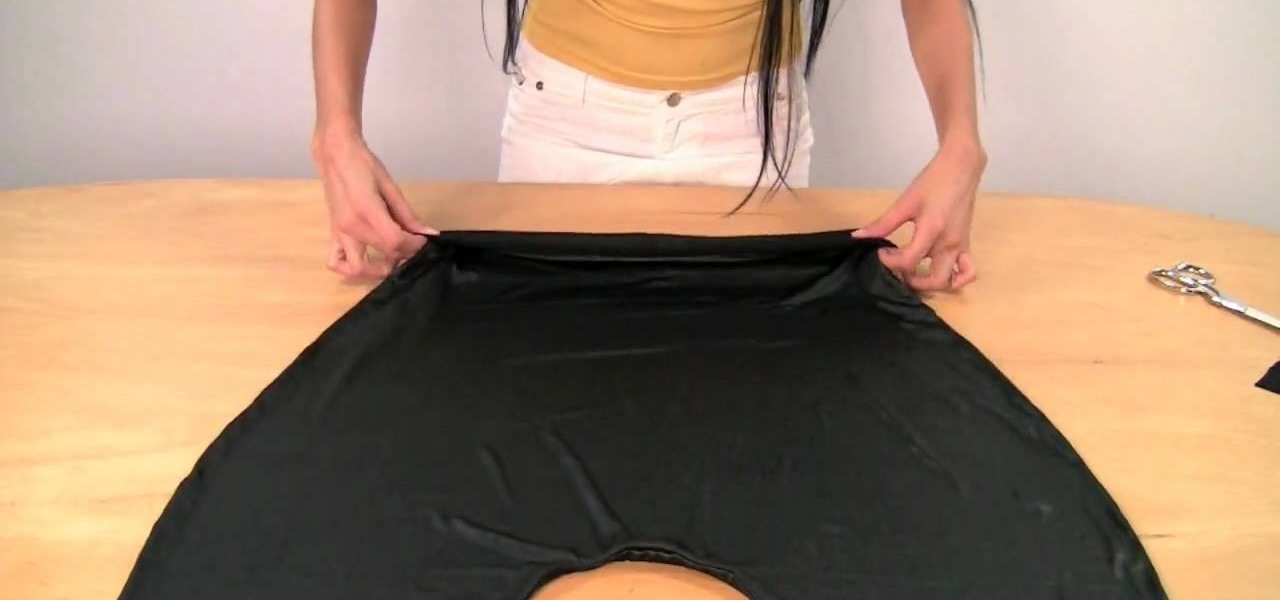
Learn how to convince someone to go skinny-dipping. The trick to getting someone to skinny-dip with you is to make them think it's their idea.
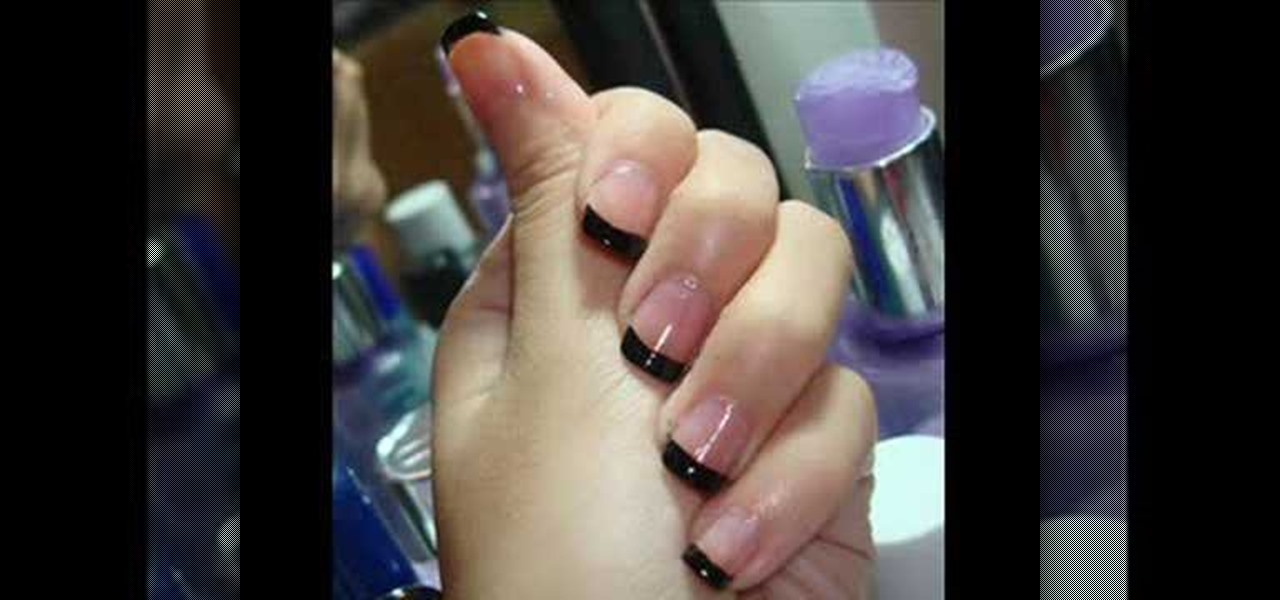
The manicure look in this how-to video walks a line between toughness and polishing, mixing the trend of all black manicures and the classic French tip. All you need is black nail polish and a steady of hand. Learn how to do a french manicure with black tips by watching this video nail care tutorial.

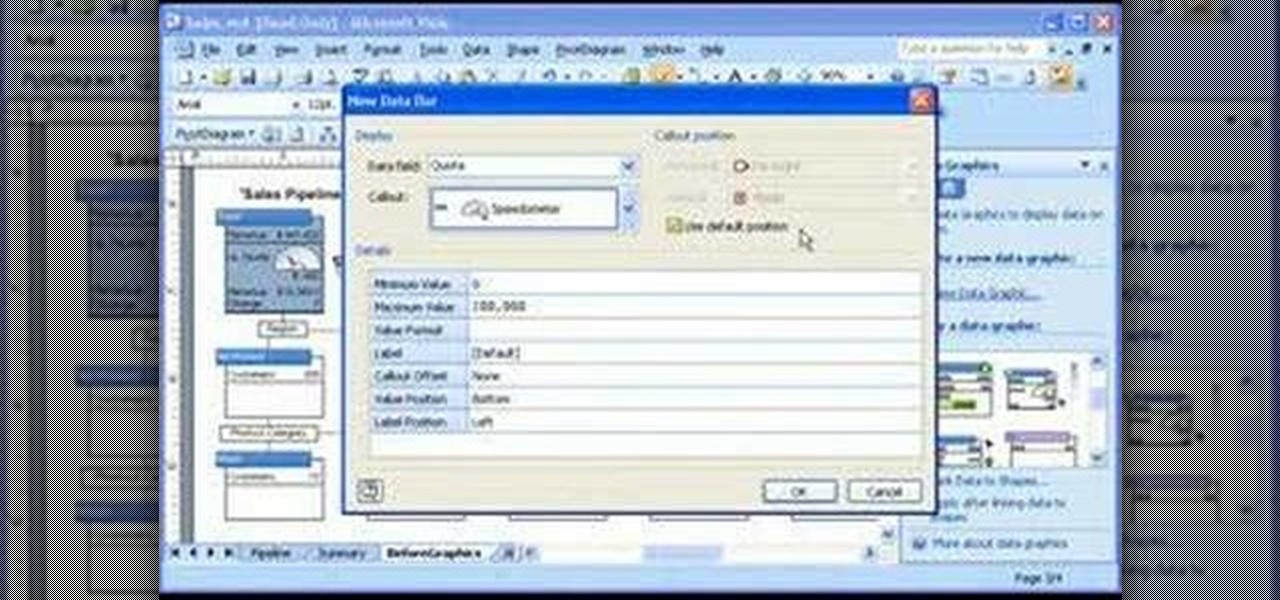
Take a look at this instructional video and learn how to customize progress meters, icons, color coding, and other graphical elements to emphasize sales trends, product performance, critical deadlines, or whatever information is contained in the data behind your diagram.
Excel is great, and if you're a Mac user, Excel 2008 for Mac has a lot of new and useful great features you can use to maximize efficiency in your spreadsheets. Excel doesn't have to be the boss anymore, you can! The Microsoft Office for Mac team shows you all the great features in this how-to video.
There's nothing quite like getting lost in the TikTok void. While you'll likely never run into the same video twice, the same can't be said for popular sounds and fads. Some trends get so viral, it feels like you hear the same song or track every other TikTok. Just know this: you don't have to put up with any trend you're sick of.
The past year brought about a number of trends in the smartphone space. More immersive displays, better processors, and portrait mode for cameras come to mind as big steps forward. One of the most polarizing trends that continued in 2017 is the removal of the 3.5 mm headphone jack from flagship phones. The number of manufacturers that have completely dispensed with wired audio is staggering, so let's run down the full list!
If you use Microsoft Excel on a regular basis, odds are you work with numbers. Put those numbers to work. Statistical analysis allows you to find patterns, trends and probabilities within your data. In this MS Excel tutorial from everyone's favorite Excel guru, YouTube's ExcelsFun, the 24th installment in his "Excel Statistics" series of free video lessons, you'll learn how to create quantitative data frequency distributions with pivot tables. See how to create the correct unambiguous labels ...
If you use Microsoft Excel on a regular basis, odds are you work with numbers. Put those numbers to work. Statistical analysis allows you to find patterns, trends and probabilities within your data. In this MS Excel tutorial from everyone's favorite Excel guru, YouTube's ExcelsFun, the 12th installment in his "Excel Statistics" series of free video lessons, you'll learn how to use Advanced Filter 'Unique Records Only" to extract a list of unique items from a data base, and then use the COUNTI...
It looks like the Huawei P20 Pro won't be the only phone with a triple camera for much longer. Rumors indicate the upcoming LG V40 ThinQ will share the same number of cameras. And just like with dual cameras, LG is showing that there is more than one way to arrange them.
Want to be on top of the trends this winter season? Circle scarfs are in now, and they are super easy to make! All you need is two yards of your favorite fabric, then sew it into a tube to create your own scarf.
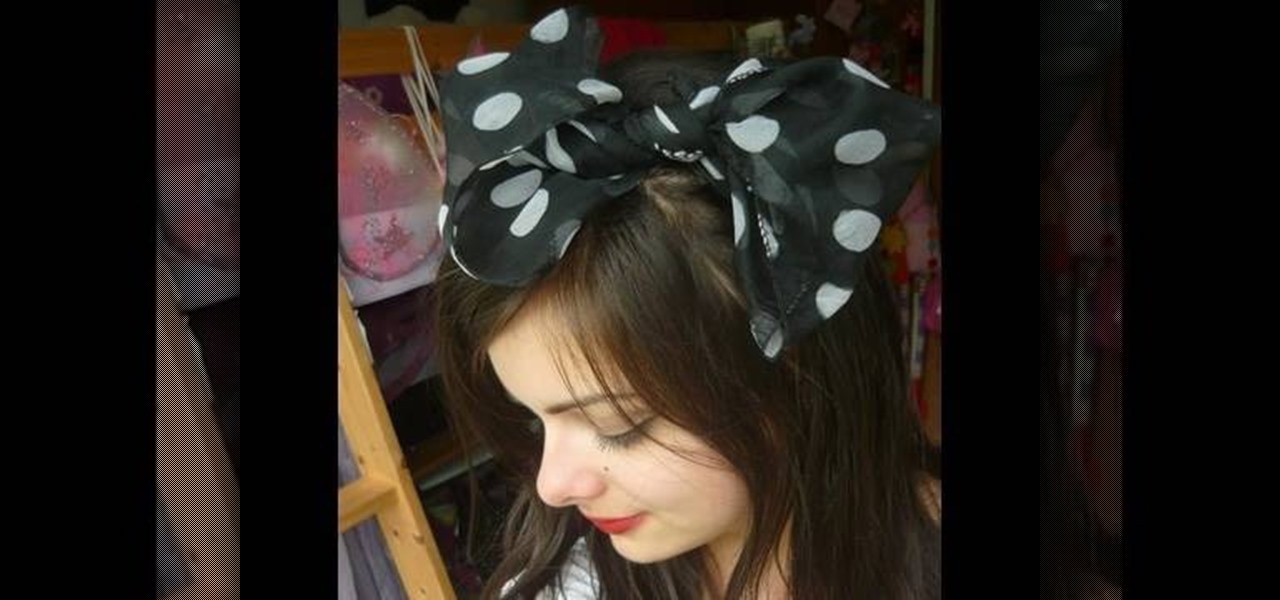
When it comes to Gossip Girl Blair Waldorf's wardrobe, big hair bows come only second to hairbands for hair accessories. But you don't need to purchase a bunch of hairbands with big bows on top of them to stay on top of the trend.
With feminine florals being one of the hottest spring and summer trends, it's often recommended by the fashion elite - including Tim Gunn - that more masculine elements be included in your outfits to balance out floral girliness.
If you use Microsoft Excel on a regular basis, odds are you work with numbers. Put those numbers to work. Statistical analysis allows you to find patterns, trends and probabilities within your data. In this MS Excel tutorial from everyone's favorite Excel guru, YouTube's ExcelsFun, the 92nd installment in his "Excel Statistics" series of free video lessons, you'll learn how to use the TINV and TDIST functions to test a hypothesis.
If you use Microsoft Excel on a regular basis, odds are you work with numbers. Put those numbers to work. Statistical analysis allows you to find patterns, trends and probabilities within your data. In this MS Excel tutorial from everyone's favorite Excel guru, YouTube's ExcelsFun, the 85th installment in his "Excel Statistics" series of free video lessons, you'll learn how to construct confidence intervals for proportions using NORMSINV function and other formulas.
A new fashion trend on the rise: In-the-embroidery hoop purses! Add flair and fun with these embroidery project designs. Just follow this instructional video, and you can make fun gifts.
Watch as MSN's Glam Squad member Stefani Greenfield, co-founder of Scoop NYC, teaches viewers how to liven up their work wardrobes with new black and white trends.
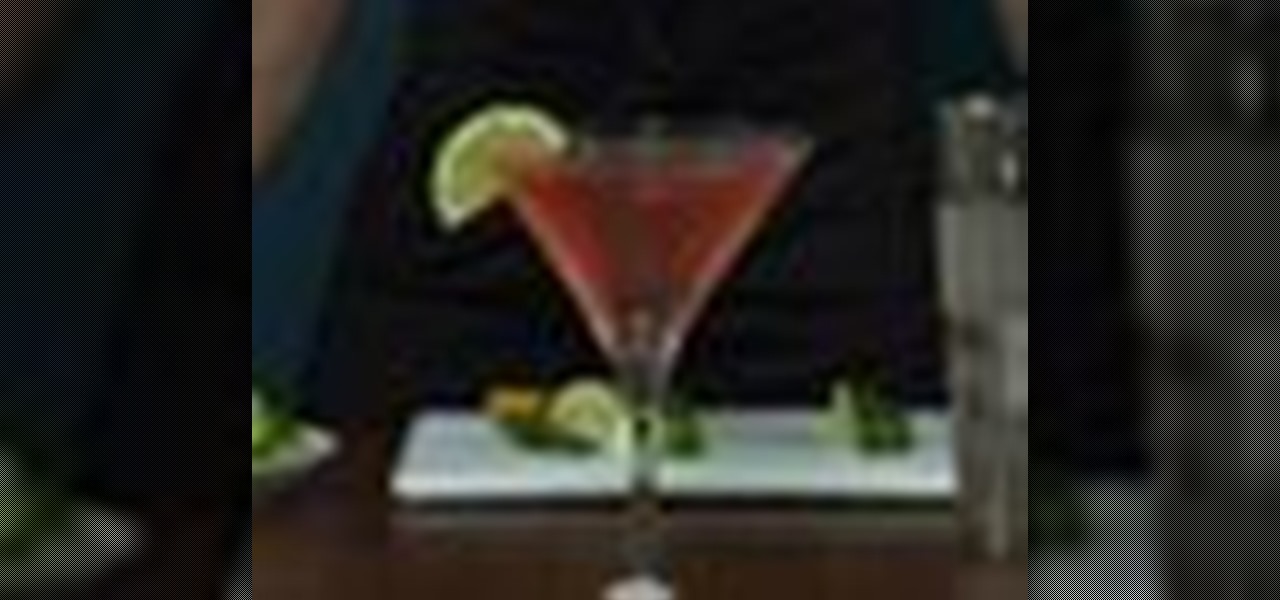
Yes, they slurped cosmos by the gallon on Sex & the City, launching this pretty-in-pink drink into the super-trend stratosphere. But those ladies had the right idea: this delicious cocktail lives up to the hype.
For those who wear suits, learn how to add some spice to your everyday wear. Pocket squares not only add color, but are quickly becoming the latest fashion trend for formal wear.
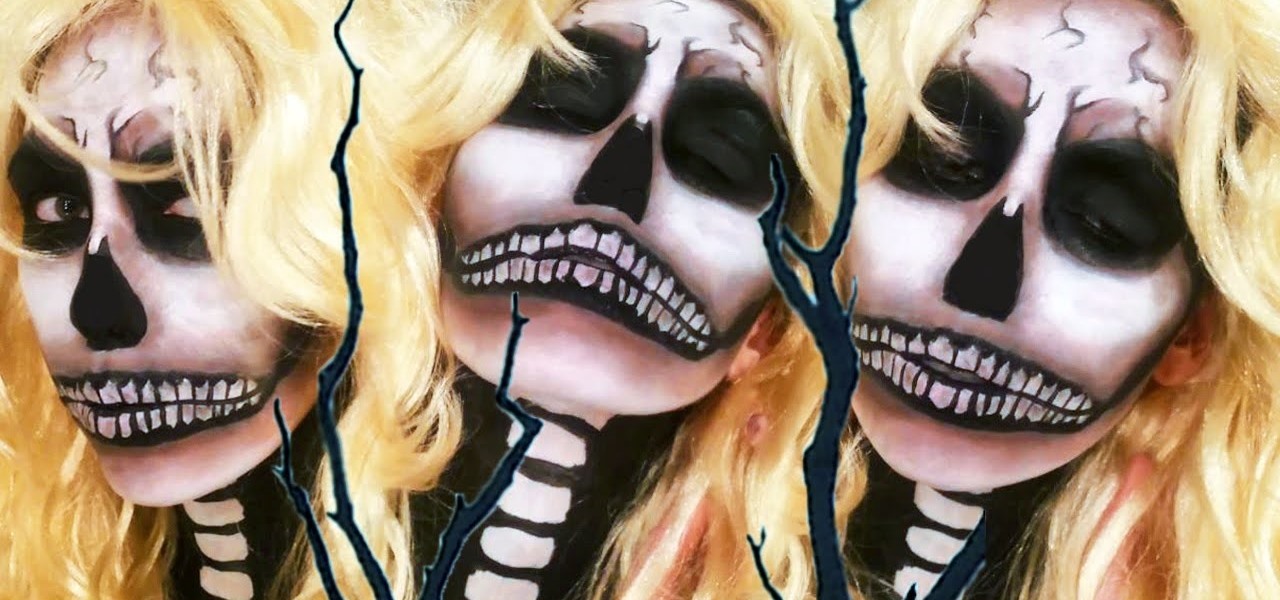
Halloween is coming up and skulls never go out of trend! I created this cool sexy blonde-looking skull to spice the whole skull Halloween look up! Hope you enjoy. All of the products are in the description box of the video on YouTube.
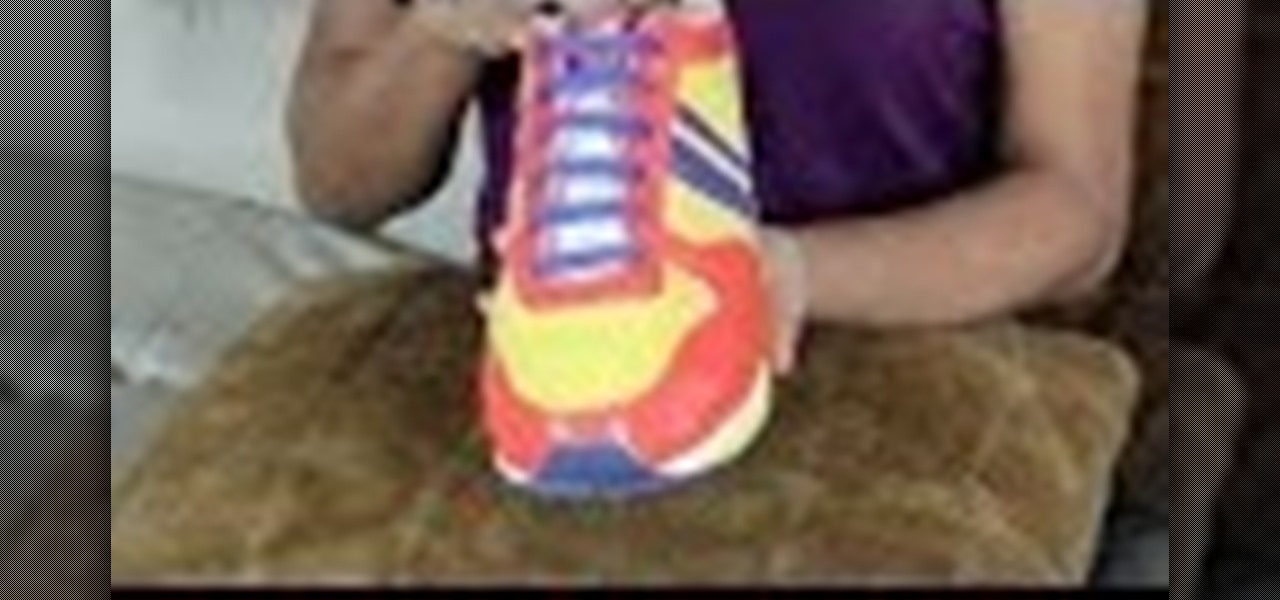
Today we show you how to bar lace your shoes. This trend is a way to never tie your shoes again! It is So Easy a Guy Can Do It!
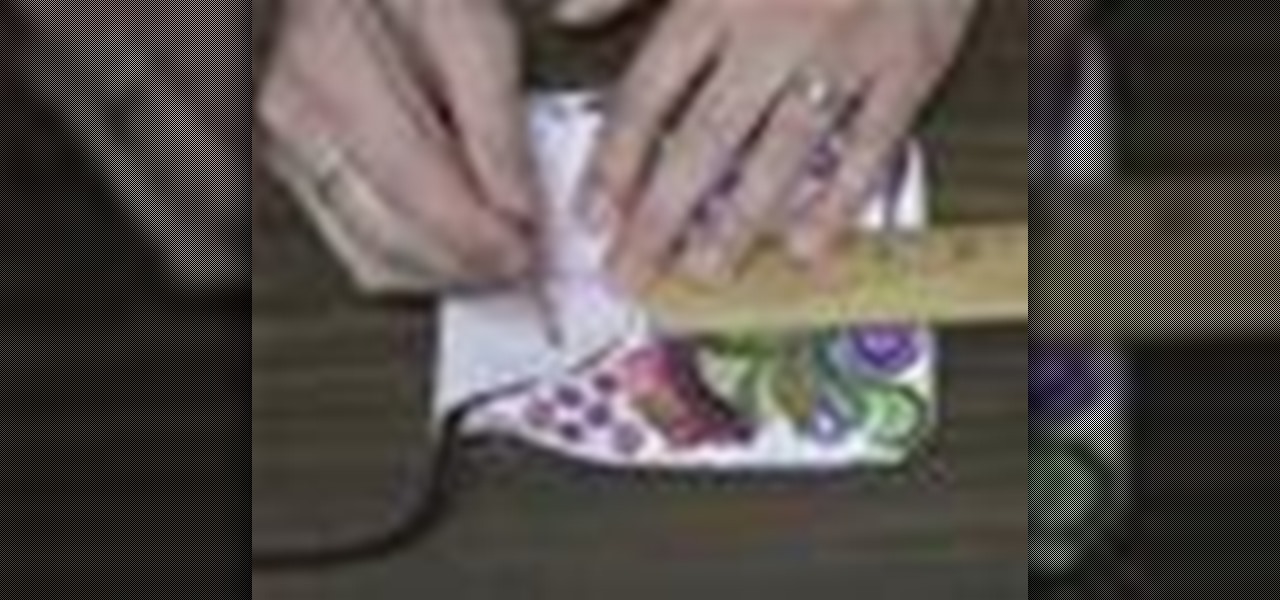
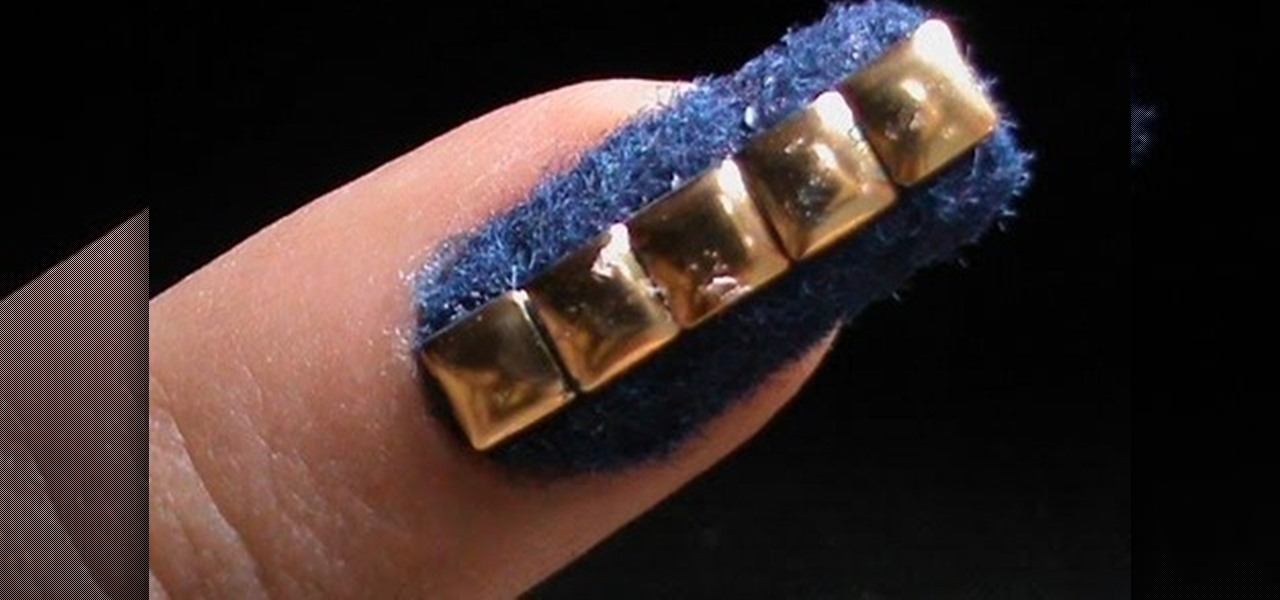
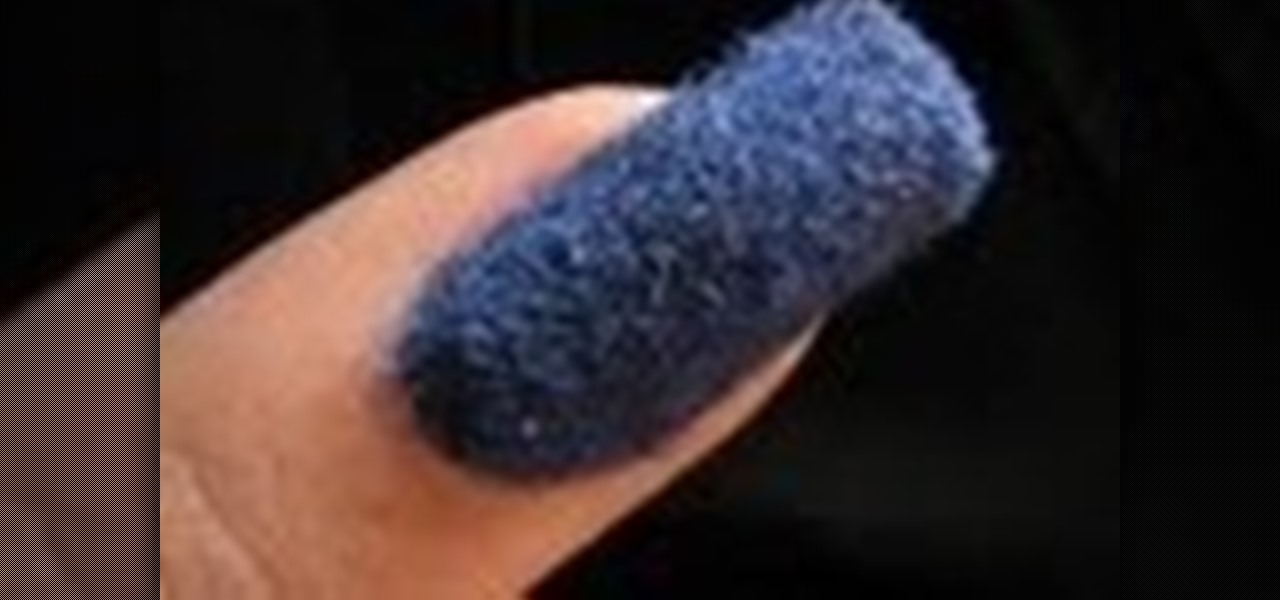
This is a very easy flocking powder nail art done by superWOWstyle, and is the latest and very fast developing trend in nail art of late! This velvet nails velvet nail dust, and just like any velvet nails lounge nails -- lots of technique.
This is a very easy flocking powder nail art done by superWOWstyle, and is the latest and very fast developing trend in nail art of late!
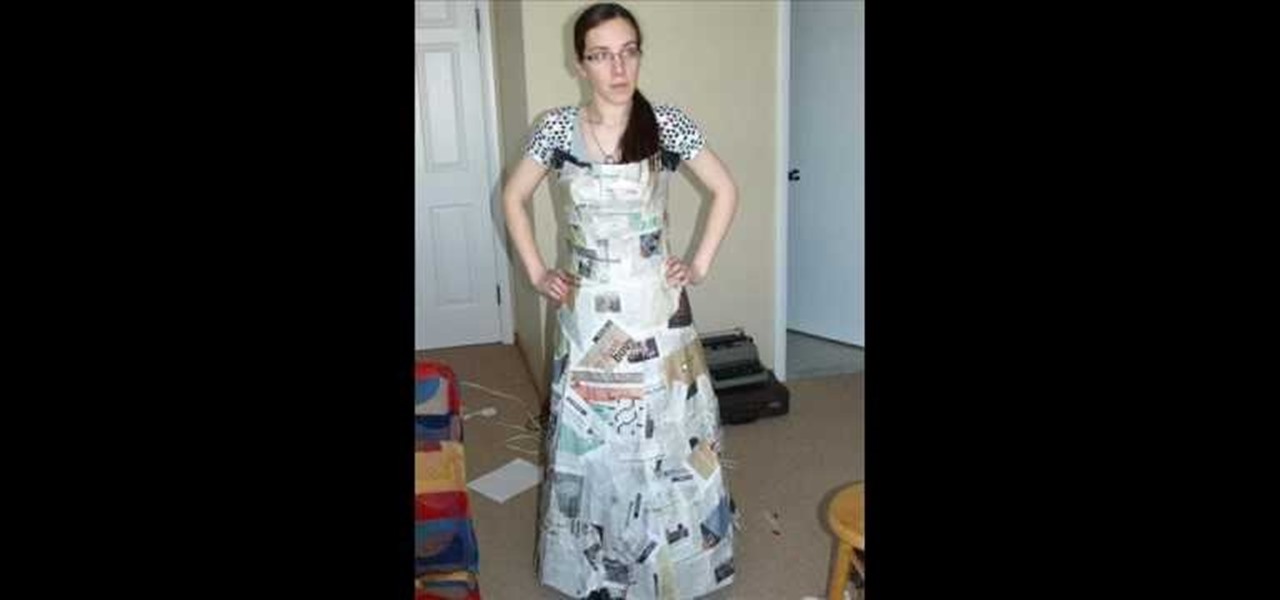
The newest trend in couture? It's called 'trashion' - high fashion using trashy things. And we mean trashy! This tutorial shows you how to make a ball gown using trash bags, duct tape and newspapers. You'll also want a dressmaker's dummy to construct your dress around - or at least a model who's okay with standing still for a long period of time. Use the trash bags to form the dress, and then attack the newspapers over it layer by layer. You're ready for your debut!
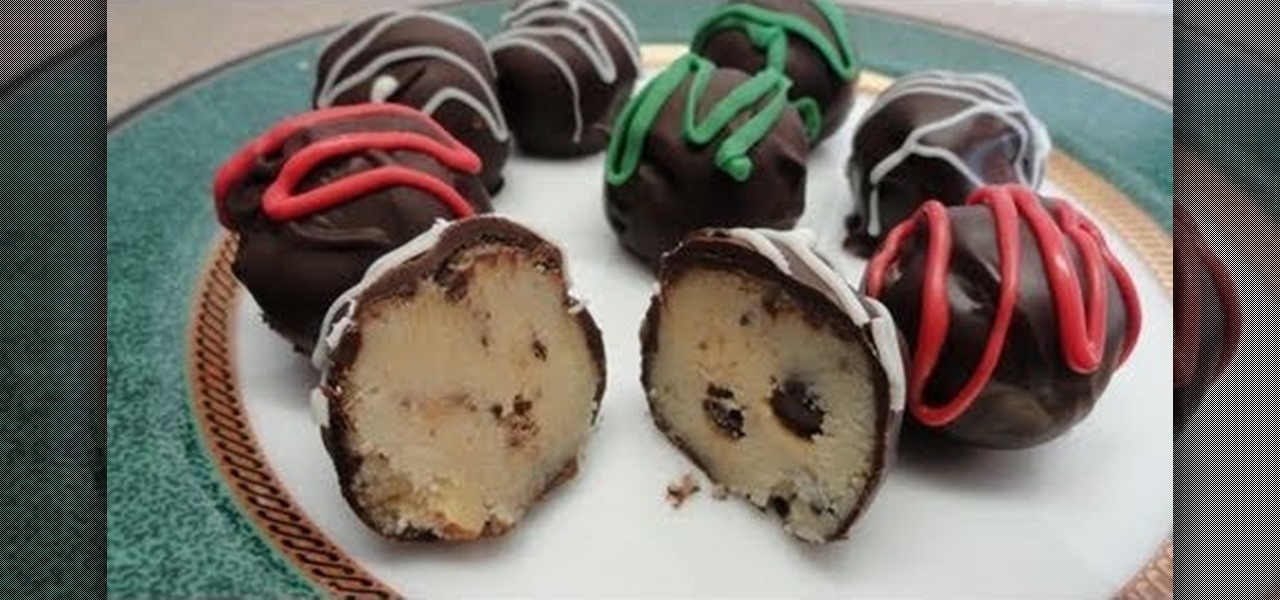
Cupcakes are so overdone. Sure, they're cute and bite-sized, but why not start a new designer dessert trend? Check out this dessert video to learn how to bake and decorate delicious chocolate chip cookie dough Christmas truffles.
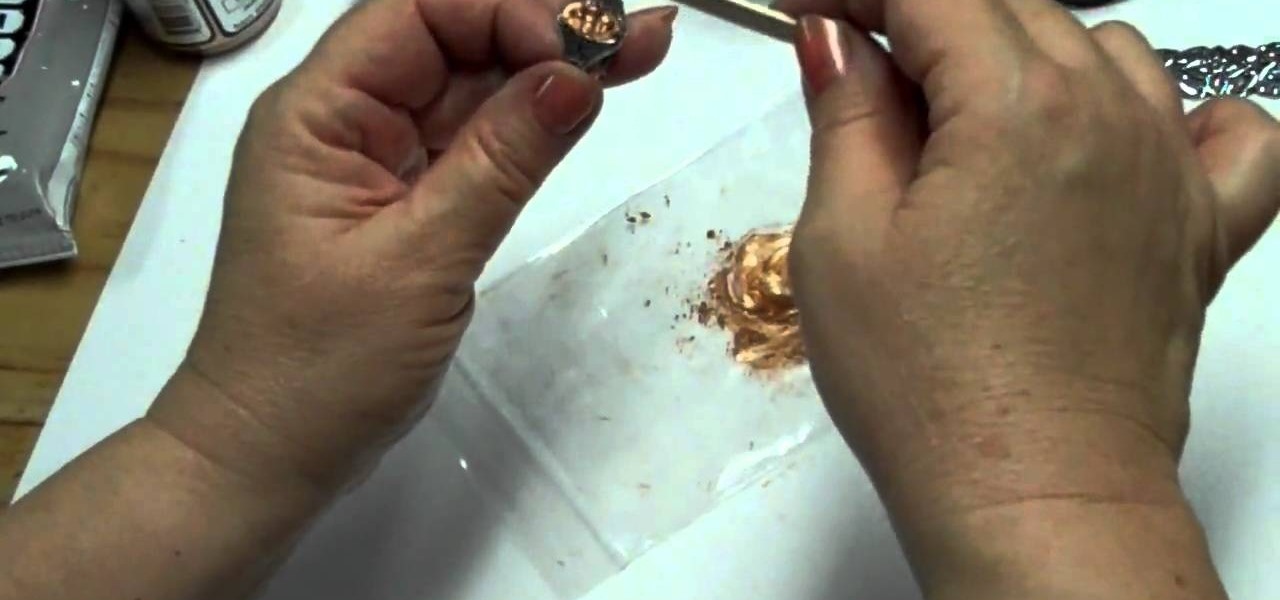
Add instant art school style to your outfit by crafting this propeller Steampunk brass ring. Steampunk style, which fuses Victorian/industrial age style with anachronisms like old watch parts and propellers, is on trend right now with Hollywood as well as the indie craft scene.
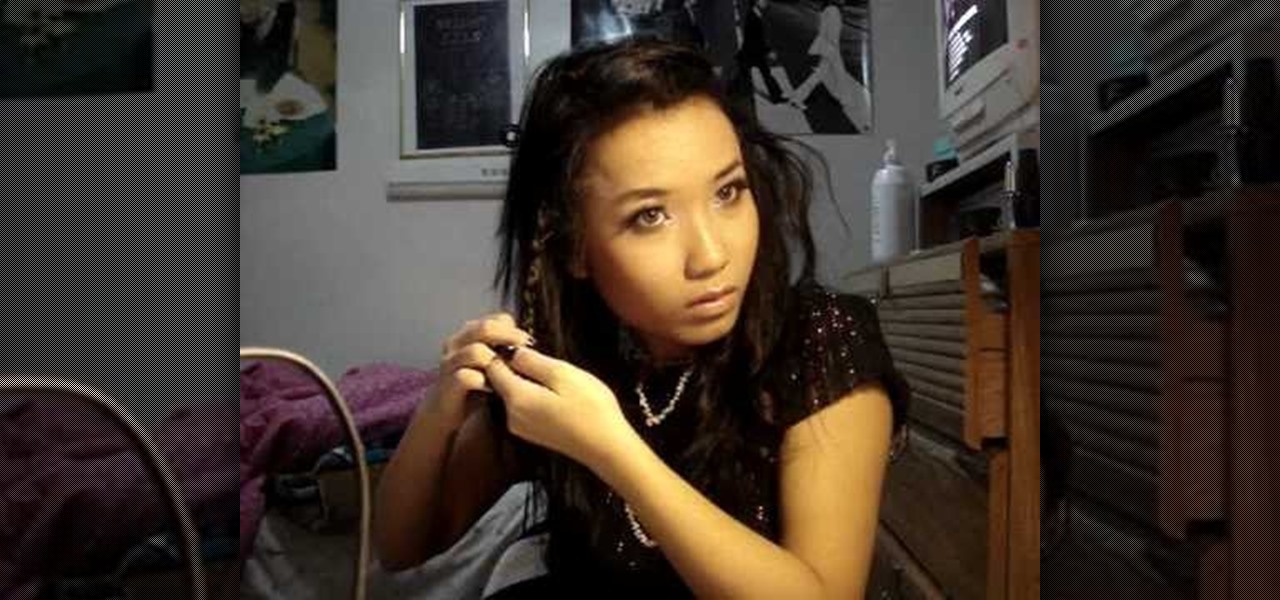
Unless you've been living under a WiFi disabled rock for the past year or two, you probably know about Nicole Richie. And if you've heard of the It girl, then you probably also know that she's been setting trends left and right with her bohemian, waif-y tendencies of dress and hair.
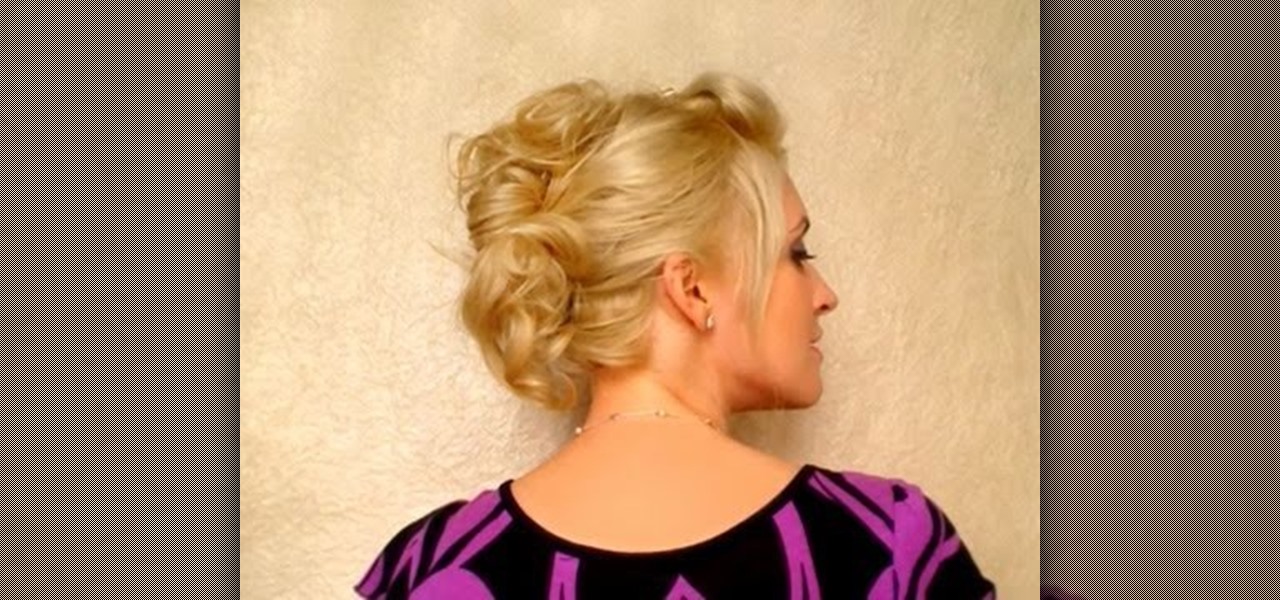
The difference between mohawks and faux hawks is that the former is punk while the later is in fashion. From Rihanna to Blake Lively, young Hollywood's starlets are totally digging the faux hawk trend and wearing it to movie premieres and awards shows.
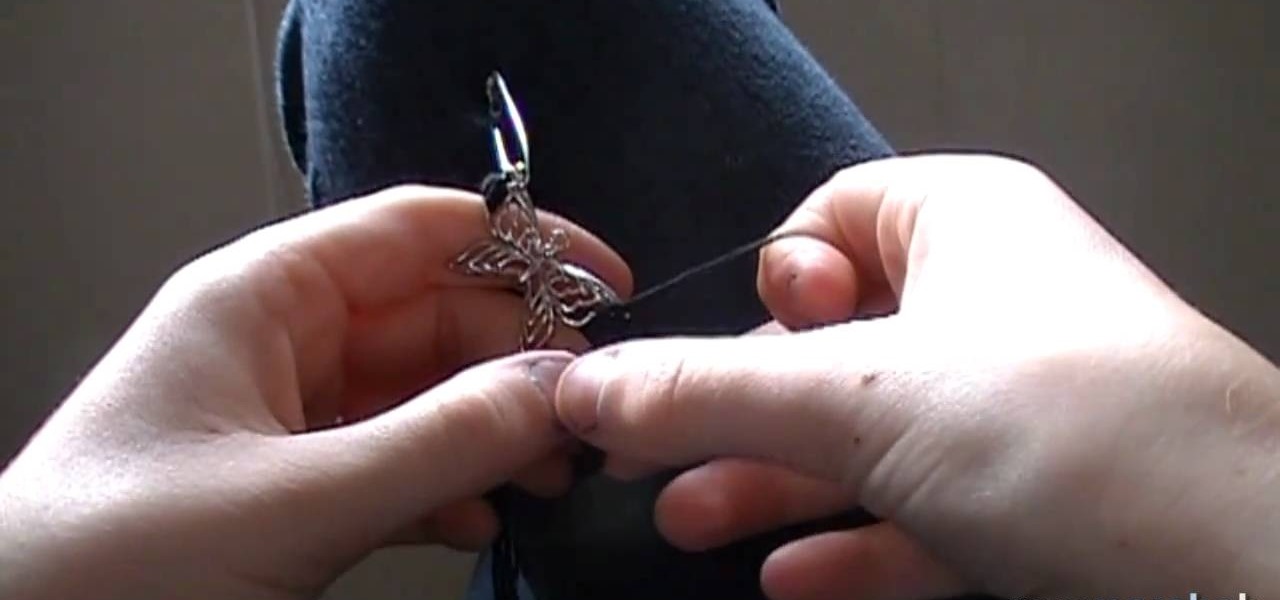
Bohemian ware is all the rage these days - from bohemian headbands to necklaces to hemp jewelry, the braided, slightly undone look is all the rage. Get in on the trend without dropping mad stacks at a store by creating this cute spiral braided bracelet.
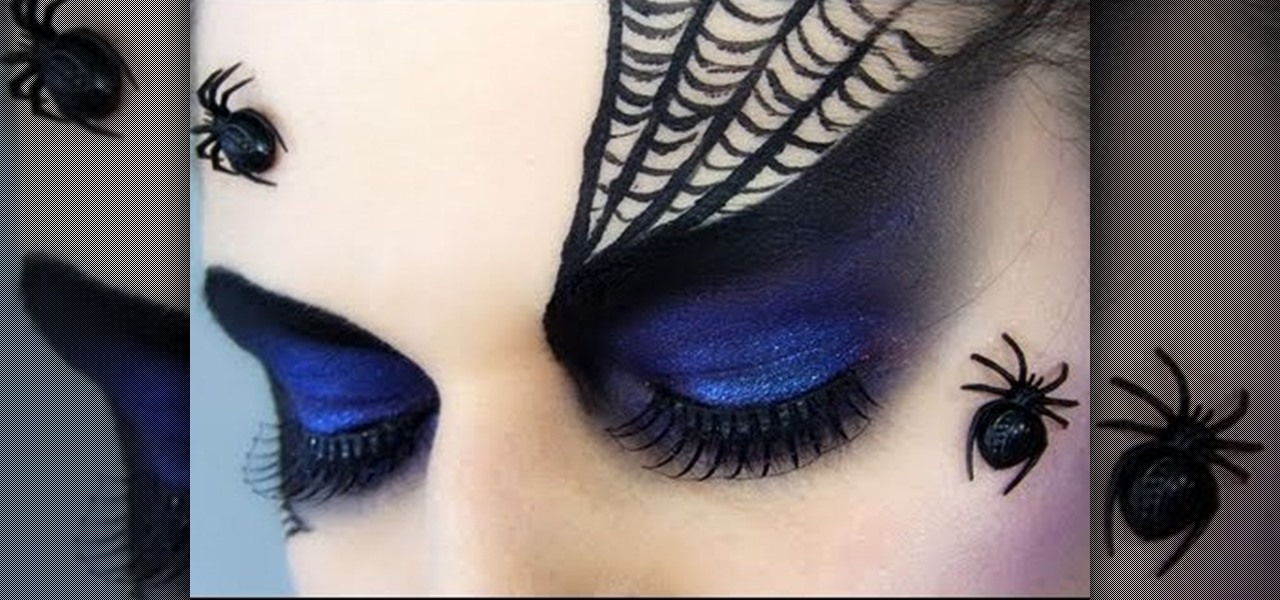
We are totally smitten with this Spider Queen/Black Widow makeup look because it's equal parts enchanting and icky. This Halloween look takes the fall purple trend to new heights, exaggerating the eyes with intense blue purple swoops of color and the lips enrobed in a deep black-based blue. Spiderwebs drawn on above the brows and mini spiders glue on just give us the heebie jeebies.
We don't know where the penguin trend started, but for the past couple of years the arctic animal has been getting some serious loving. From "Happy Feet" to Club Penguin, penguins are flopping around everywhere in the public conscoiusness. And who can really blame our fascination with penguins, given their chubbiness and adorable waddling?
Cosplay, or "costume play," is basically dressing up with costumes and accessories to represent a specific character, usually one in anime (like Sailor Moon) or manga. Like most Japanese fashion trends, cosplay emerged from the trendsetting Harajuku district of Japan and continues to thrive today, even in America when people wear costumes to anime conventions.
Emma Watson, who plays Hermione Granger in the "Harry Potter" series, is actually a lot like the character she embodies. Both are quite intelligent (Watson just finished her freshman year at Brown), strong, and independent, and both rely on minimal makeup to enhance their features.
We ladies have had to primp and scrutinize ourselves for thousands of years, painstakingly plucking, waxing, painting, and slathering in order to conform to societal ideals of the perfect woman. And until recently men haven't felt the need to conform physically to much of anything until recently. According to British publication "The Guardian," there's a new revolution in male grooming and accessorizing/dressing where men actually want to look model thin, well dressed, and well groomed.
Fashion doesn't have to be restrictive or uncomfortable, we swear. Thanks to the recent high fashion runway trend of harem pants seen at multiple shows in Paris, Milan, and New York, we now have a fashionable clothing item that doesn't (literally) take our breath away or suffocate our baby toe.
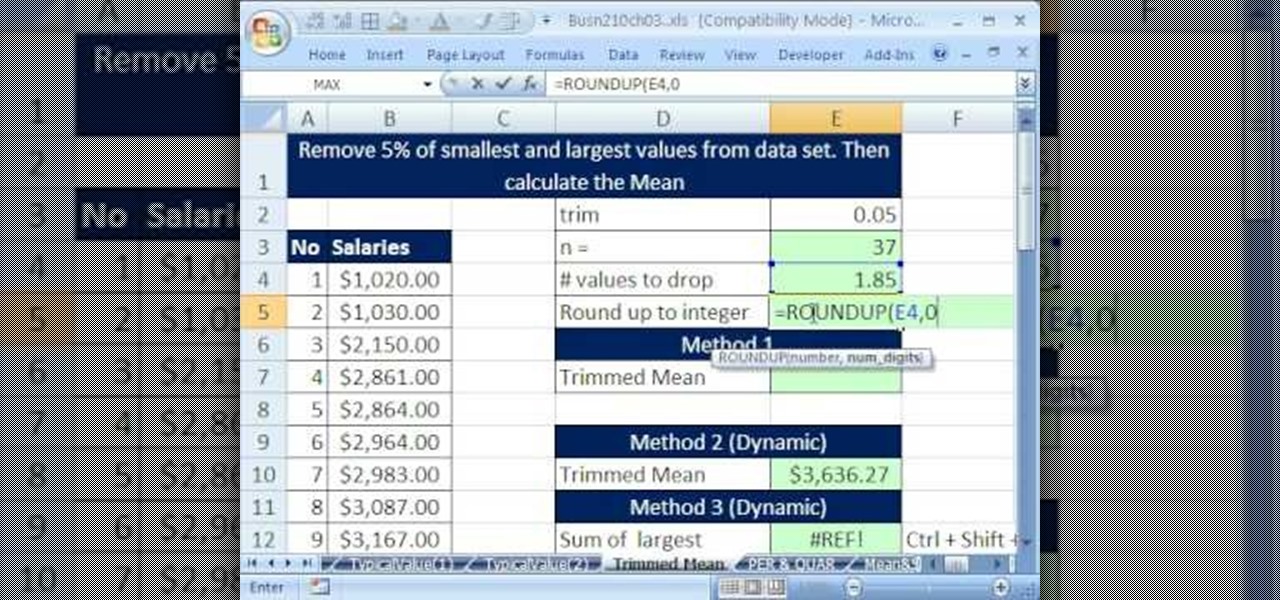
If you use Microsoft Excel on a regular basis, odds are you work with numbers. Put those numbers to work. Statistical analysis allows you to find patterns, trends and probabilities within your data. In this MS Excel tutorial from everyone's favorite Excel guru, YouTube's ExcelsFun, the 36th installment in his "Excel Statistics" series of free video lessons, you'll learn how to calculate a trimmed mean, which is used when there are extreme values in the data set that might skew the mean.
If you use Microsoft Excel on a regular basis, odds are you work with numbers. Put those numbers to work. Statistical analysis allows you to find patterns, trends and probabilities within your data. In this MS Excel tutorial from everyone's favorite Excel guru, YouTube's ExcelsFun, the 39th installment in his "Excel Statistics" series of free video lessons, you'll learn about variability (or dispersion or spread). Create an X-Y Scatter Diagram chart showing data points and the mean.