If you use Microsoft Excel on a regular basis, odds are you work with numbers. Put those numbers to work. Statistical analysis allows you to find patterns, trends and probabilities within your data. In this MS Excel tutorial from everyone's favorite Excel guru, YouTube's ExcelsFun, the 27th installment in his "Excel Statistics" series of free video lessons, you'll learn how to create a quantitative data dot plot chart using the REPT and COUNTIF functions.

If you use Microsoft Excel on a regular basis, odds are you work with numbers. Put those numbers to work. Statistical analysis allows you to find patterns, trends and probabilities within your data. In this MS Excel tutorial from everyone's favorite Excel guru, YouTube's ExcelsFun, the 26th installment in his "Excel Statistics" series of free video lessons, you'll learn how to create quantitative data cumulative frequency distributions with pivot tables.

If you use Microsoft Excel on a regular basis, odds are you work with numbers. Put those numbers to work. Statistical analysis allows you to find patterns, trends and probabilities within your data. In this MS Excel tutorial from everyone's favorite Excel guru, YouTube's ExcelsFun, the 16th installment in his "Excel Statistics" series of free video lessons, you'll learn how to cross tabulate & do percentage cross tabulation for categorical data using a pivot table (PivotTable).

If you use Microsoft Excel on a regular basis, odds are you work with numbers. Put those numbers to work. Statistical analysis allows you to find patterns, trends and probabilities within your data. In this MS Excel tutorial from everyone's favorite Excel guru, YouTube's ExcelsFun, the 19th installment in his "Excel Statistics" series of free video lessons, you'll learn how to group categories in a frequency distribution with a formula (2 COUNTIF) and the pivot table (PivotTable) grouping fea...

If you use Microsoft Excel on a regular basis, odds are you work with numbers. Put those numbers to work. Statistical analysis allows you to find patterns, trends and probabilities within your data. In this MS Excel tutorial from everyone's favorite Excel guru, YouTube's ExcelsFun, the 17th installment in his "Excel Statistics" series of free video lessons, you'll learn how to cross tabulate & do percentage cross tabulation for categorical data using formulas rather than pivot tables.

If you use Microsoft Excel on a regular basis, odds are you work with numbers. Put those numbers to work. Statistical analysis allows you to find patterns, trends and probabilities within your data. In this MS Excel tutorial from everyone's favorite Excel guru, YouTube's ExcelsFun, the 3rd installment in his "Excel Statistics" series of free video lessons, you'll learn how to use Excel's sorting and pivot tables (PivotTables) data analysis tools.

If you use Microsoft Excel on a regular basis, odds are you work with numbers. Put those numbers to work. Statistical analysis allows you to find patterns, trends and probabilities within your data. In this MS Excel tutorial from everyone's favorite Excel guru, YouTube's ExcelsFun, the 35th installment in his "Excel Statistics" series of free video lessons, you'll learn how to calculate weighted and geometric means and see how to use the GEOMEAN function.
If you use Microsoft Excel on a regular basis, odds are you work with numbers. Put those numbers to work. Statistical analysis allows you to find patterns, trends and probabilities within your data. In this MS Excel tutorial from everyone's favorite Excel guru, YouTube's ExcelsFun, the 33rd installment in his "Excel Statistics" series of free video lessons, you'll learn how to use the AVEARGE, MEDIAN, MODE, PERCENTILE, QUARTILE and PERCENTILERANK functions to measure location.
If you use Microsoft Excel on a regular basis, odds are you work with numbers. Put those numbers to work. Statistical analysis allows you to find patterns, trends and probabilities within your data. In this MS Excel tutorial from everyone's favorite Excel guru, YouTube's ExcelsFun, the 4th installment in his "Excel Statistics" series of free video lessons, you'll learn how to create a frequency table and percentage frequency table using a Pivot Table (PivotTable).
Want to remove dried wax from a carpet? You'll need four items: a white towel, a regular electric iron, a carpet cleaning solution and a hot-water extraction machine. For a complete, step-by-step demonstration of how to remove pesky paraffin wax stains from your own carpet, watch this free housekeeping video tutorial.
This excellent tutorial shows you exactly what you have to do to crochet your very own crotchet stocking, using your left hand. This extensive video shows you the quickest and easiest way to crocheting your own hat to wear, for special and regular occasions.
The video is a Photoshop tutorial teaching how to create the starry sky effect, an effect that turn regular sky in a photo into a starry night sky using the Adobe Photoshop software. This effect is created by the use of Photoshop filters like noise, blur, levels and masking in order to achieve the look of a real night sky. By following the tutorial you will learn how to create and control the amount of stars in the photo's sky in only 6 minutes.
You don’t have to eat meat to get all the iron you need. There are many very iron rich vegetables that can be eaten on their own or juiced and drank to make sure you have appropriate amount of minerals in your blood.
Cassettes take up quite a bit of space, and can sometimes start showing wear, which can affect the sound. This video shows you how to take this information from your cassettes, and move them on to a CD. Detailed instructions, and photos in this video, will have you transferring analog information into a digital format within just minutes. This allows you to be able to use the audio recording on your computer, as well as being able to listen to it in a regular CD player.
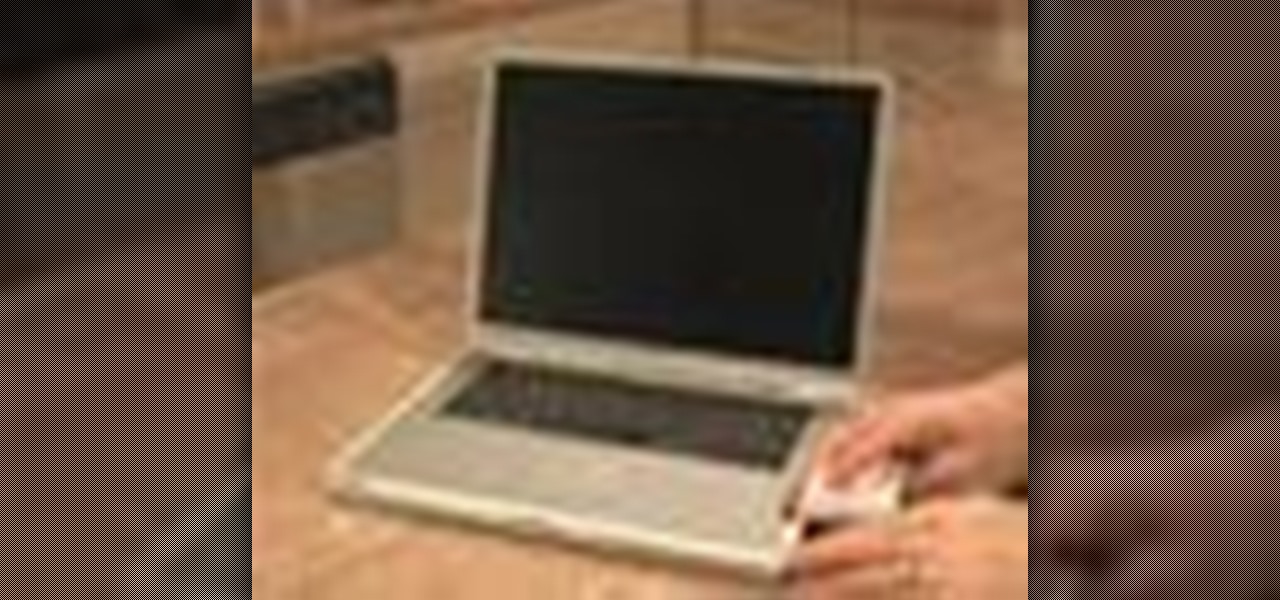
Regular cleaning of your laptop computer is easy, and might save you tons of trouble in the long run. Learn how to clean your laptop with a homemade solution.
Celebrites make party hopping look so easy. Flitting around from red carpet event to after party to after after party, they always seem to look so flawless in their pictures. But here's a little secret: They have some help from Hollywood's top hairstylists.
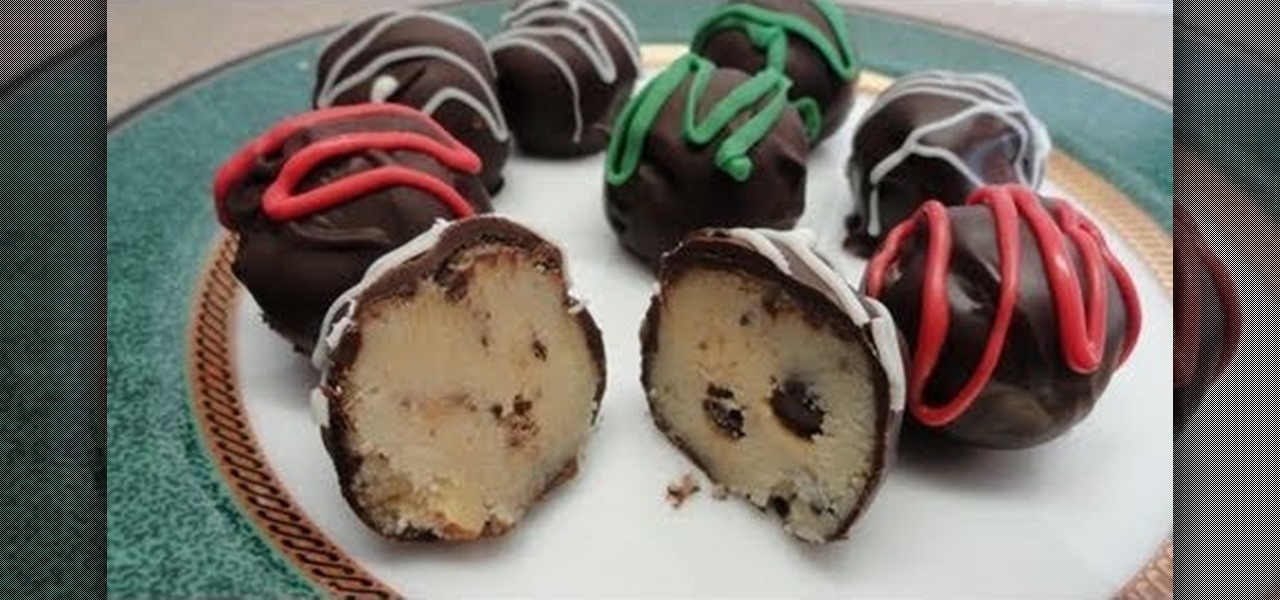
Cupcakes are so overdone. Sure, they're cute and bite-sized, but why not start a new designer dessert trend? Check out this dessert video to learn how to bake and decorate delicious chocolate chip cookie dough Christmas truffles.
Glyph puzzles are a regular feature in the Assassin's Creed series, and finding and solving all of them is just one of these games' many awesome diversions. This video will show you where to find and how to solve each of the game's 16 glyph puzzles.
Want to earn the "Sally Likes Blood" achievement on the Regular difficulty setting in the single-player campaign of Call of Duty: Black Ops? Here's how you do it.
French braids are timeless hairstyles that make you look elegant and put together whether you're simply headed for Biology class or you're assembling a beautiful hairdo for a wedding.
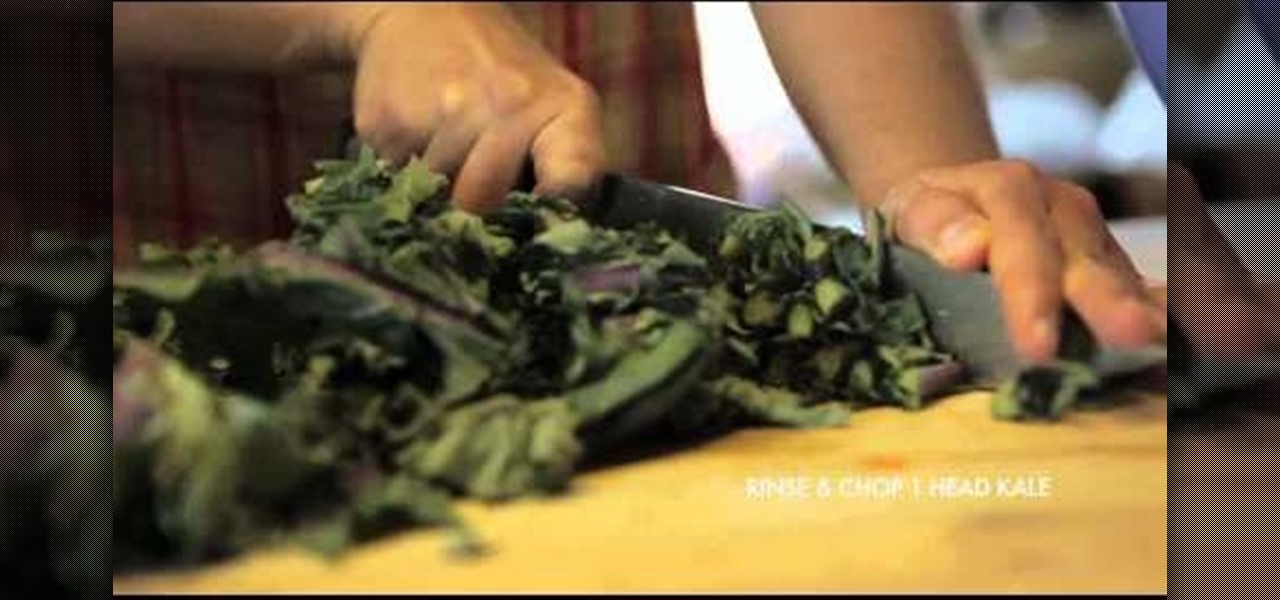
Seitan is known as gluten meat, or wheat meat. Basically, it's a vegetarian and vegan substitute for regular meat. Since National Vegan Day was November 1st, commemorate the holiday by making this delicious vegan seitan, kale, and squash dish.
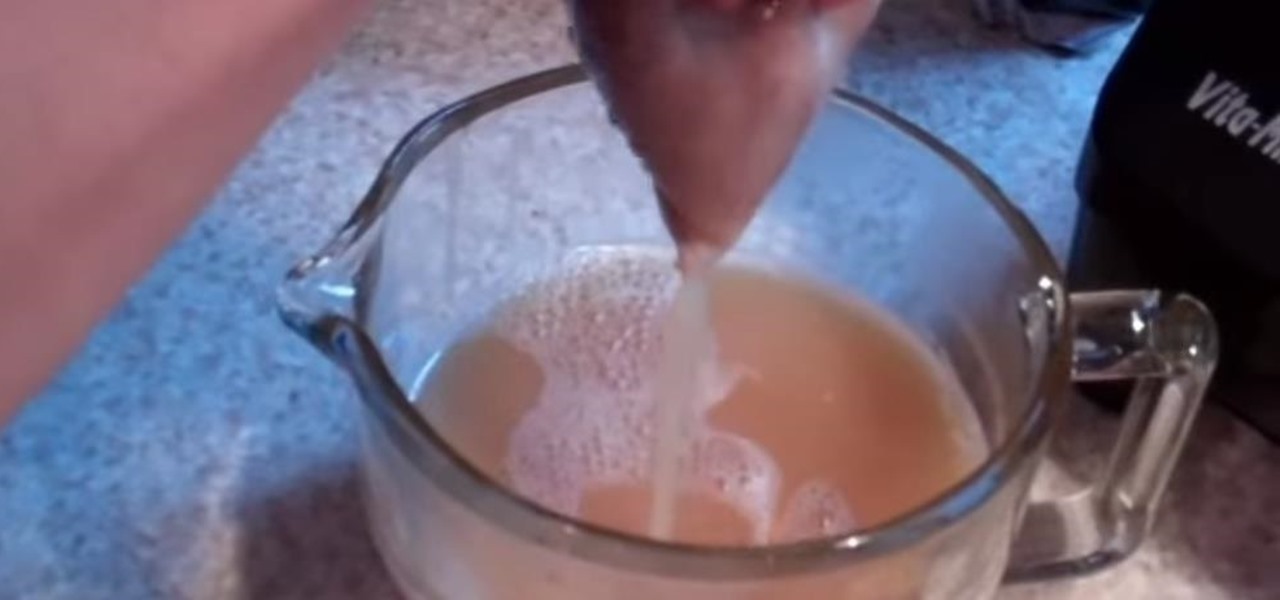
Apple chai-der is a delicious blend of the two most delicious fall beverages, apple cider and chai tea. The drink starts off with regular apple cider, then kicks things up a notch with warm spices like nutmeg, cinnamon, and clove.
French braids are undeniably the older, more put together and elegant sister of regular braids. This makes French braids a beautiful alternative to normal braids for times when you want to look gorgeous with minimal effort.
One of the rituals of homeownership is regular yard work. Central to this yard maintenance is the awesome art of mowing the lawn. Just make sure you're not "scalping" your grass! Lowe's has the advice you need for mowing your landscape.
Grapes as dessert? After watching this food video you'll think twice about these juicy purple orbs. While we think popping some grapes into our mouths is delicious enough as it is, this recipe combines grapey goodness with icy coldness for a delicious, almost popsicle like snack.
It doesn't take a nutritionist to know that eating too much meat is not good for your body. From hormones added to the feed for cows and chickens to contamination from bacteria, it's a good idea to integrate lighter vegetable dishes into your diet on a regular basis.
In this tutorial, we learn how to draw graffiti lettering. To do this, you will use a pen and draw out your letters adding a graffiti flare to them. Do not draw regular letters, these have outlines and a flare out to the ends of them. This is very similar to the graffiti you will see written outside, but used with spray paint. Fill in the middles of the letters, then draw lines around it to make it look like it's standing off of the paper. use a marker to outline the sides of the letters so e...
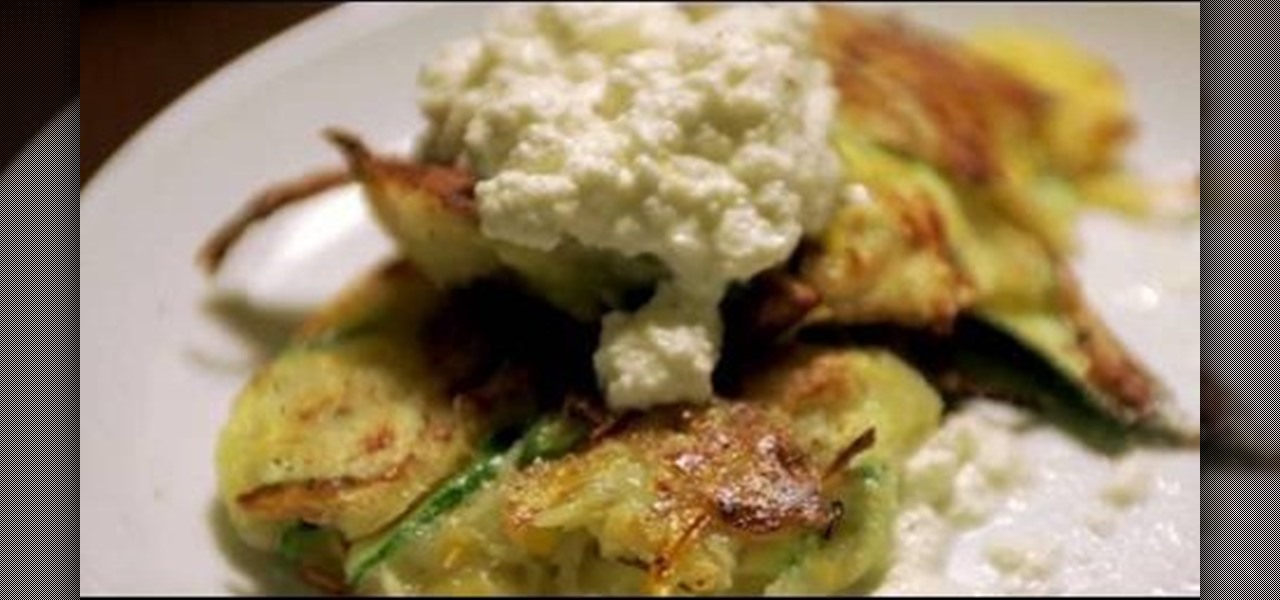
Zucchino pancakes are certainly a lot healthier than regular doughy pancakes, which is why we're digging this recipe! Healthy food doesn't have to taste like a jail sentence, as these lovely pancakes prove.
In this tutorial, we learn tips on how to avoid skin irritation while shaving. For women, this is a necessary thing they must do everyday, but irritation occurs often. First, shave only in the shower. In the beginning, use a cleanser on the area you are going to shave. During the course of the shower, your skin will soften. Now, take shaving cream and rub it onto your leg. Now, take a regular razor and have with the grain, then against it until your legs are smooth. When finished shaving, dry...
In this tutorial, we learn how to use salty hashes to keep passwords secure. A hash is stored in a database that is hashed with an algorithm, so not everyone can see exactly what your password is. When you type your password into a website, it doesn't actually register as words, it registers as a hash. This keeps your passwords secure so not everyone can see them. Salting is when you use random pits and attaching them to your regular hashes so not every password is the same. The salt is what ...
Father's Day cards that tell you up front that they're Father's Day cards are pretty boring. After all, about 95% of these cards either say "Happy Father's Day" on the front or inside.
Ah, bunting. In the crafting/Etsy world, bunting is one of the simplest pieces of decor to make as well as one of the cheapest, yet because of its minimalistic simplicity it's also one of the prettiest crafts ever.
While the iPad can do many things, it is missing the ability to be controlled by anything other than a finger. This can be frustrating if you would like to use your iPad for more intricate activities such as drawing or designing.
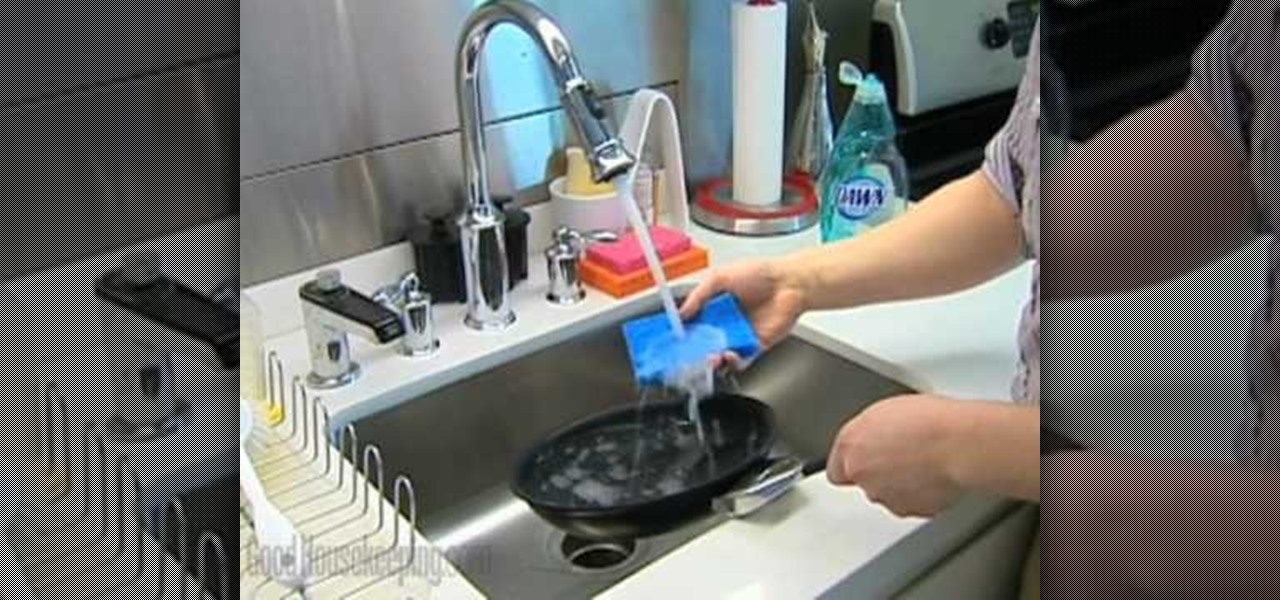
Non-stick cookware is a great way to cook and not have to deal with foods that stick to regular pans or deal with the cleaning up after cooking. A few rules to keep in mind are to not preheat a non-stick pan and do not use a heat level above medium. If you break or damage the surface of the pan, it could cause more damage than you think. There have been reports where you could develop flu-like symptoms just from cooking with a bad pan.
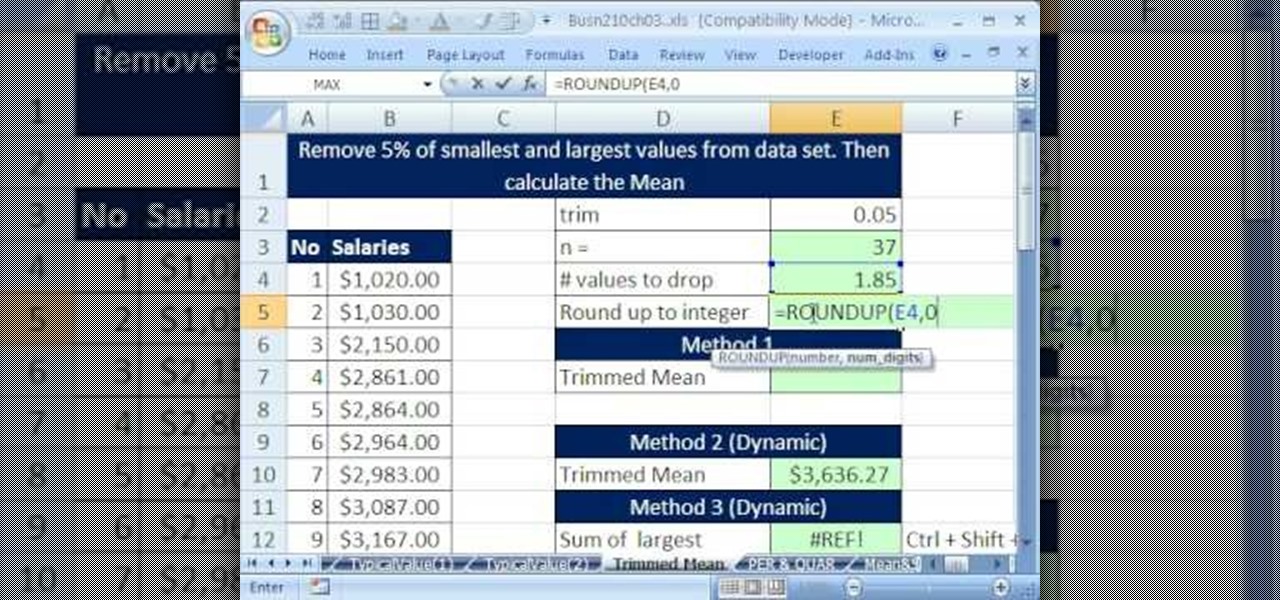
If you use Microsoft Excel on a regular basis, odds are you work with numbers. Put those numbers to work. Statistical analysis allows you to find patterns, trends and probabilities within your data. In this MS Excel tutorial from everyone's favorite Excel guru, YouTube's ExcelsFun, the 36th installment in his "Excel Statistics" series of free video lessons, you'll learn how to calculate a trimmed mean, which is used when there are extreme values in the data set that might skew the mean.
If you use Microsoft Excel on a regular basis, odds are you work with numbers. Put those numbers to work. Statistical analysis allows you to find patterns, trends and probabilities within your data. In this MS Excel tutorial from everyone's favorite Excel guru, YouTube's ExcelsFun, the 39th installment in his "Excel Statistics" series of free video lessons, you'll learn about variability (or dispersion or spread). Create an X-Y Scatter Diagram chart showing data points and the mean.
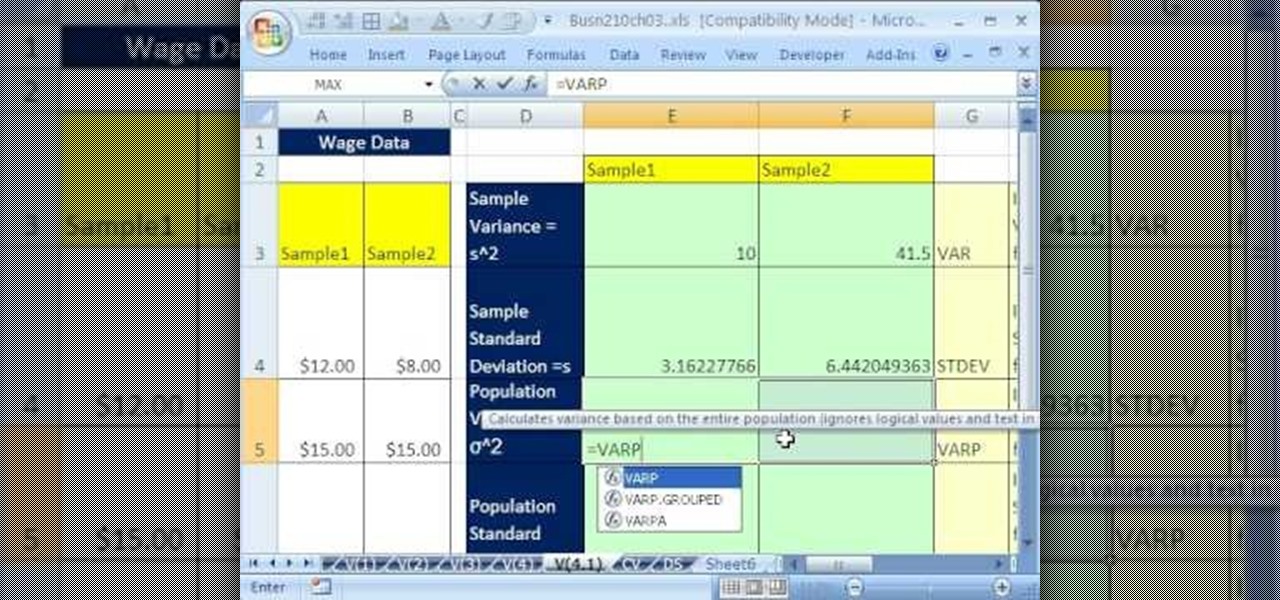
If you use Microsoft Excel on a regular basis, odds are you work with numbers. Put those numbers to work. Statistical analysis allows you to find patterns, trends and probabilities within your data. In this MS Excel tutorial from everyone's favorite Excel guru, YouTube's ExcelsFun, the 41st installment in his "Excel Statistics" series of free video lessons, you'll learn how to calculate deviations, variance and standard deviation for a sample and a population using Excel tables and the VAR, S...
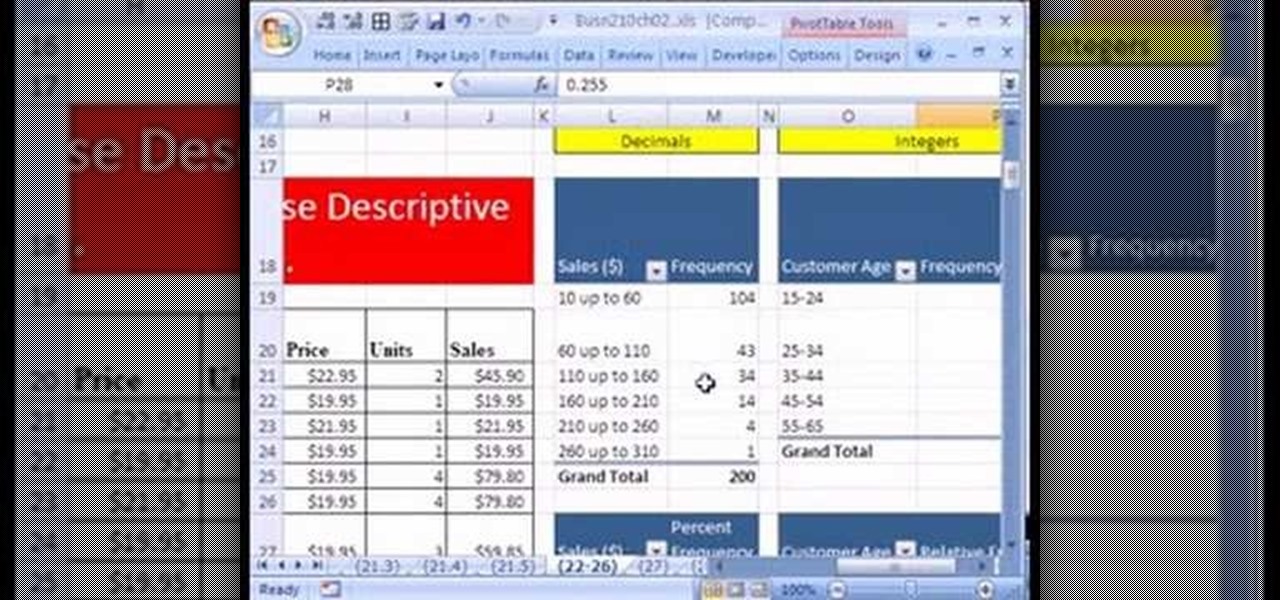
If you use Microsoft Excel on a regular basis, odds are you work with numbers. Put those numbers to work. Statistical analysis allows you to find patterns, trends and probabilities within your data. In this MS Excel tutorial from everyone's favorite Excel guru, YouTube's ExcelsFun, the 32nd installment in his "Excel Statistics" series of free video lessons, you'll learn how to group when the quantitative data are whole numbers, integers or discrete data and how to group when the quantitative ...
If you use Microsoft Excel on a regular basis, odds are you work with numbers. Put those numbers to work. Statistical analysis allows you to find patterns, trends and probabilities within your data. In this MS Excel tutorial from everyone's favorite Excel guru, YouTube's ExcelsFun, the 25th installment in his "Excel Statistics" series of free video lessons, you'll learn how to create quantitative data percent & relative frequency distributions with pivot tables. Also see how to create a histo...
If you use Microsoft Excel on a regular basis, odds are you work with numbers. Put those numbers to work. Statistical analysis allows you to find patterns, trends and probabilities within your data. In this MS Excel tutorial from everyone's favorite Excel guru, YouTube's ExcelsFun, the 22nd installment in his "Excel Statistics" series of free video lessons, you'll learn how to create a percent (%) cumulative frequency distribution with formulas, a histogram and an ogive chart. See how to add ...