At the beginning of regular gameplay in Grand Theft Auto 5, you play the role of Michael robbing a bank in North Yankton with his accomplices—shooting police and evading a high-speed train in the process. While you do revisit North Yankton during regular gameplay in Los Santos, it's strangely unavailable for online play.
Free trials are a great way to test out products before a purchase, or simply for the exploitation of free stuff for that limited amount of time. Some trials last a few days and some last even a month or two, but no matter what—these trials will always expire. But like most things in life, there is a way to get around such limitations.
Improve your customer service by mastering the ABCs of customer service--attitude, business knowledge, and customer-oriented customer service--with expert training tips in this free online customer service training video series.
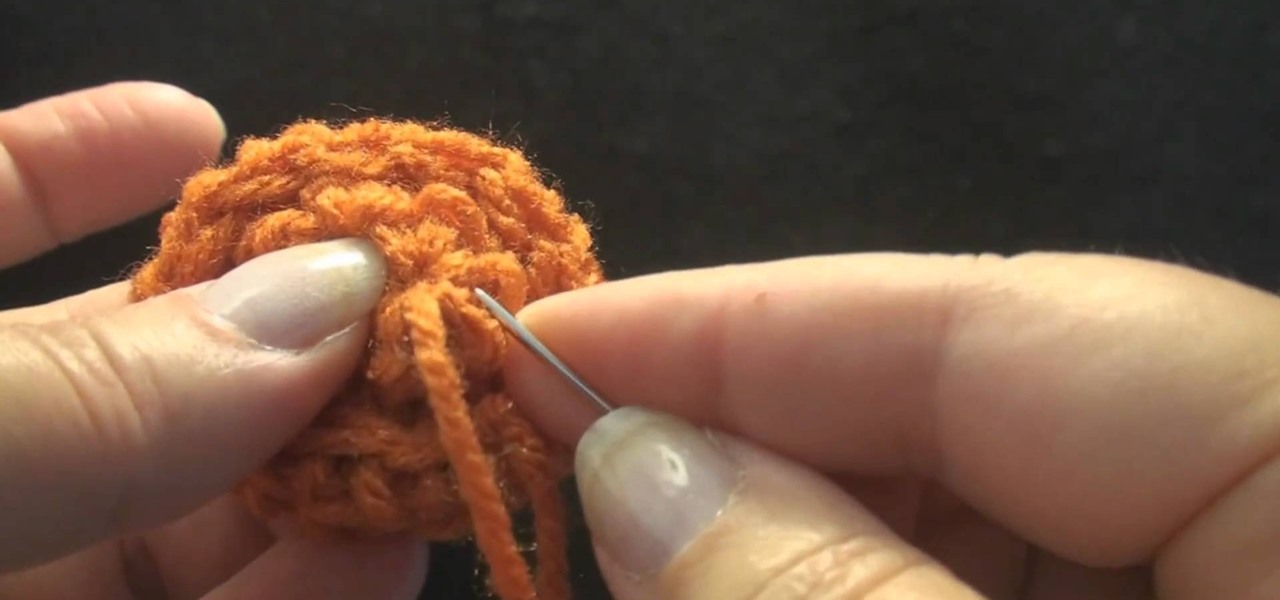
You don't have to buy buttons - just crochet your own! These buttons are naturally much softer than regular buttons, making them ideal for blankets or baby clothes. They also can add a cute accent to nearly any crochet project.
Make spinning 3D animations of spirographs, DNA, wormholes, spirals and tubes using Adobe Flash and Actionscript 3 in this video from the flashbuilding tutorial series designed for the regular guy and ordinary folks.

Don't let your window pane become a window pain in the ass to look at. Windows should give us clear views of the beautiful world outside, but without regular maintence they can become splotchy and muddled. Check out this video for a quick way to clearn your windows.

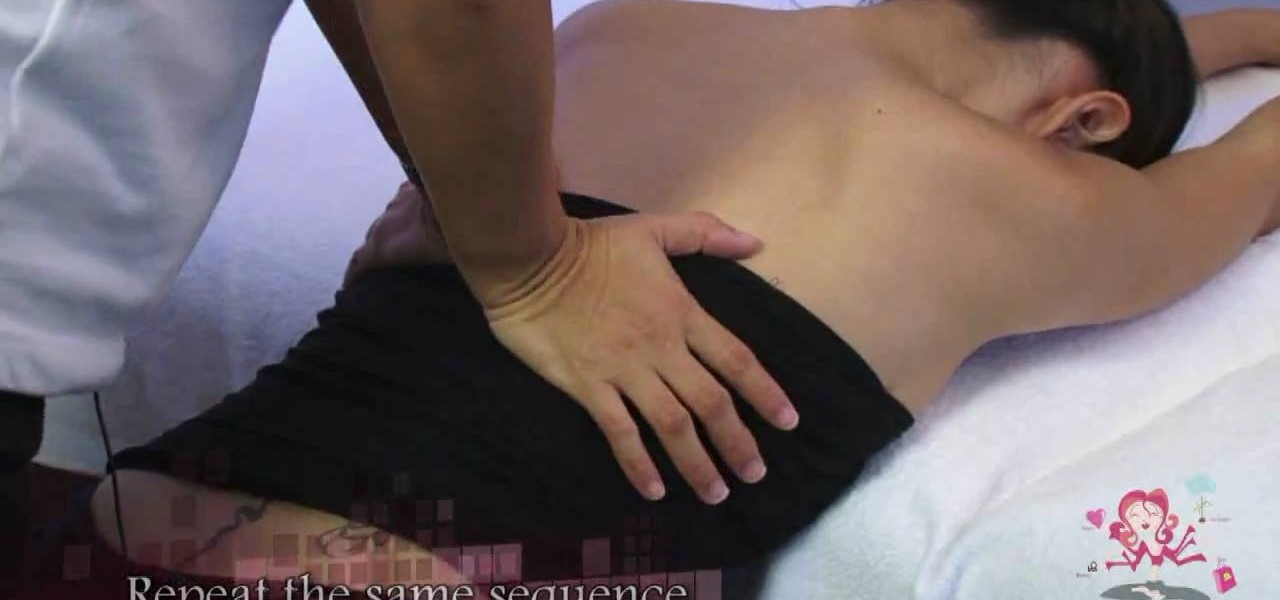
With constant Twitter updates, grueling commutes home, and a neverending workday, it's no wonder more and more of us have anxiety and stress on a regular basis. While you may not be able to just call it quits for a week and hit Fiji for some scuba fun, you can relive stress temporarily with a massage.
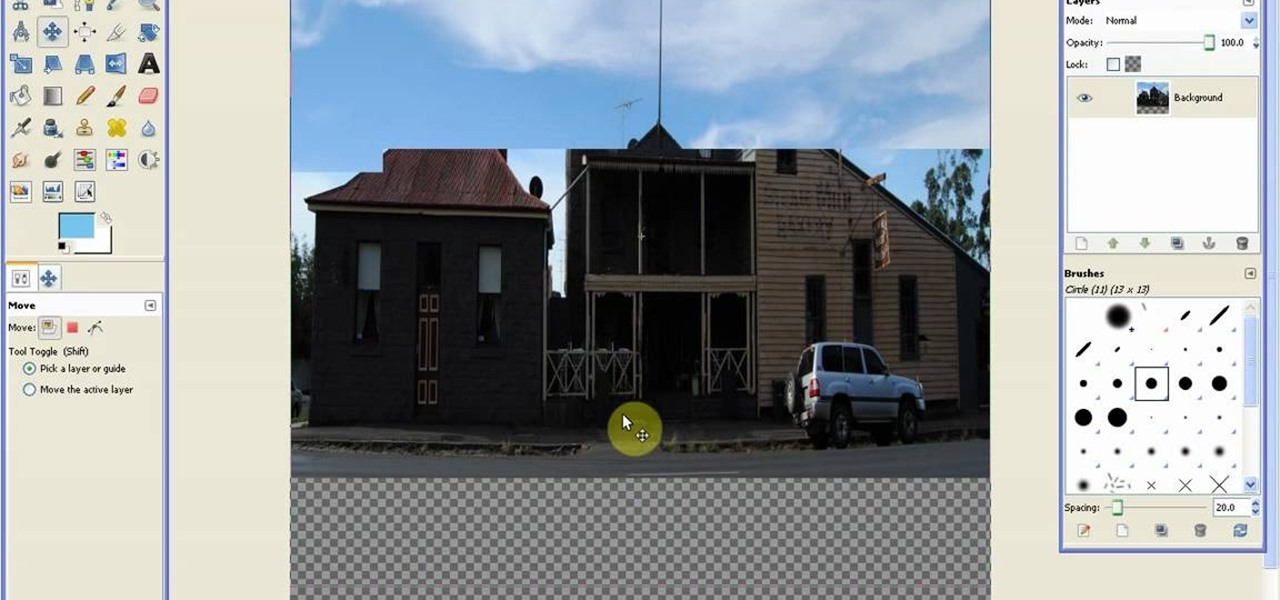
Polar panorama has images radiating out from the center of the picture. Starting with a regular panoramic image, this tutorial shows you how to use the free GIMP image editing software to create this 'polar panorama' effect for your next project.
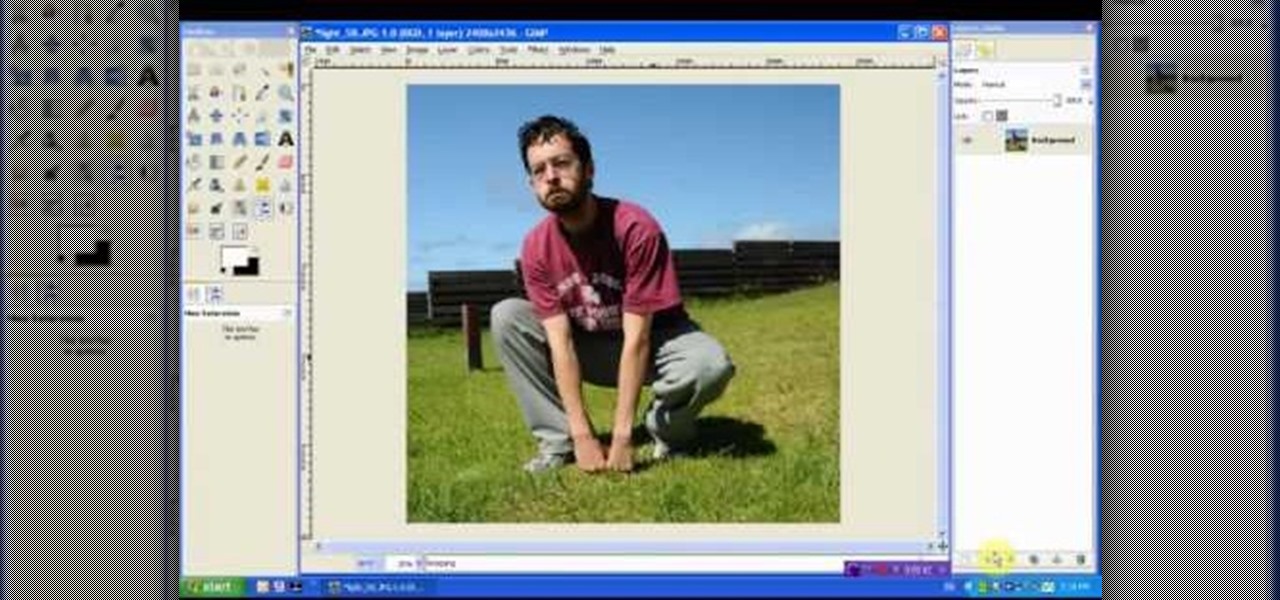
Turn a photograph of a regular person into an image of everyone's favorite muscular green psychopath! Using the hue slider, saturation tool and the Iwarp function, you can distort your picture in GIMP to make it look like a picture of Hulk instead.
Though rodents may have a bad reputation, a rat can make a great pet for kids. Rats need a good sized cage, lots of toys and regular trips to the vet to maintain their teeth and make sure they don't get sick. Follow these tips to keep your new pet happy and healthy!
Want to cut down on belly flab? Do you want a flatter, more attractive stomach? Use these workout tips to improve your abs! You can do a few of these exercises, like crunches or sit-ups, each day, and you'll be a regular fitness guru in no time!
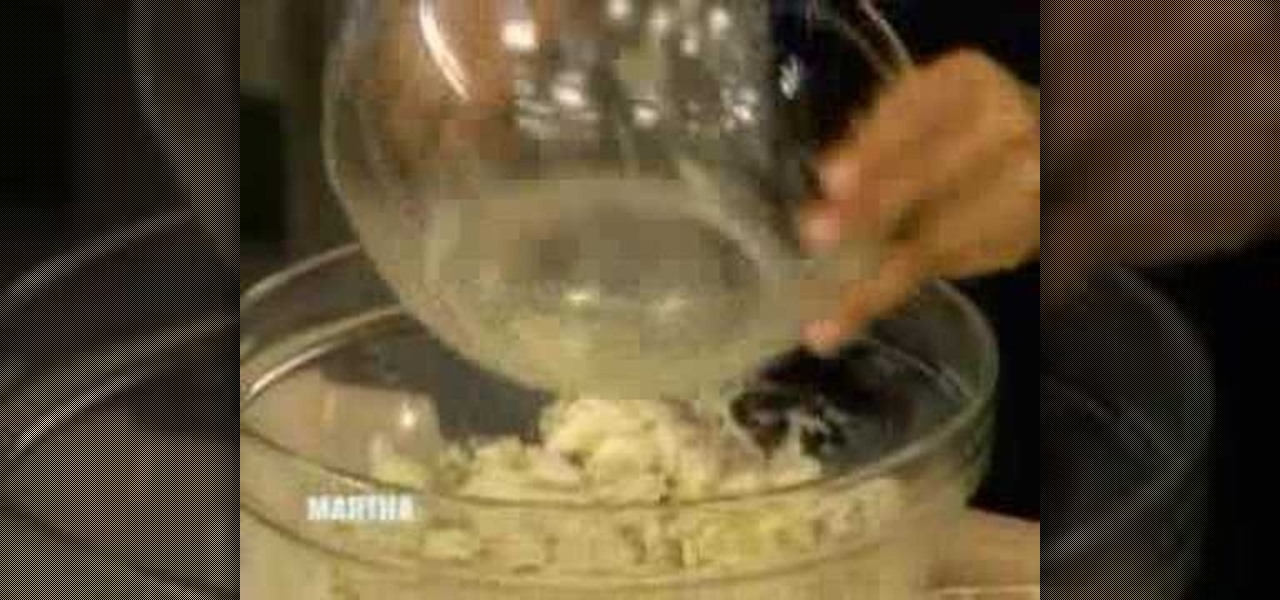
Making crabcakes for a summer get together on the beach is a yummy, season-appropriate way to integrate the goodies of the ocean into your cooking. Entertain with a delicious plate of Maryland crabcakes by watching this segment of "The Martha Stewart Show."
Need a summertime craft to do with your kids to keep their sundazed, lackadaisical minds occupied for a few moments? Then these ice cream cone soaps are just the thing!
If you're looking for an easy way to give your short hair waves and fullness, watch as this video demonstrates how to do so using a straightener and taking inspiration from the character Jenna Maroney (Jane Krakowski) of the show 30 Rock. Now all you need is Tina Fey and Alec Baldwin at your side and your a regular celebrity. Enjoy!
If you use Microsoft Excel on a regular basis, odds are you work with numbers. Put those numbers to work. Statistical analysis allows you to find patterns, trends and probabilities within your data. In this MS Excel tutorial from everyone's favorite Excel guru, YouTube's ExcelsFun, the 45th installment in his "Excel Statistics" series of free video lessons, you'll learn how to see how to calculate a z-score.
If you use Microsoft Excel on a regular basis, odds are you work with numbers. Put those numbers to work. Statistical analysis allows you to find patterns, trends and probabilities within your data. In this MS Excel tutorial from everyone's favorite Excel guru, YouTube's ExcelsFun, the 35.2nd installment in his "Excel Statistics" series of free video lessons, you'll learn how to use Excel's GEOMEAN function to find geometric mean.
If you use Microsoft Excel on a regular basis, odds are you work with numbers. Put those numbers to work. Statistical analysis allows you to find patterns, trends and probabilities within your data. In this MS Excel tutorial from everyone's favorite Excel guru, YouTube's ExcelsFun, the 40th installment in his "Excel Statistics" series of free video lessons, you'll learn how to calculate range & interquartile range for variability using the MAX, MIN, QUARTILE functions.
If you use Microsoft Excel on a regular basis, odds are you work with numbers. Put those numbers to work. Statistical analysis allows you to find patterns, trends and probabilities within your data. In this MS Excel tutorial from everyone's favorite Excel guru, YouTube's ExcelsFun, the 86th installment in his "Excel Statistics" series of free video lessons, you'll learn how to construct confidence intervals for proportions using NORMSINV function and other formulas.
If you use Microsoft Excel on a regular basis, odds are you work with numbers. Put those numbers to work. Statistical analysis allows you to find patterns, trends and probabilities within your data. In this MS Excel tutorial from everyone's favorite Excel guru, YouTube's ExcelsFun, the 87th installment in his "Excel Statistics" series of free video lessons, you'll learn how to calculate sample size (n) for confidence intervals.
If you use Microsoft Excel on a regular basis, odds are you work with numbers. Put those numbers to work. Statistical analysis allows you to find patterns, trends and probabilities within your data. In this MS Excel tutorial from everyone's favorite Excel guru, YouTube's ExcelsFun, the 27th installment in his "Excel Statistics" series of free video lessons, you'll learn how to create a quantitative data dot plot chart using the REPT and COUNTIF functions.
If you use Microsoft Excel on a regular basis, odds are you work with numbers. Put those numbers to work. Statistical analysis allows you to find patterns, trends and probabilities within your data. In this MS Excel tutorial from everyone's favorite Excel guru, YouTube's ExcelsFun, the 26th installment in his "Excel Statistics" series of free video lessons, you'll learn how to create quantitative data cumulative frequency distributions with pivot tables.
If you use Microsoft Excel on a regular basis, odds are you work with numbers. Put those numbers to work. Statistical analysis allows you to find patterns, trends and probabilities within your data. In this MS Excel tutorial from everyone's favorite Excel guru, YouTube's ExcelsFun, the 16th installment in his "Excel Statistics" series of free video lessons, you'll learn how to cross tabulate & do percentage cross tabulation for categorical data using a pivot table (PivotTable).
If you use Microsoft Excel on a regular basis, odds are you work with numbers. Put those numbers to work. Statistical analysis allows you to find patterns, trends and probabilities within your data. In this MS Excel tutorial from everyone's favorite Excel guru, YouTube's ExcelsFun, the 19th installment in his "Excel Statistics" series of free video lessons, you'll learn how to group categories in a frequency distribution with a formula (2 COUNTIF) and the pivot table (PivotTable) grouping fea...
If you use Microsoft Excel on a regular basis, odds are you work with numbers. Put those numbers to work. Statistical analysis allows you to find patterns, trends and probabilities within your data. In this MS Excel tutorial from everyone's favorite Excel guru, YouTube's ExcelsFun, the 17th installment in his "Excel Statistics" series of free video lessons, you'll learn how to cross tabulate & do percentage cross tabulation for categorical data using formulas rather than pivot tables.
If you use Microsoft Excel on a regular basis, odds are you work with numbers. Put those numbers to work. Statistical analysis allows you to find patterns, trends and probabilities within your data. In this MS Excel tutorial from everyone's favorite Excel guru, YouTube's ExcelsFun, the 3rd installment in his "Excel Statistics" series of free video lessons, you'll learn how to use Excel's sorting and pivot tables (PivotTables) data analysis tools.
If you use Microsoft Excel on a regular basis, odds are you work with numbers. Put those numbers to work. Statistical analysis allows you to find patterns, trends and probabilities within your data. In this MS Excel tutorial from everyone's favorite Excel guru, YouTube's ExcelsFun, the 35th installment in his "Excel Statistics" series of free video lessons, you'll learn how to calculate weighted and geometric means and see how to use the GEOMEAN function.
If you use Microsoft Excel on a regular basis, odds are you work with numbers. Put those numbers to work. Statistical analysis allows you to find patterns, trends and probabilities within your data. In this MS Excel tutorial from everyone's favorite Excel guru, YouTube's ExcelsFun, the 33rd installment in his "Excel Statistics" series of free video lessons, you'll learn how to use the AVEARGE, MEDIAN, MODE, PERCENTILE, QUARTILE and PERCENTILERANK functions to measure location.
If you use Microsoft Excel on a regular basis, odds are you work with numbers. Put those numbers to work. Statistical analysis allows you to find patterns, trends and probabilities within your data. In this MS Excel tutorial from everyone's favorite Excel guru, YouTube's ExcelsFun, the 4th installment in his "Excel Statistics" series of free video lessons, you'll learn how to create a frequency table and percentage frequency table using a Pivot Table (PivotTable).
Want to remove dried wax from a carpet? You'll need four items: a white towel, a regular electric iron, a carpet cleaning solution and a hot-water extraction machine. For a complete, step-by-step demonstration of how to remove pesky paraffin wax stains from your own carpet, watch this free housekeeping video tutorial.
This excellent tutorial shows you exactly what you have to do to crochet your very own crotchet stocking, using your left hand. This extensive video shows you the quickest and easiest way to crocheting your own hat to wear, for special and regular occasions.
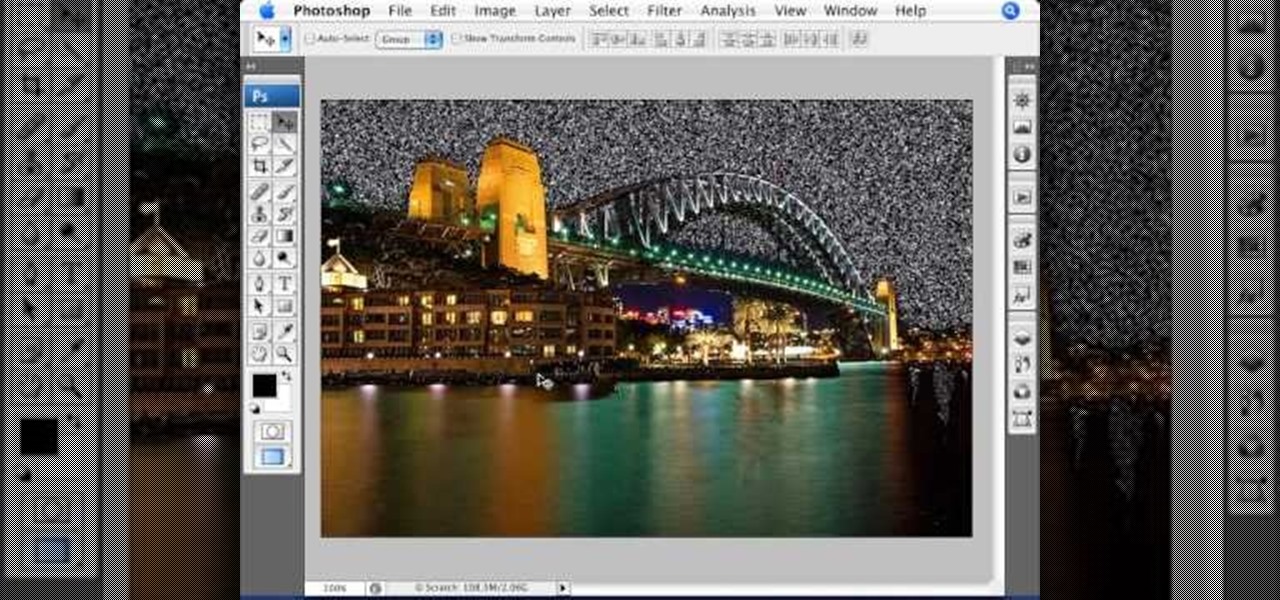
The video is a Photoshop tutorial teaching how to create the starry sky effect, an effect that turn regular sky in a photo into a starry night sky using the Adobe Photoshop software. This effect is created by the use of Photoshop filters like noise, blur, levels and masking in order to achieve the look of a real night sky. By following the tutorial you will learn how to create and control the amount of stars in the photo's sky in only 6 minutes.
Cassettes take up quite a bit of space, and can sometimes start showing wear, which can affect the sound. This video shows you how to take this information from your cassettes, and move them on to a CD. Detailed instructions, and photos in this video, will have you transferring analog information into a digital format within just minutes. This allows you to be able to use the audio recording on your computer, as well as being able to listen to it in a regular CD player.
Regular cleaning of your laptop computer is easy, and might save you tons of trouble in the long run. Learn how to clean your laptop with a homemade solution.
Using ASP.NET Secure Services and Applications Services
It's easier than you'd think to prevent hemorrhoids. With a little exercise, attention to diet, and a change in habits, you can become hemorrhoid-free.
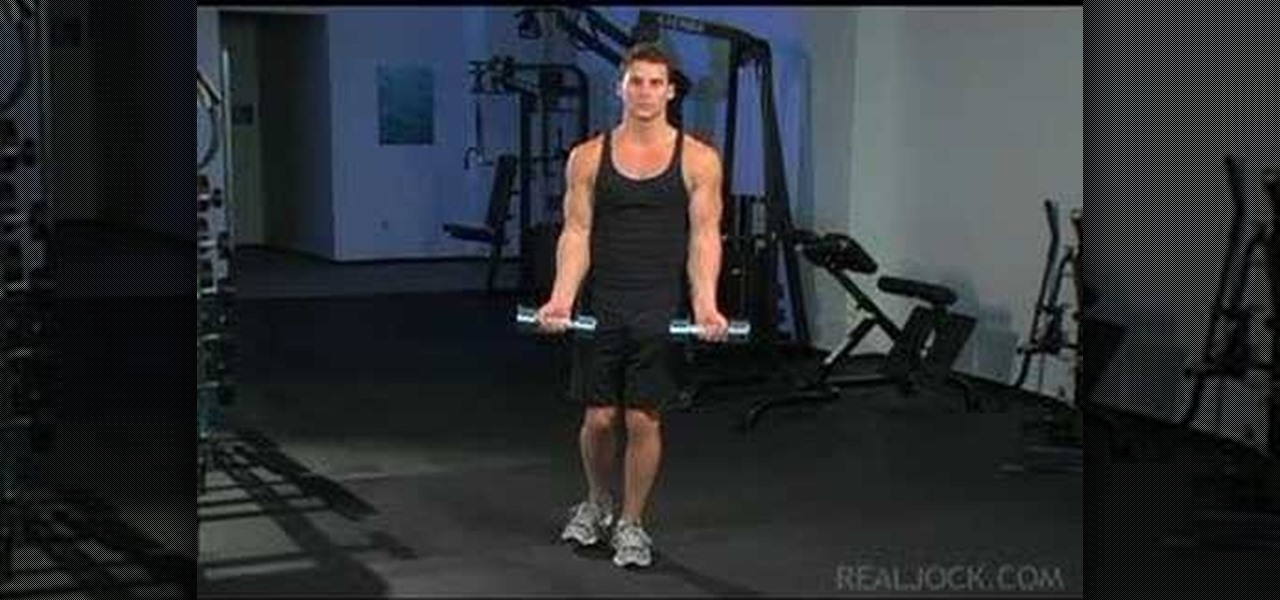
Learn how to do single-leg twisting dumbbell curls. Presented by Real Jock Gay Fitness Health & Life.
Learn how to do speed dumbbell twisting curls. Presented by Real Jock Gay Fitness Health & Life. Benefits
All you need is a regular mechanical pencil and a bunch of staples. Then follow this short tutorial and learn how to turn your basic pencil into a staple-shooting gun. Make sure the pencil you choose can easily have the cap screwed off.
Much better for you than a regular candy cane! You will need some red and white yarn, a pipe cleaner and a size 'I' 5.5 milimeter crochet hook. This candy cane makes a great little gift, tree ornamnet or stocking stuffer!
Jazz walks are basically regular walking combined with a tiptoeing motion that makes the walk like a cat strut. Jazz walks are beautiful and sexy ways to transition from one part of your routine to another, and they're also great as coreography of their own.