If you use Microsoft Excel on a regular basis, odds are you work with numbers. Put those numbers to work. Statistical analysis allows you to find patterns, trends and probabilities within your data. In this MS Excel tutorial from everyone's favorite Excel guru, YouTube's ExcelsFun, the 13th installment in his "Excel Statistics" series of free video lessons, you'll learn how to install the Excel 2007 Data Analysis add-in.

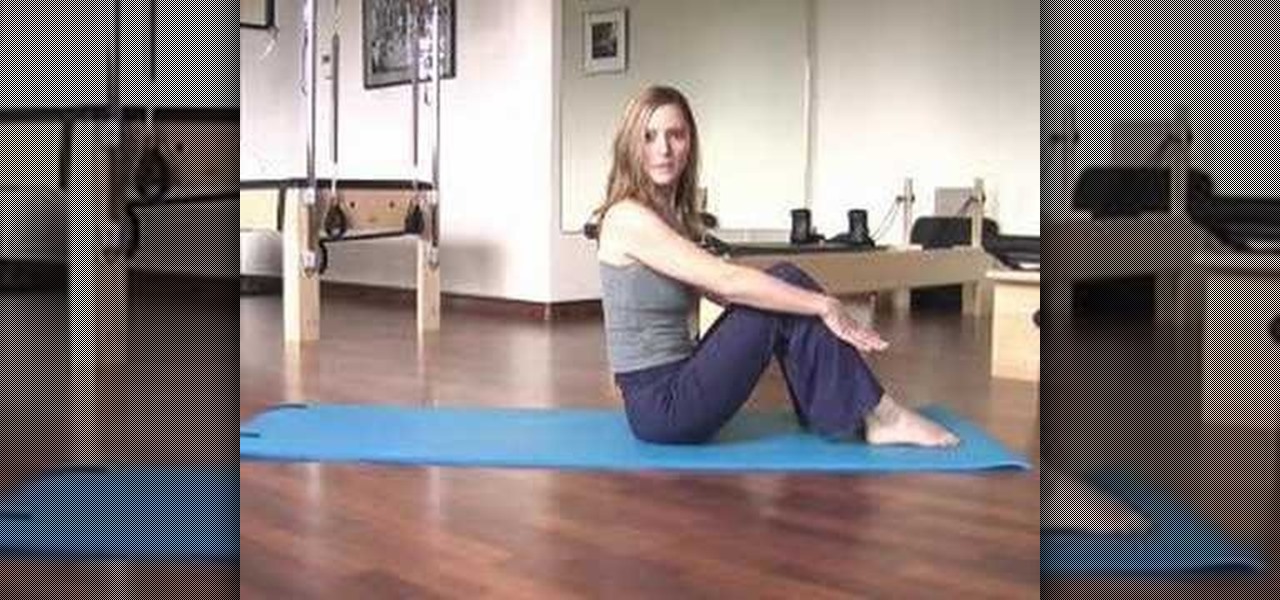
The Hundred is a classic piece of pilates that’s not only great for your body, but is as easy as one, two, three…
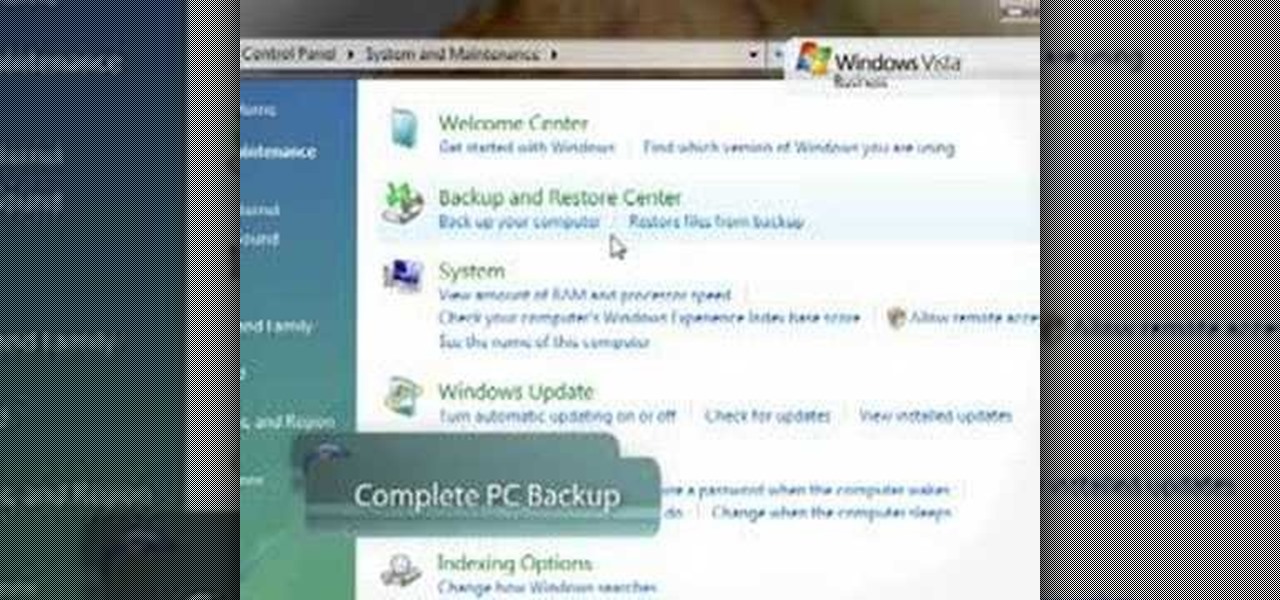
While many people back up their important files on a regular basis, few back up their entire computer. If your computer were to crash or be damaged, reinstalling the software for your system can mean hours or days of downtime. In this video tutorial, you'll learn how to use the PC Backup and Restore features in Microsoft Windows Vista. Take a look.
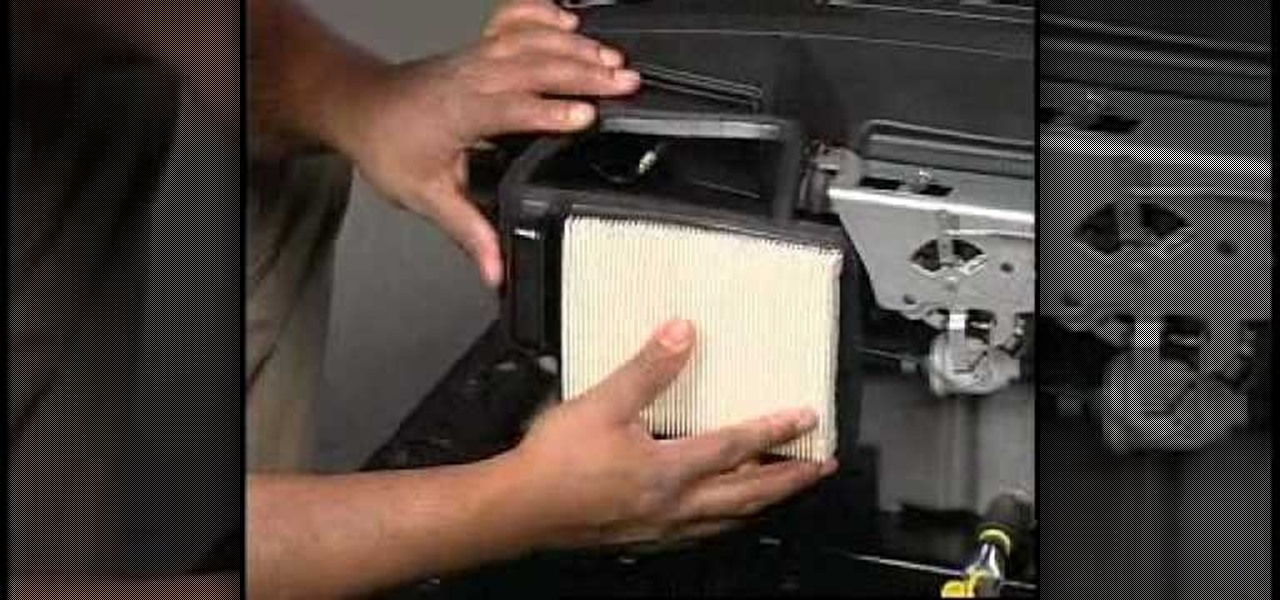
You can do the basic engine care - such as changingJust like a car, a lawn tractor is an expensive piece of hardware that should be properly maintained on a regular basis. Not only does it need a regular oil change and tune up, but it needs to be cleaned as well in order to maximize its efficiency.

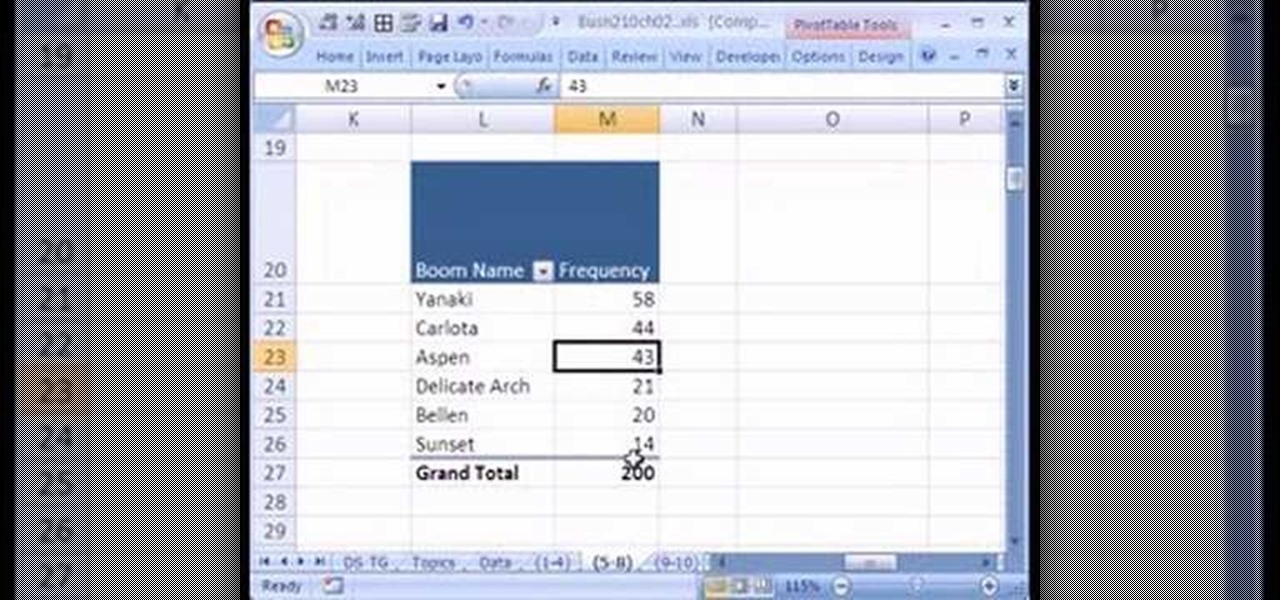
If you use Microsoft Excel on a regular basis, odds are you work with numbers. Put those numbers to work. Statistical analysis allows you to find patterns, trends and probabilities within your data. In this MS Excel tutorial from everyone's favorite Excel guru, YouTube's ExcelsFun, the 24th installment in his "Excel Statistics" series of free video lessons, you'll learn how to create quantitative data frequency distributions with pivot tables. See how to create the correct unambiguous labels ...

If you use Microsoft Excel on a regular basis, odds are you work with numbers. Put those numbers to work. Statistical analysis allows you to find patterns, trends and probabilities within your data. In this MS Excel tutorial from everyone's favorite Excel guru, YouTube's ExcelsFun, the 12th installment in his "Excel Statistics" series of free video lessons, you'll learn how to use Advanced Filter 'Unique Records Only" to extract a list of unique items from a data base, and then use the COUNTI...

If you use Microsoft Excel on a regular basis, odds are you work with numbers. Put those numbers to work. Statistical analysis allows you to find patterns, trends and probabilities within your data. In this MS Excel tutorial from everyone's favorite Excel guru, YouTube's ExcelsFun, the 92nd installment in his "Excel Statistics" series of free video lessons, you'll learn how to use the TINV and TDIST functions to test a hypothesis.
If you use Microsoft Excel on a regular basis, odds are you work with numbers. Put those numbers to work. Statistical analysis allows you to find patterns, trends and probabilities within your data. In this MS Excel tutorial from everyone's favorite Excel guru, YouTube's ExcelsFun, the 85th installment in his "Excel Statistics" series of free video lessons, you'll learn how to construct confidence intervals for proportions using NORMSINV function and other formulas.
In this pilates how-to video you are shown two exercises which strengthen and stretch your upper body. Learn to open your shoulders by doing the overhead and shoulder stretch on a regular basis. They can be done with a wooden pole or a thera-band. If you don't have either available you can use bathrobe belt or leash to do pilates shoulder stretches.
The pilates teaser exercise is tough. This pilates how-to video demonstrates some prep exercises to help you master this challenging exercise. Do the prep work for the teaser on a regular basis to work your way up to the full version of the teaser movement.
It doesn't take a nutritionist to know that eating too much meat is not good for your body. From hormones added to the feed for cows and chickens to contamination from bacteria, it's a good idea to integrate lighter vegetable dishes into your diet on a regular basis.
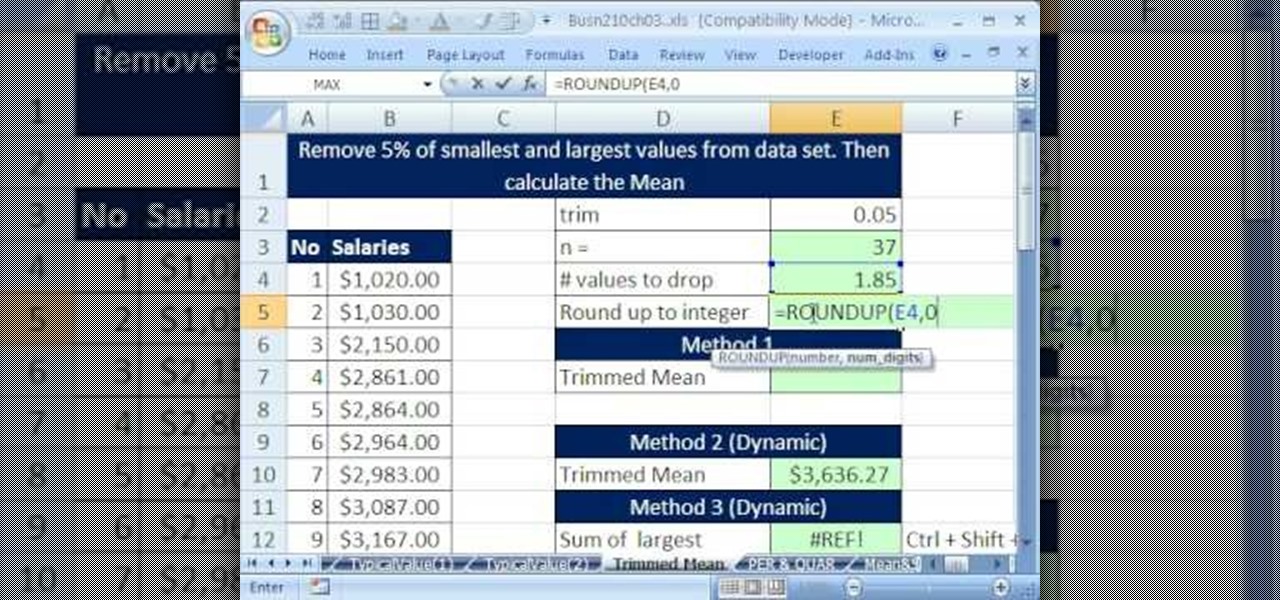
If you use Microsoft Excel on a regular basis, odds are you work with numbers. Put those numbers to work. Statistical analysis allows you to find patterns, trends and probabilities within your data. In this MS Excel tutorial from everyone's favorite Excel guru, YouTube's ExcelsFun, the 36th installment in his "Excel Statistics" series of free video lessons, you'll learn how to calculate a trimmed mean, which is used when there are extreme values in the data set that might skew the mean.
If you use Microsoft Excel on a regular basis, odds are you work with numbers. Put those numbers to work. Statistical analysis allows you to find patterns, trends and probabilities within your data. In this MS Excel tutorial from everyone's favorite Excel guru, YouTube's ExcelsFun, the 39th installment in his "Excel Statistics" series of free video lessons, you'll learn about variability (or dispersion or spread). Create an X-Y Scatter Diagram chart showing data points and the mean.
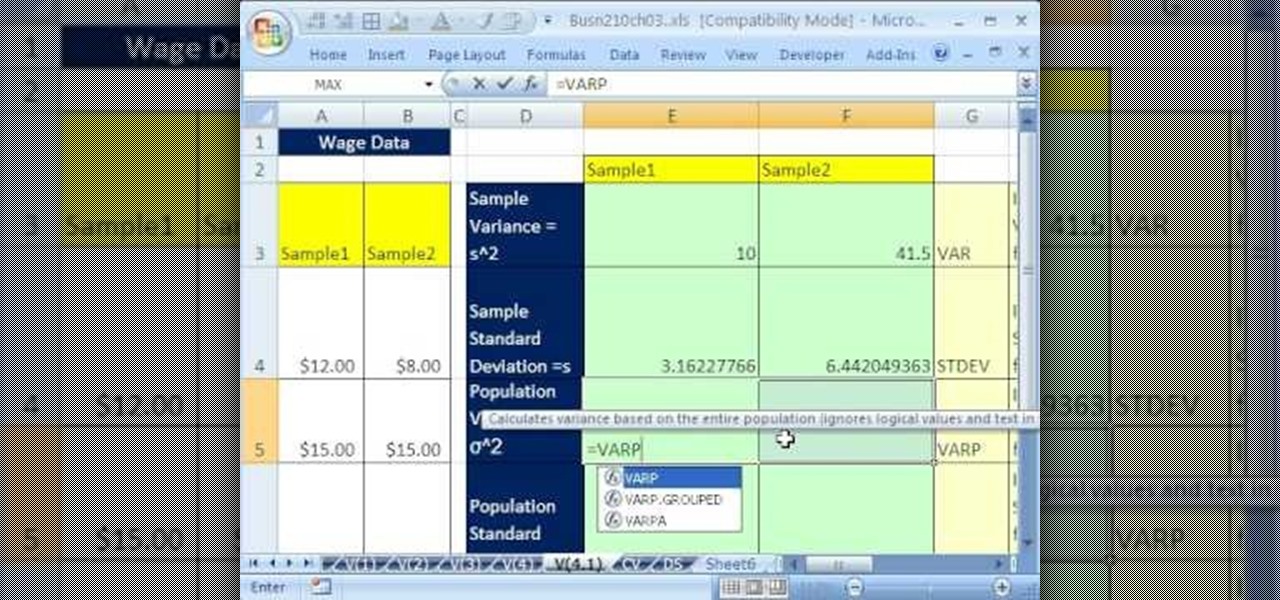
If you use Microsoft Excel on a regular basis, odds are you work with numbers. Put those numbers to work. Statistical analysis allows you to find patterns, trends and probabilities within your data. In this MS Excel tutorial from everyone's favorite Excel guru, YouTube's ExcelsFun, the 41st installment in his "Excel Statistics" series of free video lessons, you'll learn how to calculate deviations, variance and standard deviation for a sample and a population using Excel tables and the VAR, S...
If you use Microsoft Excel on a regular basis, odds are you work with numbers. Put those numbers to work. Statistical analysis allows you to find patterns, trends and probabilities within your data. In this MS Excel tutorial from everyone's favorite Excel guru, YouTube's ExcelsFun, the 32nd installment in his "Excel Statistics" series of free video lessons, you'll learn how to group when the quantitative data are whole numbers, integers or discrete data and how to group when the quantitative ...
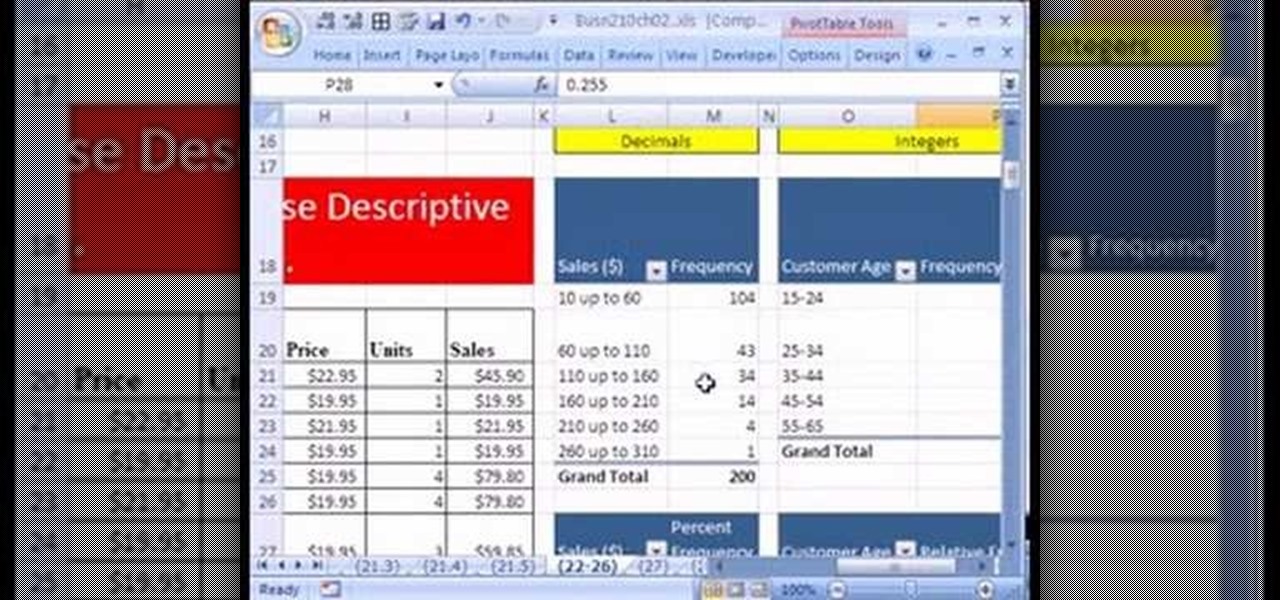
If you use Microsoft Excel on a regular basis, odds are you work with numbers. Put those numbers to work. Statistical analysis allows you to find patterns, trends and probabilities within your data. In this MS Excel tutorial from everyone's favorite Excel guru, YouTube's ExcelsFun, the 25th installment in his "Excel Statistics" series of free video lessons, you'll learn how to create quantitative data percent & relative frequency distributions with pivot tables. Also see how to create a histo...
If you use Microsoft Excel on a regular basis, odds are you work with numbers. Put those numbers to work. Statistical analysis allows you to find patterns, trends and probabilities within your data. In this MS Excel tutorial from everyone's favorite Excel guru, YouTube's ExcelsFun, the 22nd installment in his "Excel Statistics" series of free video lessons, you'll learn how to create a percent (%) cumulative frequency distribution with formulas, a histogram and an ogive chart. See how to add ...
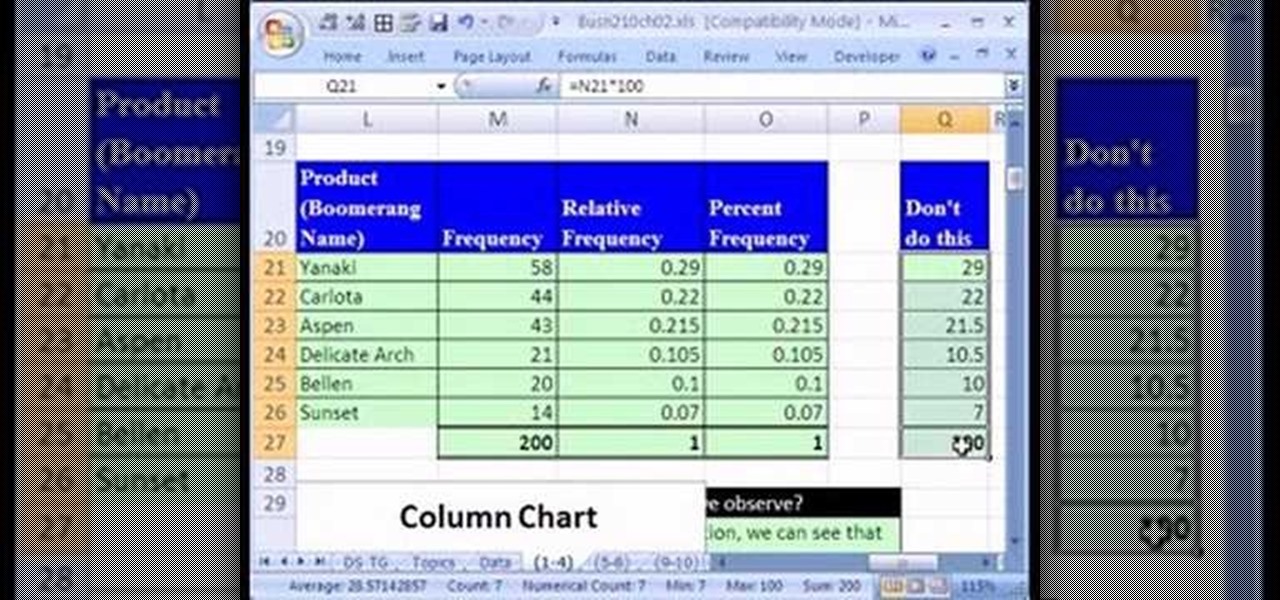
If you use Microsoft Excel on a regular basis, odds are you work with numbers. Put those numbers to work. Statistical analysis allows you to find patterns, trends and probabilities within your data. In this MS Excel tutorial from everyone's favorite Excel guru, YouTube's ExcelsFun, the 15th installment in his "Excel Statistics" series of free video lessons, you'll learn how to use create a frequency distribution, relative frequency distribution, percent frequency distribution and pie chart wi...
If you use Microsoft Excel on a regular basis, odds are you work with numbers. Put those numbers to work. Statistical analysis allows you to find patterns, trends and probabilities within your data. In this MS Excel tutorial from everyone's favorite Excel guru, YouTube's ExcelsFun, the 10th installment in his "Excel Statistics" series of free video lessons, you'll learn how about data sets and the nominal, ordinal, interval and ration scales/levels of measurement and see two Pivot Tables that...
Learn how to choose and care for poinsettias with Southwest Yard and Garden's John White. You will be taken through the typical height and specifications for poinsettias, as well as what to look for in the leaves and flowers. One of the most important parts of growing poinsettias is keeping to a specific schedule. Measuring the plants is also important as plants that are too tall or too short are undesirable. Remember to frequently water the plants, but be careful not to overwater. Also, keep...
One of the most important things about a car is the constant need to check the oil. This is an essential part of the car that will make sure it keeps going for years and years. Not checking the oil on a regular basis can lead to damage to your engine.
If you use Microsoft Excel on a regular basis, odds are you work with numbers. Put those numbers to work. Statistical analysis allows you to find patterns, trends and probabilities within your data. In this MS Excel tutorial from everyone's favorite Excel guru, YouTube's ExcelsFun, the 47th installment in his "Excel Statistics" series of free video lessons, you'll learn how to use the NORMSINV function for critical values and the NORSDIST function for p-values. Compare building confidence int...
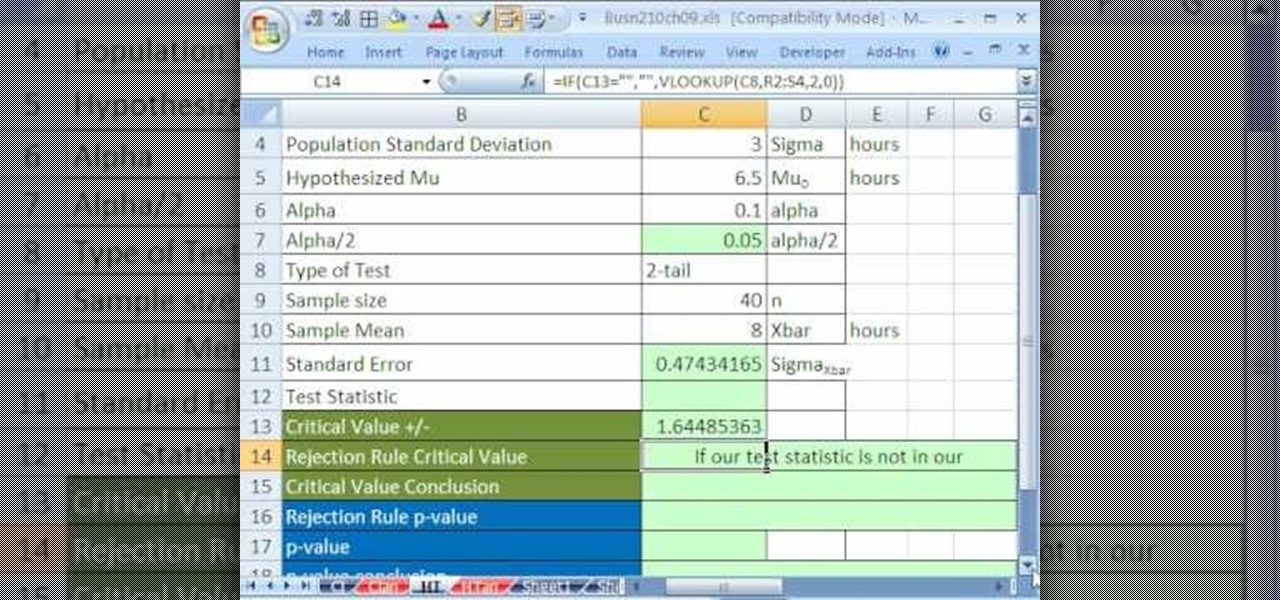
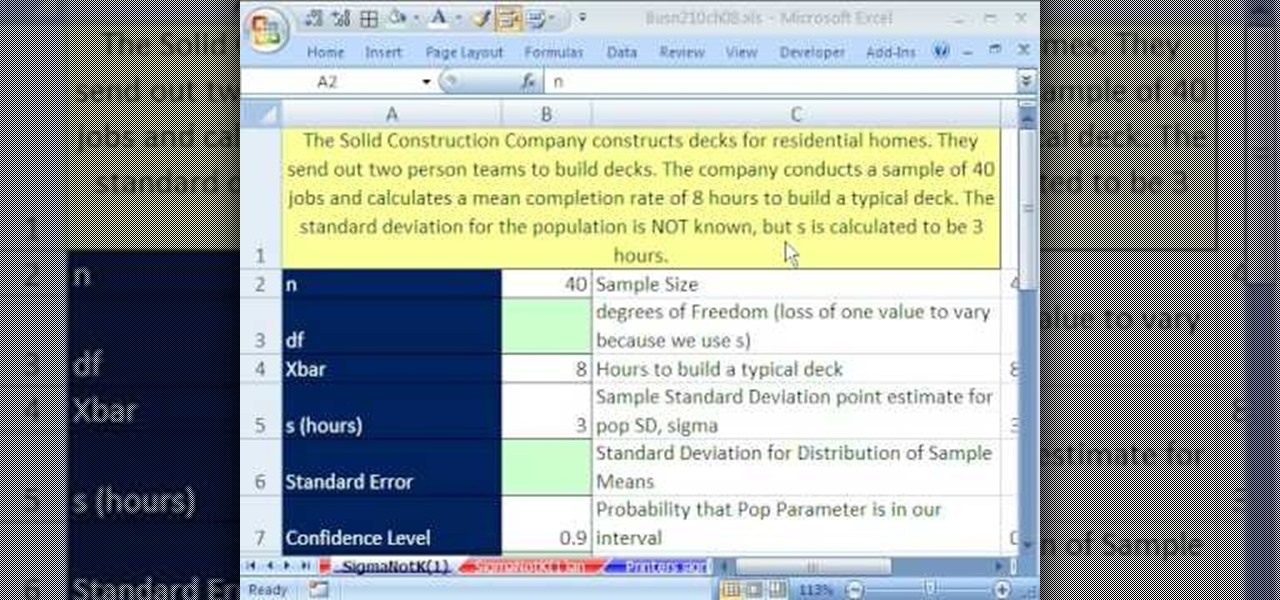
If you use Microsoft Excel on a regular basis, odds are you work with numbers. Put those numbers to work. Statistical analysis allows you to find patterns, trends and probabilities within your data. In this MS Excel tutorial from everyone's favorite Excel guru, YouTube's ExcelsFun, the 82nd installment in his "Excel Statistics" series of free video lessons, you'll learn how to construct confidence intervals when the sigma value (the population's standard deviation) in NOT Known using the TINV...
If you use Microsoft Excel on a regular basis, odds are you work with numbers. Put those numbers to work. Statistical analysis allows you to find patterns, trends and probabilities within your data. In this MS Excel tutorial from everyone's favorite Excel guru, YouTube's ExcelsFun, the very first installment in his "Excel Statistics" series of free video lessons, you'll learn how to get started doing statistical analysis in Microsoft Excel 2007.
Black Friday and Cyber Monday are becoming almost synonymous these days, but there are still plenty of awesome deals that you can only get starting on the Monday after Thanksgiving. Amazon, for instance, will be hosting a week-long Cyber Monday sale, and of course, most big-box retailers will follow suit with their online stores.
If you work with wood on a regular basis then your band saw probably gets a lot of play time. The more you use your band saw, however, the faster your band saw tire will wear out.
This is why you're fat. Coincidentally, this is also why you're happy when you nom on artery clogging junk fare. We don't recommend you whip up this recipe on a regular basis unless you're hopin' and wishin' for a heart attack this Christmas, but this would make a sweet treat every once in a while.
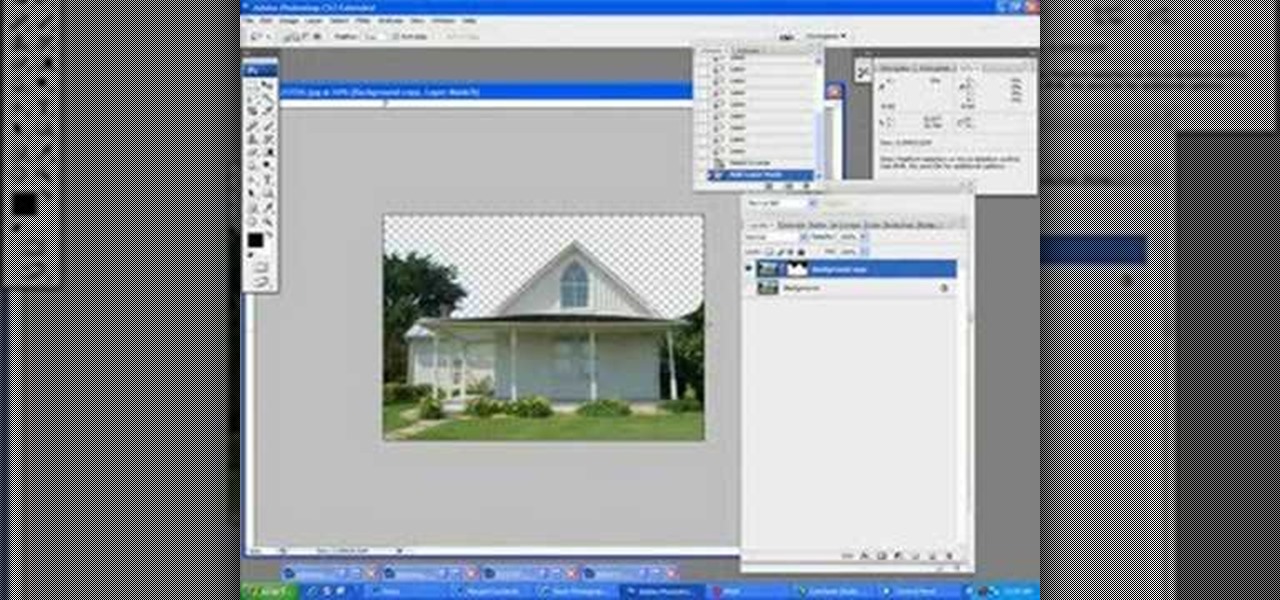
This tutorial shows you how to use Adobe Photoshop to take a regular photograph of a house and turn it into a picture of a dark haunted house. Starting with a picture from the actual painting, "American Gothic," you watch along as the farmhouse is transformed into a piece of dark gothic art.
There are 10 major ways to protect your PC. Disable Autorun, in Windows. Make sure that your system is up to date, by setting automatic updates. Always use a log on for your computer that does not have administrative privileges. Use different passwords, and change your passwords on a regular basis. Don't use simple passwords. Be careful of using links sent to you via email. Never disclose your sensitive information in public forums: e.g. social networks. Encrypt sensitive data on your compute...
If you think about it, it's actually easy to make friends and acquaintences - you move to a new town or go to college and you're immediately immersed in the culture and the people around you. Those in close proximity you'll definitely talk to an a regular basis if not establish a friendship. But true friendships which lasts years, decades, and even lifetimes are extremely hard to come by.
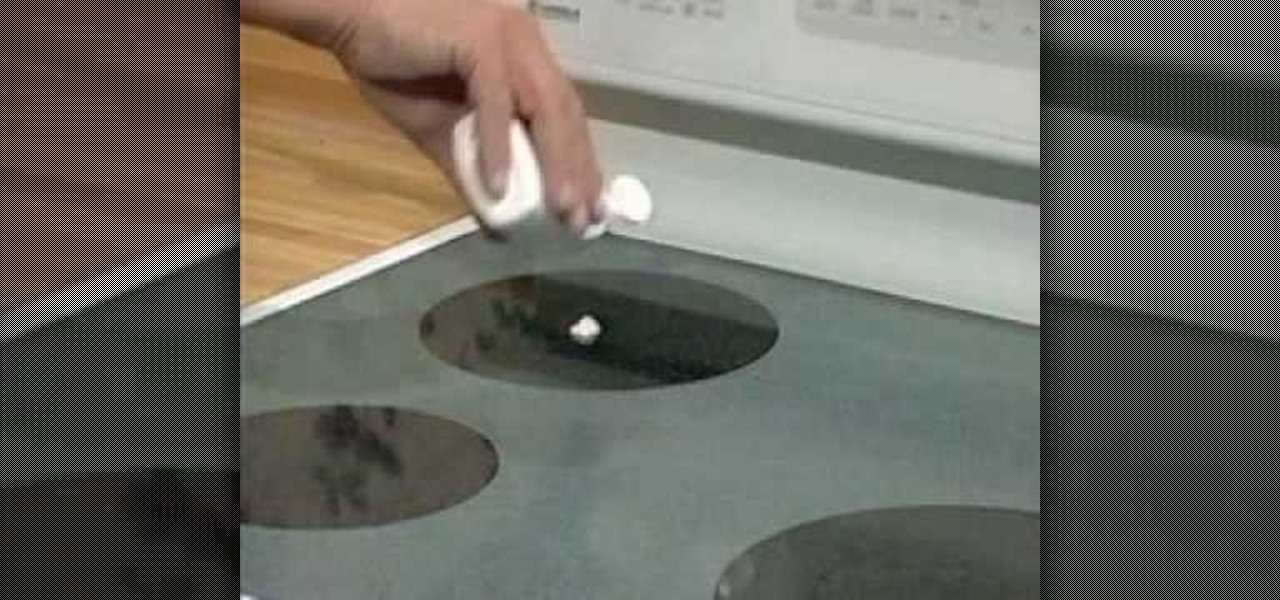
If you own a radiant cooktop, it's important that you know how to properly clean it. Not cleaning it on a regular basis or not at all, can result in damage to your beautiful surface.
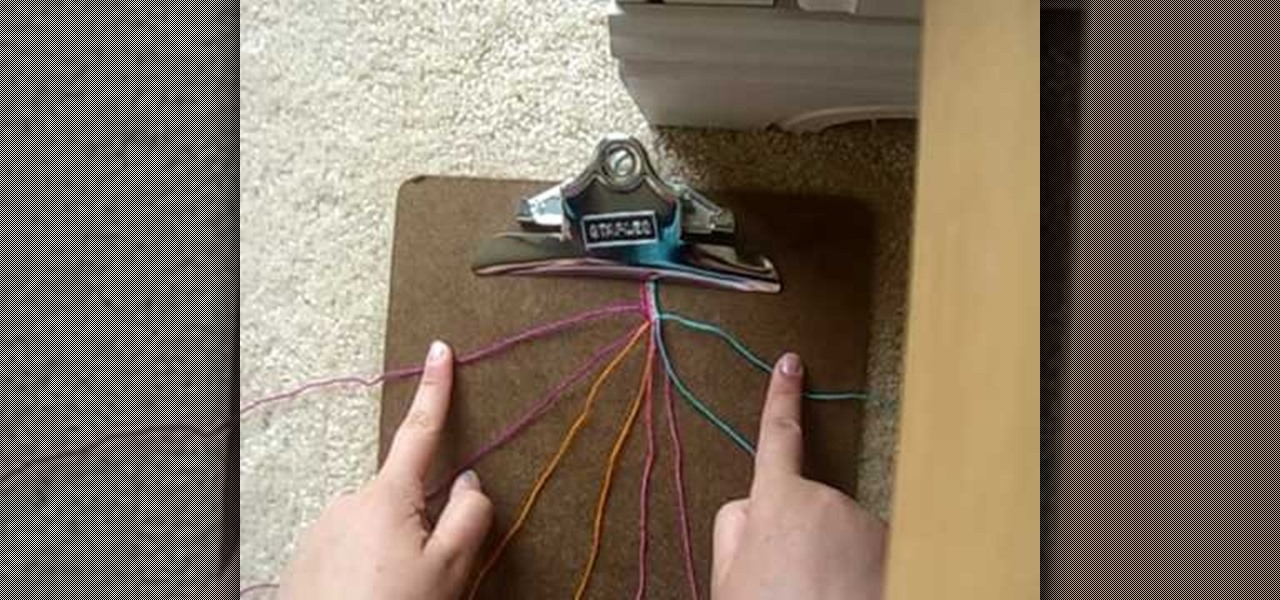
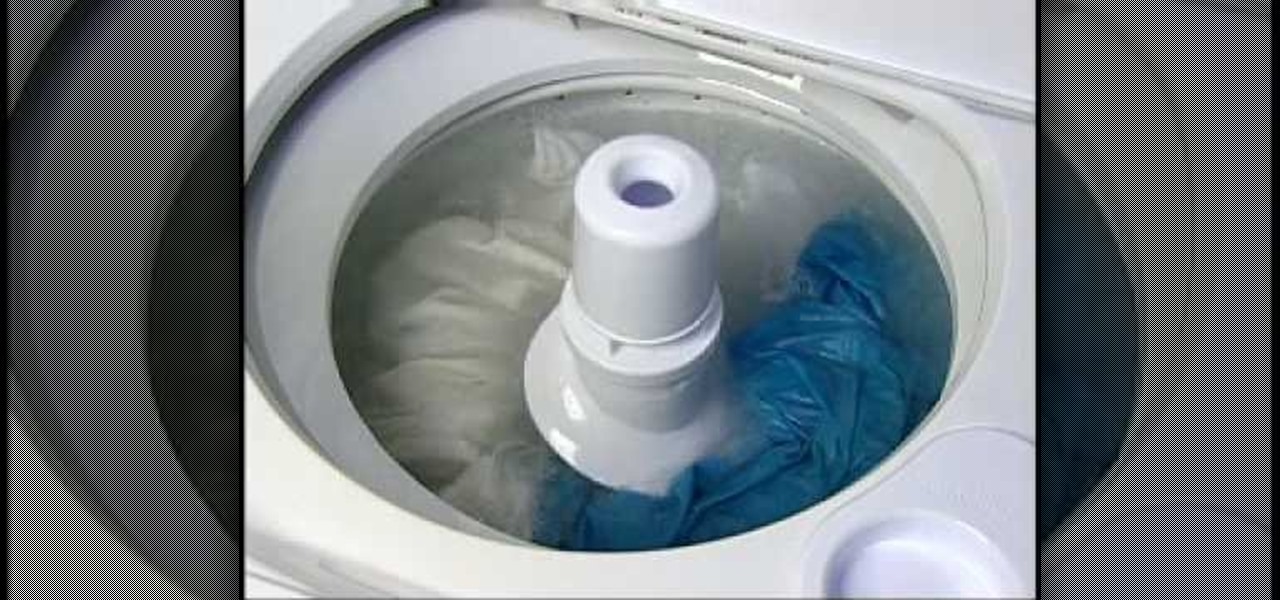
If you own a top load washing machine, you may have a problem with tangles. This can be an annoying thing that happens on a regular basis. But there is a way to help make sure that whatever you put in the washer will stay untangled.
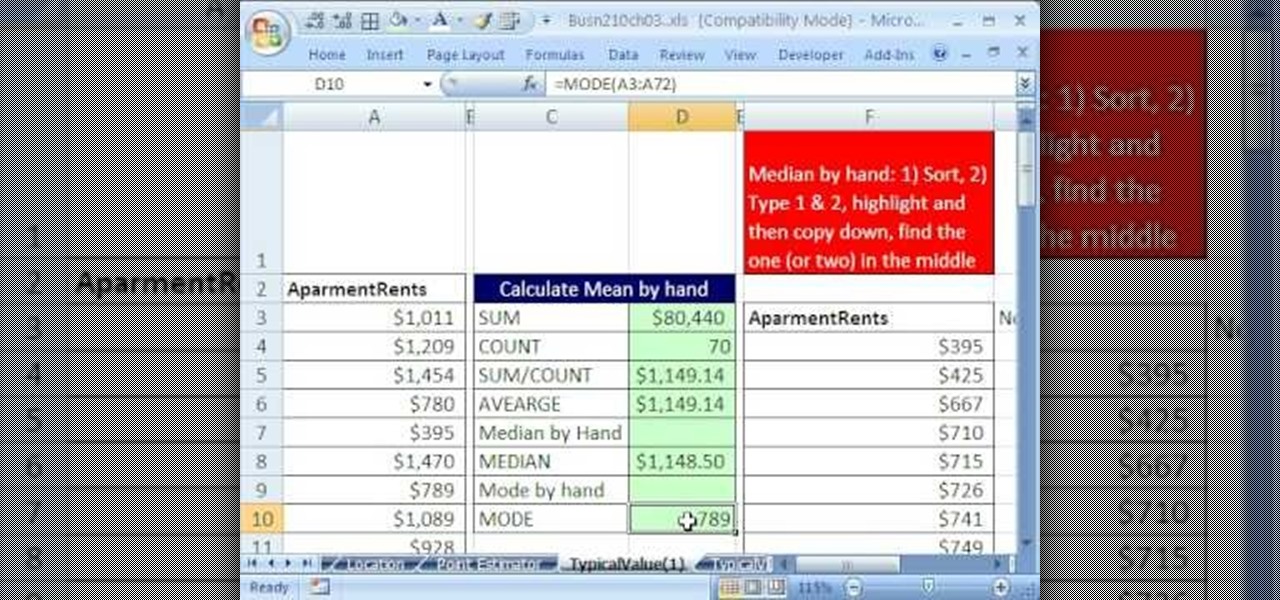
If you use Microsoft Excel on a regular basis, odds are you work with numbers. Put those numbers to work. Statistical analysis allows you to find patterns, trends and probabilities within your data. In this MS Excel tutorial from everyone's favorite Excel guru, YouTube's ExcelsFun, the 34th installment in his "Excel Statistics" series of free video lessons, you'll learn how to use MEAN, MEDIAN, MODE. These measures give us a typical value, a measure of central tendency one value that can repr...
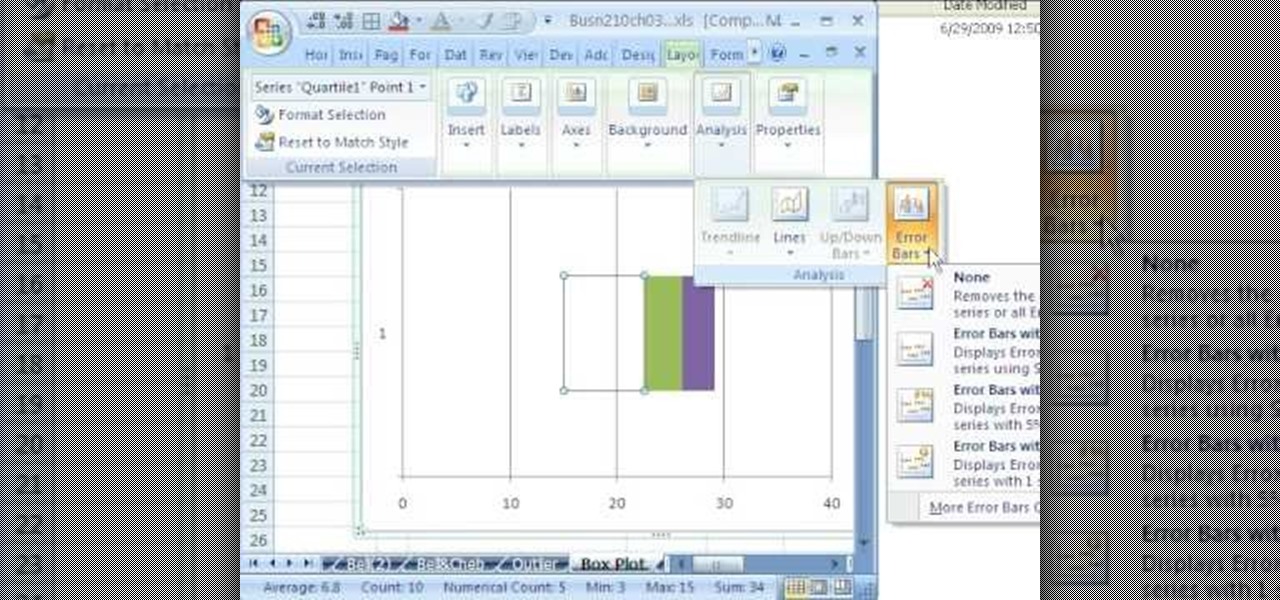
If you use Microsoft Excel on a regular basis, odds are you work with numbers. Put those numbers to work. Statistical analysis allows you to find patterns, trends and probabilities within your data. In this MS Excel tutorial from everyone's favorite Excel guru, YouTube's ExcelsFun, the 49th installment in his "Excel Statistics" series of free video lessons, you'll learn how to find outliers with the +/- 3 Z-score rule and the ABS function. See how to do a box plot by hand and in Excel. For th...
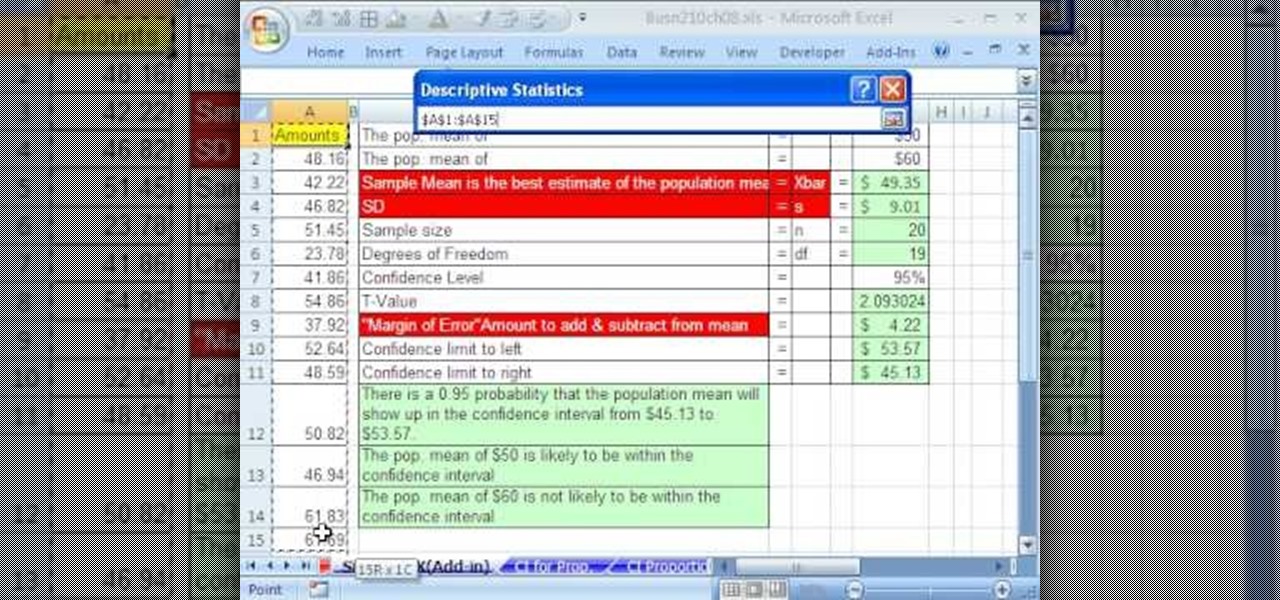
If you use Microsoft Excel on a regular basis, odds are you work with numbers. Put those numbers to work. Statistical analysis allows you to find patterns, trends and probabilities within your data. In this MS Excel tutorial from everyone's favorite Excel guru, YouTube's ExcelsFun, the 84th installment in his "Excel Statistics" series of free video lessons, you'll learn how to construct confidence intervals when the sigma is NOT known using the Descriptive Statistics data analysis add-in.
If you use Microsoft Excel on a regular basis, odds are you work with numbers. Put those numbers to work. Statistical analysis allows you to find patterns, trends and probabilities within your data. In this MS Excel tutorial from everyone's favorite Excel guru, YouTube's ExcelsFun, the 38th installment in his "Excel Statistics" series of free video lessons, you'll learn how to use the RANK and PERCENTRANK functions as well as the Data Analysis add-in's Rank & Percentile tools.
If you use Microsoft Excel on a regular basis, odds are you work with numbers. Put those numbers to work. Statistical analysis allows you to find patterns, trends and probabilities within your data. In this MS Excel tutorial from everyone's favorite Excel guru, YouTube's ExcelsFun, the 20th installment in his "Excel Statistics" series of free video lessons, you'll learn how to take raw quantitative (numerical) data and figure out how to group it into classes so that you can have categories an...
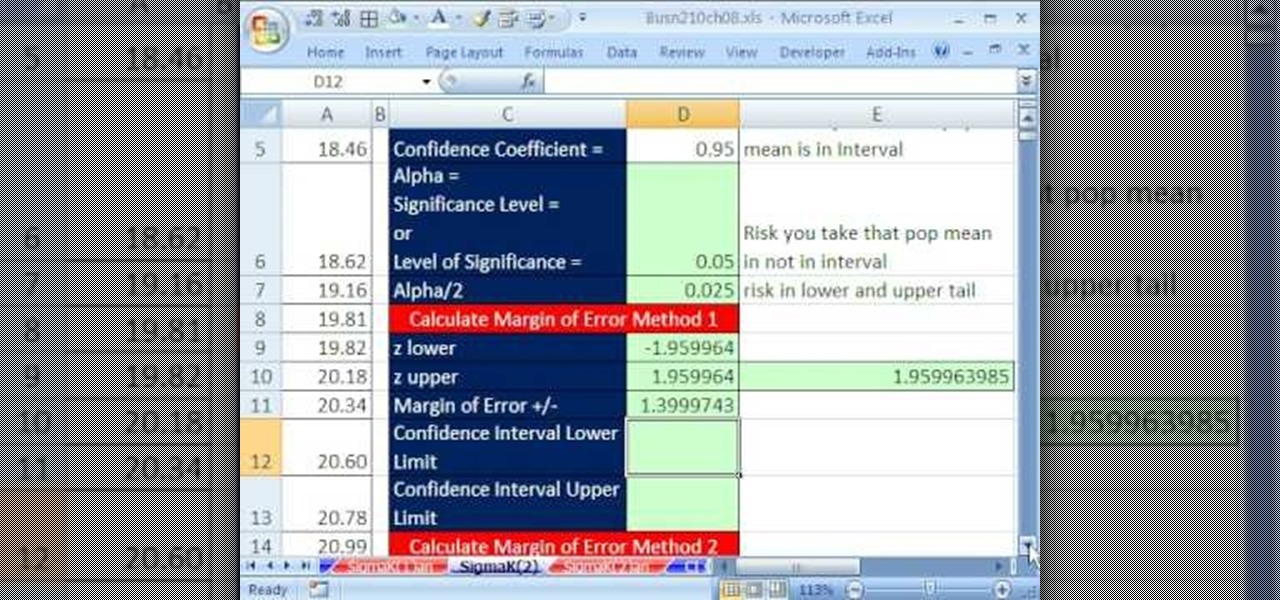
If you use Microsoft Excel on a regular basis, odds are you work with numbers. Put those numbers to work. Statistical analysis allows you to find patterns, trends and probabilities within your data. In this MS Excel tutorial from everyone's favorite Excel guru, YouTube's ExcelsFun, the 81st installment in his "Excel Statistics" series of free video lessons, you'll learn how to construct confidence intervals when the sigma (population standard deviation) is known. See how the CONFIDENCE and NO...
If you use Microsoft Excel on a regular basis, odds are you work with numbers. Put those numbers to work. Statistical analysis allows you to find patterns, trends and probabilities within your data. In this MS Excel tutorial from everyone's favorite Excel guru, YouTube's ExcelsFun, the 23rd installment in his "Excel Statistics" series of free video lessons, you'll learn how to work with skew in histograms for quantitative Data. Learn how to skew left (negative) and skew right (positive) with ...
If you use Microsoft Excel on a regular basis, odds are you work with numbers. Put those numbers to work. Statistical analysis allows you to find patterns, trends and probabilities within your data. In this MS Excel tutorial from everyone's favorite Excel guru, YouTube's ExcelsFun, the 14th installment in his "Excel Statistics" series of free video lessons, you'll learn how to create relative & percent & frequency distributions with formulas for categorical data. See, too, how to create a per...