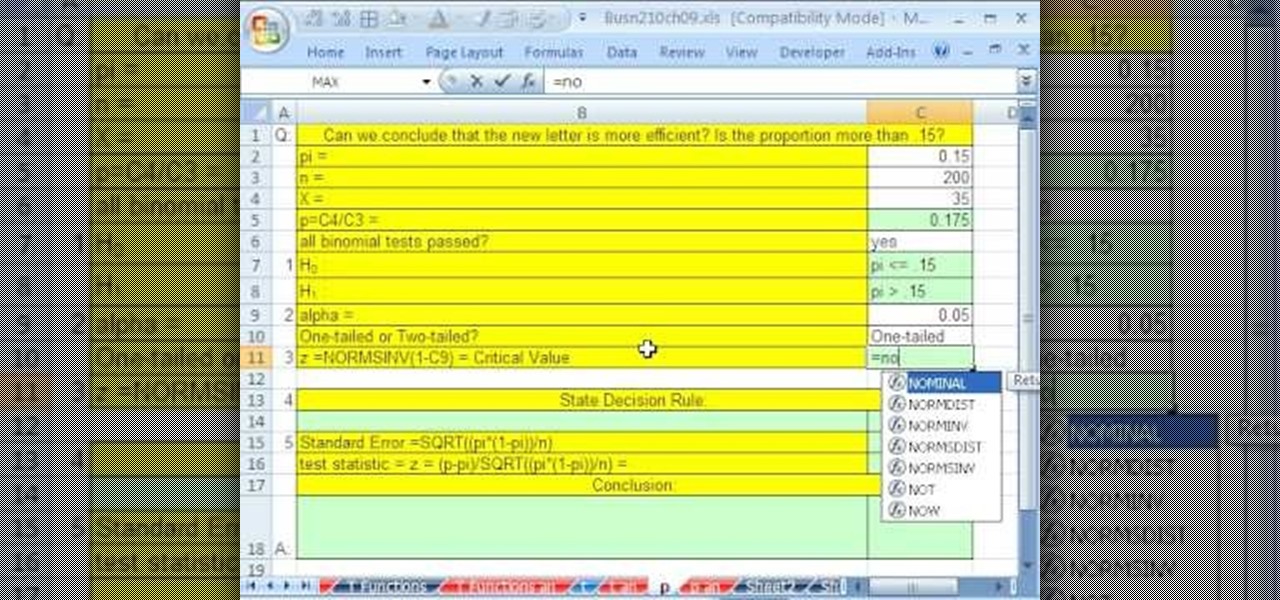
If you use Microsoft Excel on a regular basis, odds are you work with numbers. Put those numbers to work. Statistical analysis allows you to find patterns, trends and probabilities within your data. In this MS Excel tutorial from everyone's favorite Excel guru, YouTube's ExcelsFun, the 87th installment in his "Excel Statistics" series of free video lessons, you'll learn how to use NORMSINV to test a hypothesis with population standard deviation (sigma) known and proportions.

If you use Microsoft Excel on a regular basis, odds are you work with numbers. Put those numbers to work. Statistical analysis allows you to find patterns, trends and probabilities within your data. In this MS Excel tutorial from everyone's favorite Excel guru, YouTube's ExcelsFun, the 28th installment in his "Excel Statistics" series of free video lessons, you'll learn how to create quantitative data stem & leaf charts using the REPT and COUNTIF functions.

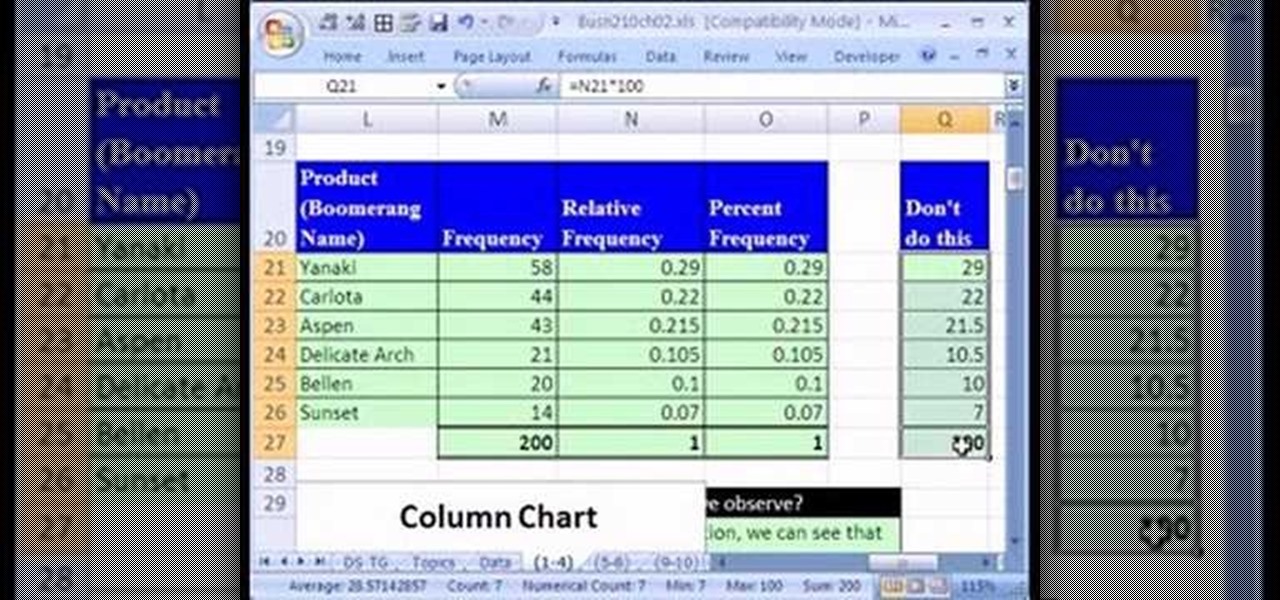
If you use Microsoft Excel on a regular basis, odds are you work with numbers. Put those numbers to work. Statistical analysis allows you to find patterns, trends and probabilities within your data. In this MS Excel tutorial from everyone's favorite Excel guru, YouTube's ExcelsFun, the 13th installment in his "Excel Statistics" series of free video lessons, you'll learn how to create a column chart from a frequency distribution for categorical data.

If you use Microsoft Excel on a regular basis, odds are you work with numbers. Put those numbers to work. Statistical analysis allows you to find patterns, trends and probabilities within your data. In this MS Excel tutorial from everyone's favorite Excel guru, YouTube's ExcelsFun, the 5th installment in his "Excel Statistics" series of free video lessons, you'll learn how to use relative and absolute cell references to save time when writing formulas.
If you use Microsoft Excel on a regular basis, odds are you work with numbers. Put those numbers to work. Statistical analysis allows you to find patterns, trends and probabilities within your data. In this MS Excel tutorial from everyone's favorite Excel guru, YouTube's ExcelsFun, the 47th installment in his "Excel Statistics" series of free video lessons, you'll learn how to use the NORMSINV function for critical values and the NORSDIST function for p-values. Compare building confidence int...
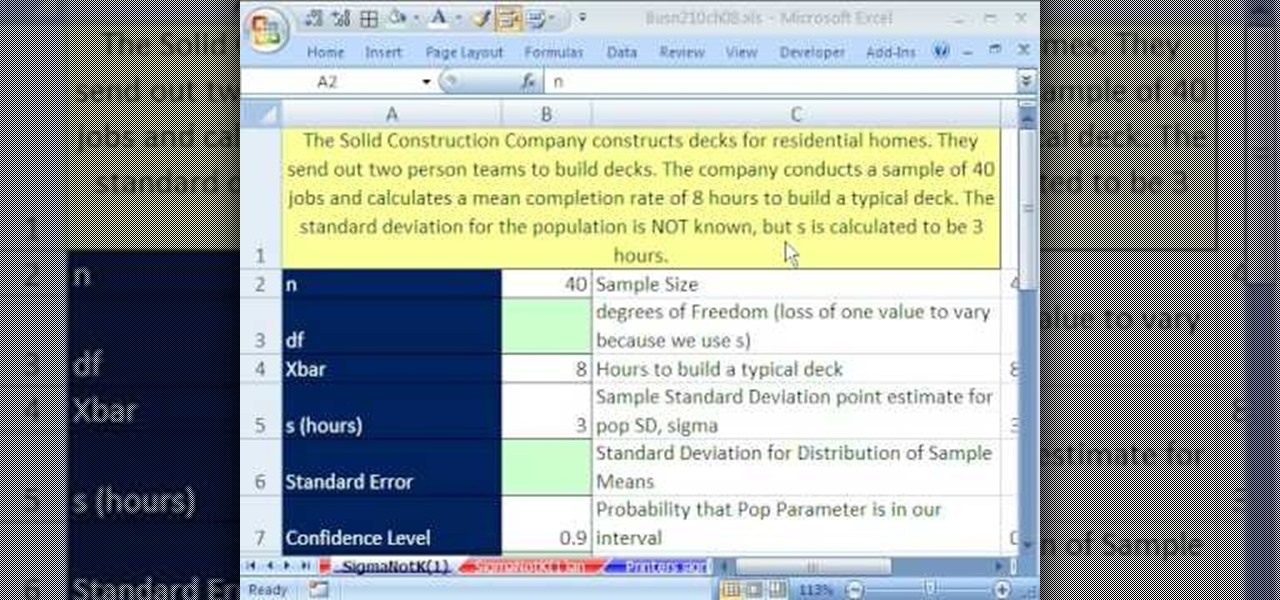
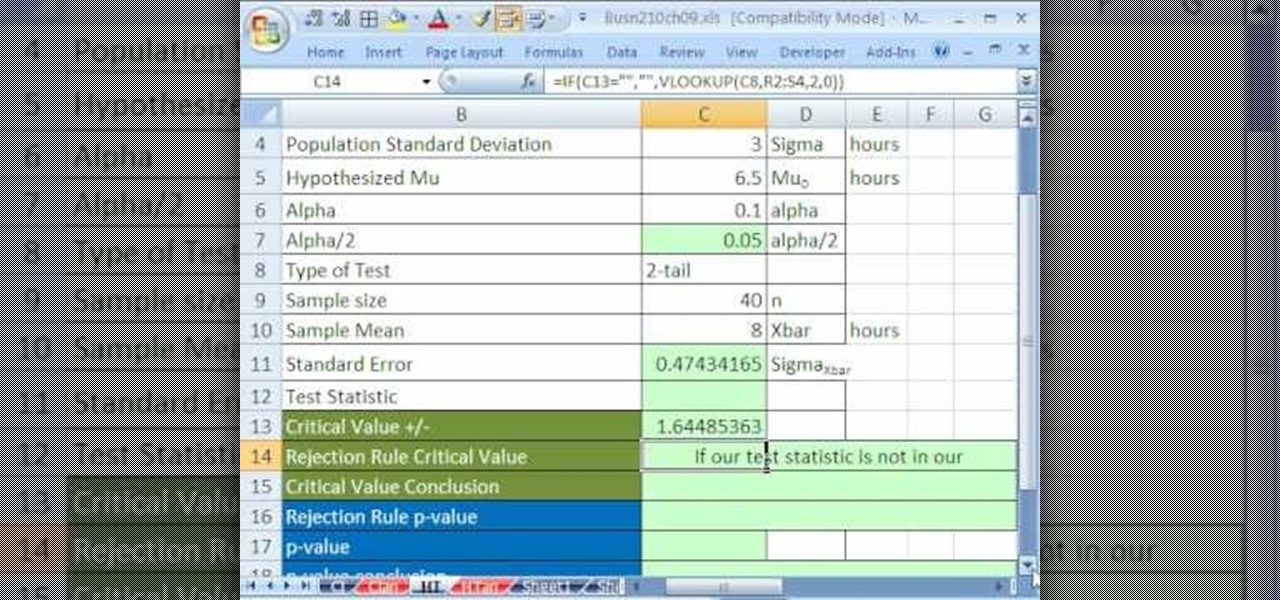
If you use Microsoft Excel on a regular basis, odds are you work with numbers. Put those numbers to work. Statistical analysis allows you to find patterns, trends and probabilities within your data. In this MS Excel tutorial from everyone's favorite Excel guru, YouTube's ExcelsFun, the 82nd installment in his "Excel Statistics" series of free video lessons, you'll learn how to construct confidence intervals when the sigma value (the population's standard deviation) in NOT Known using the TINV...

If you use Microsoft Excel on a regular basis, odds are you work with numbers. Put those numbers to work. Statistical analysis allows you to find patterns, trends and probabilities within your data. In this MS Excel tutorial from everyone's favorite Excel guru, YouTube's ExcelsFun, the very first installment in his "Excel Statistics" series of free video lessons, you'll learn how to get started doing statistical analysis in Microsoft Excel 2007.
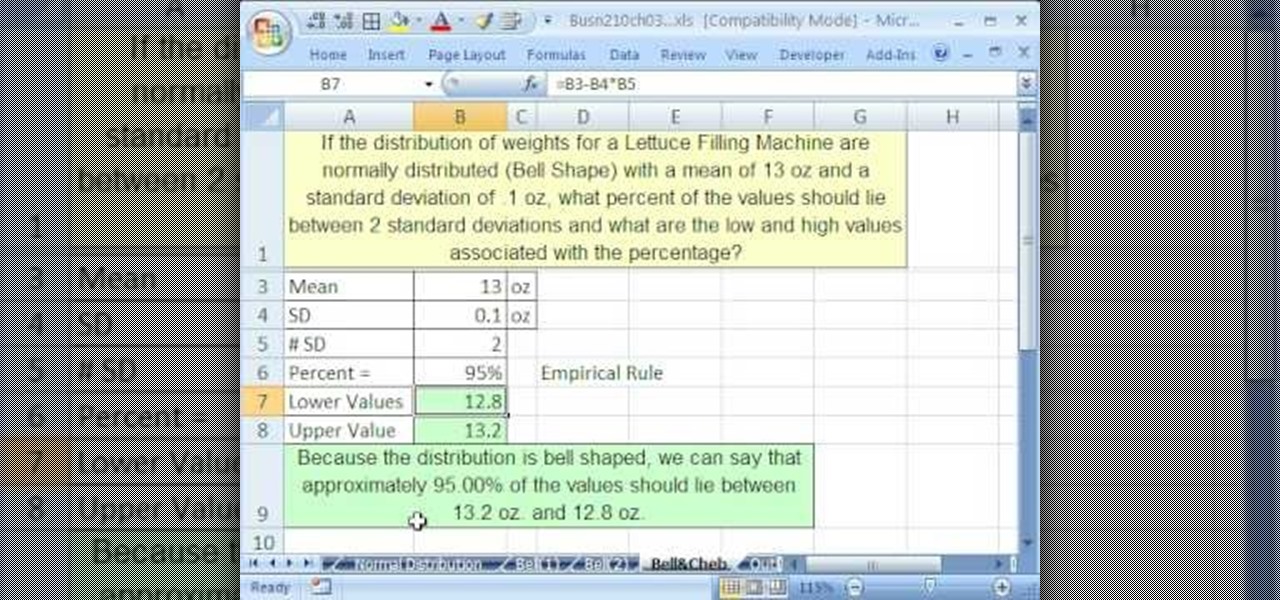
If you use Microsoft Excel on a regular basis, odds are you work with numbers. Put those numbers to work. Statistical analysis allows you to find patterns, trends and probabilities within your data. In this MS Excel tutorial from everyone's favorite Excel guru, YouTube's ExcelsFun, the 48th installment in his "Excel Statistics" series of free video lessons, you'll see comparison of Chebyshev's Theorem and the Empirical Rule (bell curve) and learn when to apply which.
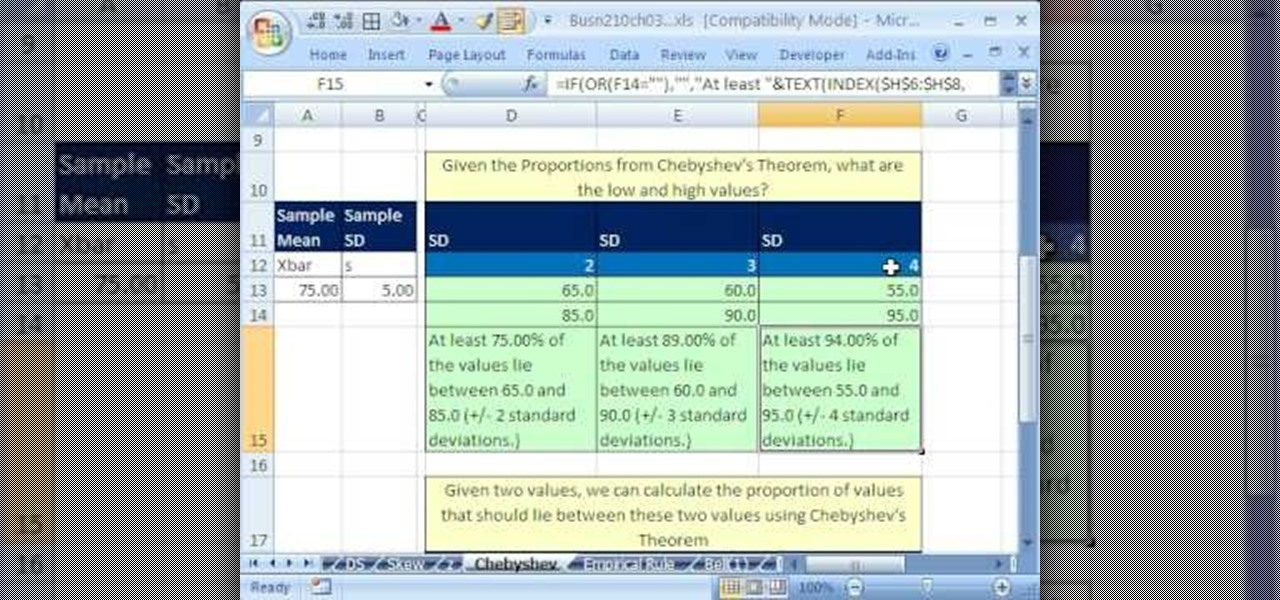
If you use Microsoft Excel on a regular basis, odds are you work with numbers. Put those numbers to work. Statistical analysis allows you to find patterns, trends and probabilities within your data. In this MS Excel tutorial from everyone's favorite Excel guru, YouTube's ExcelsFun, the 46th installment in his "Excel Statistics" series of free video lessons, you'll learn about Chebyshev's Theorem and how to apply it in three different ways.
If you use Microsoft Excel on a regular basis, odds are you work with numbers. Put those numbers to work. Statistical analysis allows you to find patterns, trends and probabilities within your data. In this MS Excel tutorial from everyone's favorite Excel guru, YouTube's ExcelsFun, the 43rd installment in his "Excel Statistics" series of free video lessons, you'll learn how to use the Excel Data Analysis add-in descriptive statistics tool.
If you use Microsoft Excel on a regular basis, odds are you work with numbers. Put those numbers to work. Statistical analysis allows you to find patterns, trends and probabilities within your data. In this MS Excel tutorial from everyone's favorite Excel guru, YouTube's ExcelsFun, the 42nd installment in his "Excel Statistics" series of free video lessons, you'll learn how to calculate the coefficient of variation.
If you use Microsoft Excel on a regular basis, odds are you work with numbers. Put those numbers to work. Statistical analysis allows you to find patterns, trends and probabilities within your data. In this MS Excel tutorial from everyone's favorite Excel guru, YouTube's ExcelsFun, the 30th installment in his "Excel Statistics" series of free video lessons, you'll learn how to create a scatter diagram for 2 quantitative variables.
If you use Microsoft Excel on a regular basis, odds are you work with numbers. Put those numbers to work. Statistical analysis allows you to find patterns, trends and probabilities within your data. In this MS Excel tutorial from everyone's favorite Excel guru, YouTube's ExcelsFun, the 93rd installment in his "Excel Statistics" series of free video lessons, you'll learn how to use the NORMSINV and NORMSDIST functions to complete a hypothesis test about a population proportion.
If you use Microsoft Excel on a regular basis, odds are you work with numbers. Put those numbers to work. Statistical analysis allows you to find patterns, trends and probabilities within your data. In this MS Excel tutorial from everyone's favorite Excel guru, YouTube's ExcelsFun, the 83rd installment in his "Excel Statistics" series of free video lessons, you'll learn how to construct confidence intervals when the sigma (population standard deviation) in NOT known using the TINV function.
If you use Microsoft Excel on a regular basis, odds are you work with numbers. Put those numbers to work. Statistical analysis allows you to find patterns, trends and probabilities within your data. In this MS Excel tutorial from everyone's favorite Excel guru, YouTube's ExcelsFun, the 29th installment in his "Excel Statistics" series of free video lessons, you'll learn how to create quantitative data cross tabulation using a pivot table (PivotTable).
If you use Microsoft Excel on a regular basis, odds are you work with numbers. Put those numbers to work. Statistical analysis allows you to find patterns, trends and probabilities within your data. In this MS Excel tutorial from everyone's favorite Excel guru, YouTube's ExcelsFun, the 11th installment in his "Excel Statistics" series of free video lessons, you'll learn how to work with, and create charts for, cross-sectional and time-series data.
If you use Microsoft Excel on a regular basis, odds are you work with numbers. Put those numbers to work. Statistical analysis allows you to find patterns, trends and probabilities within your data. In this MS Excel tutorial from everyone's favorite Excel guru, YouTube's ExcelsFun, the 13th installment in his "Excel Statistics" series of free video lessons, you'll learn how to install the Excel 2007 Data Analysis add-in.
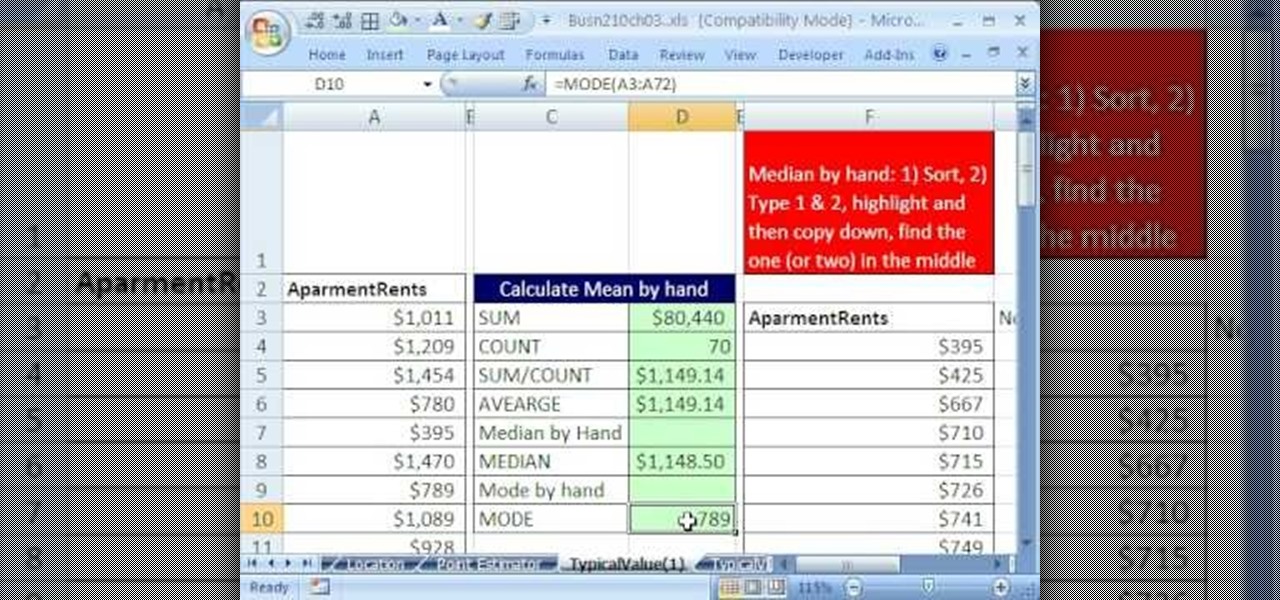
If you use Microsoft Excel on a regular basis, odds are you work with numbers. Put those numbers to work. Statistical analysis allows you to find patterns, trends and probabilities within your data. In this MS Excel tutorial from everyone's favorite Excel guru, YouTube's ExcelsFun, the 34th installment in his "Excel Statistics" series of free video lessons, you'll learn how to use MEAN, MEDIAN, MODE. These measures give us a typical value, a measure of central tendency one value that can repr...
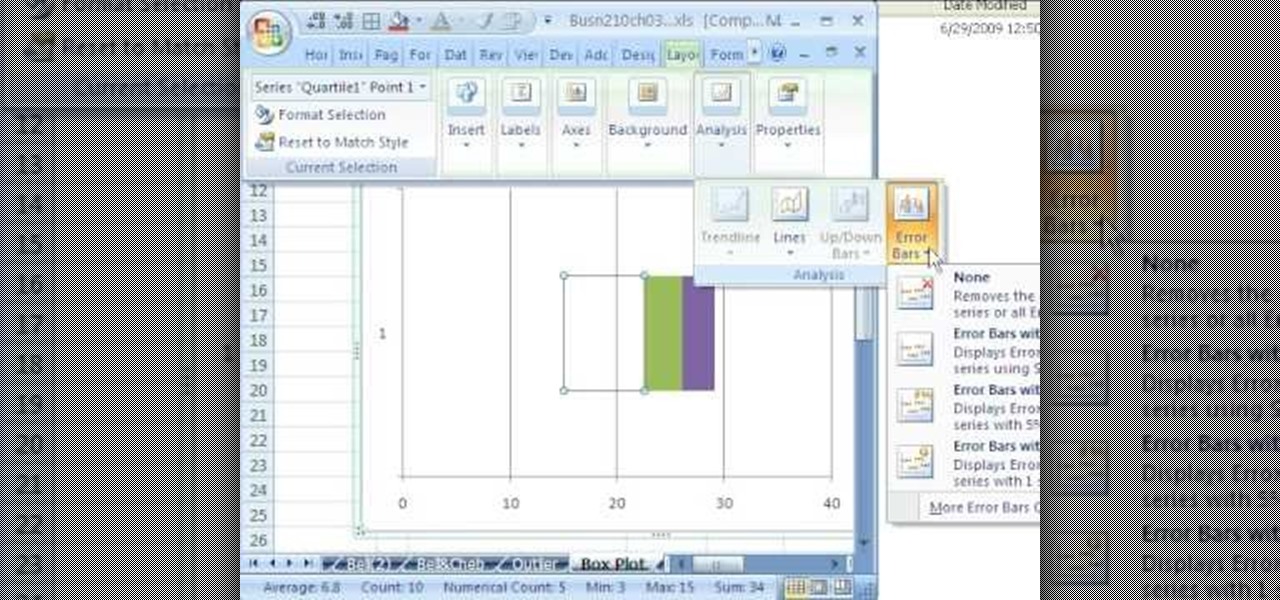
If you use Microsoft Excel on a regular basis, odds are you work with numbers. Put those numbers to work. Statistical analysis allows you to find patterns, trends and probabilities within your data. In this MS Excel tutorial from everyone's favorite Excel guru, YouTube's ExcelsFun, the 49th installment in his "Excel Statistics" series of free video lessons, you'll learn how to find outliers with the +/- 3 Z-score rule and the ABS function. See how to do a box plot by hand and in Excel. For th...
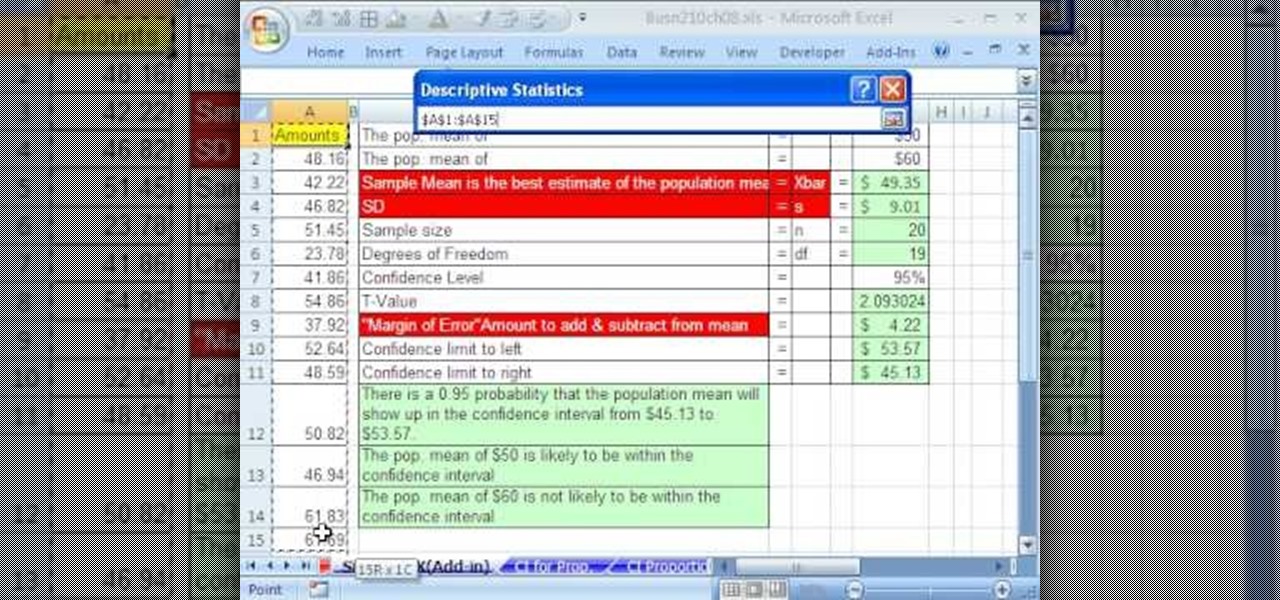
If you use Microsoft Excel on a regular basis, odds are you work with numbers. Put those numbers to work. Statistical analysis allows you to find patterns, trends and probabilities within your data. In this MS Excel tutorial from everyone's favorite Excel guru, YouTube's ExcelsFun, the 84th installment in his "Excel Statistics" series of free video lessons, you'll learn how to construct confidence intervals when the sigma is NOT known using the Descriptive Statistics data analysis add-in.
If you use Microsoft Excel on a regular basis, odds are you work with numbers. Put those numbers to work. Statistical analysis allows you to find patterns, trends and probabilities within your data. In this MS Excel tutorial from everyone's favorite Excel guru, YouTube's ExcelsFun, the 38th installment in his "Excel Statistics" series of free video lessons, you'll learn how to use the RANK and PERCENTRANK functions as well as the Data Analysis add-in's Rank & Percentile tools.
If you use Microsoft Excel on a regular basis, odds are you work with numbers. Put those numbers to work. Statistical analysis allows you to find patterns, trends and probabilities within your data. In this MS Excel tutorial from everyone's favorite Excel guru, YouTube's ExcelsFun, the 20th installment in his "Excel Statistics" series of free video lessons, you'll learn how to take raw quantitative (numerical) data and figure out how to group it into classes so that you can have categories an...
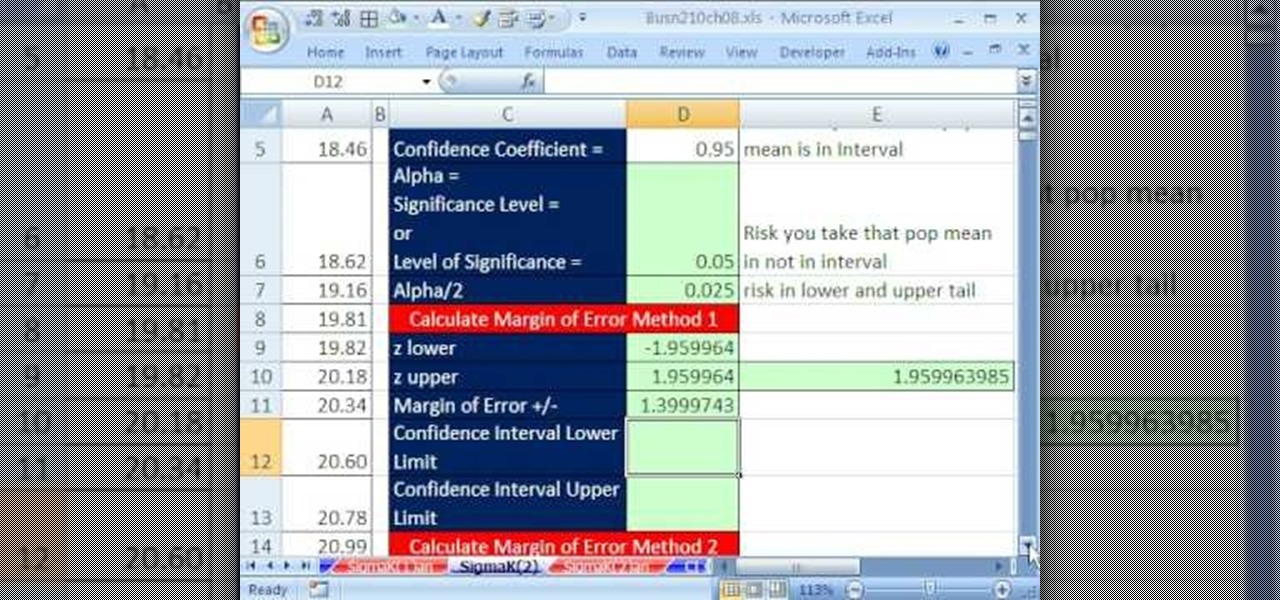
If you use Microsoft Excel on a regular basis, odds are you work with numbers. Put those numbers to work. Statistical analysis allows you to find patterns, trends and probabilities within your data. In this MS Excel tutorial from everyone's favorite Excel guru, YouTube's ExcelsFun, the 81st installment in his "Excel Statistics" series of free video lessons, you'll learn how to construct confidence intervals when the sigma (population standard deviation) is known. See how the CONFIDENCE and NO...
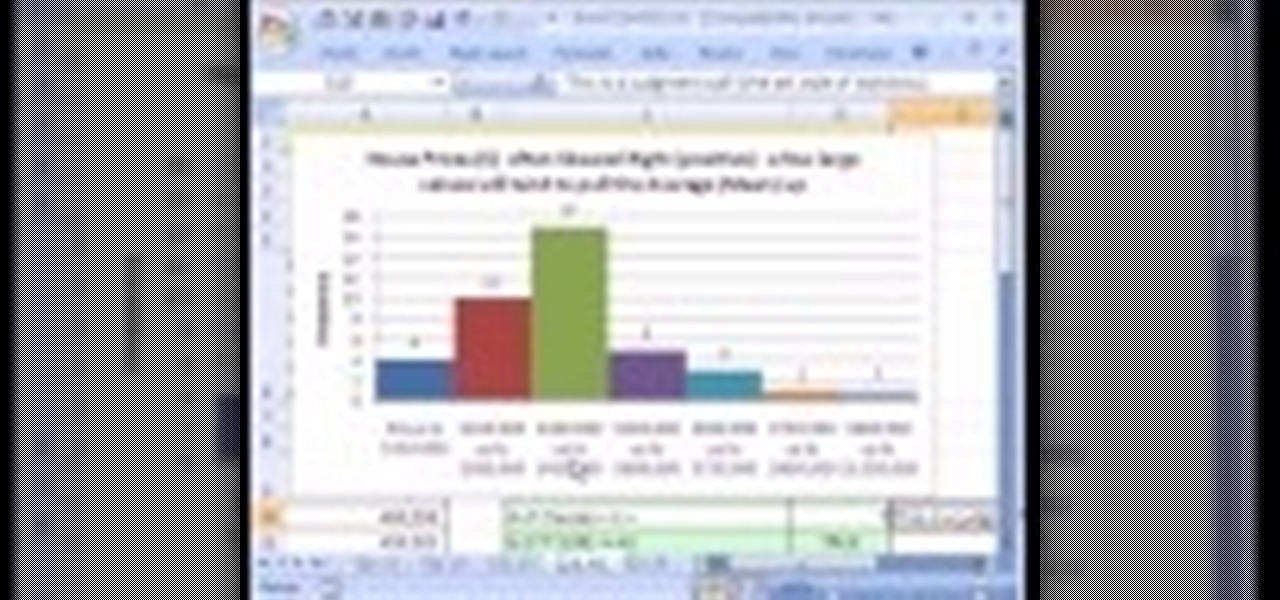
If you use Microsoft Excel on a regular basis, odds are you work with numbers. Put those numbers to work. Statistical analysis allows you to find patterns, trends and probabilities within your data. In this MS Excel tutorial from everyone's favorite Excel guru, YouTube's ExcelsFun, the 23rd installment in his "Excel Statistics" series of free video lessons, you'll learn how to work with skew in histograms for quantitative Data. Learn how to skew left (negative) and skew right (positive) with ...
If you use Microsoft Excel on a regular basis, odds are you work with numbers. Put those numbers to work. Statistical analysis allows you to find patterns, trends and probabilities within your data. In this MS Excel tutorial from everyone's favorite Excel guru, YouTube's ExcelsFun, the 14th installment in his "Excel Statistics" series of free video lessons, you'll learn how to create relative & percent & frequency distributions with formulas for categorical data. See, too, how to create a per...
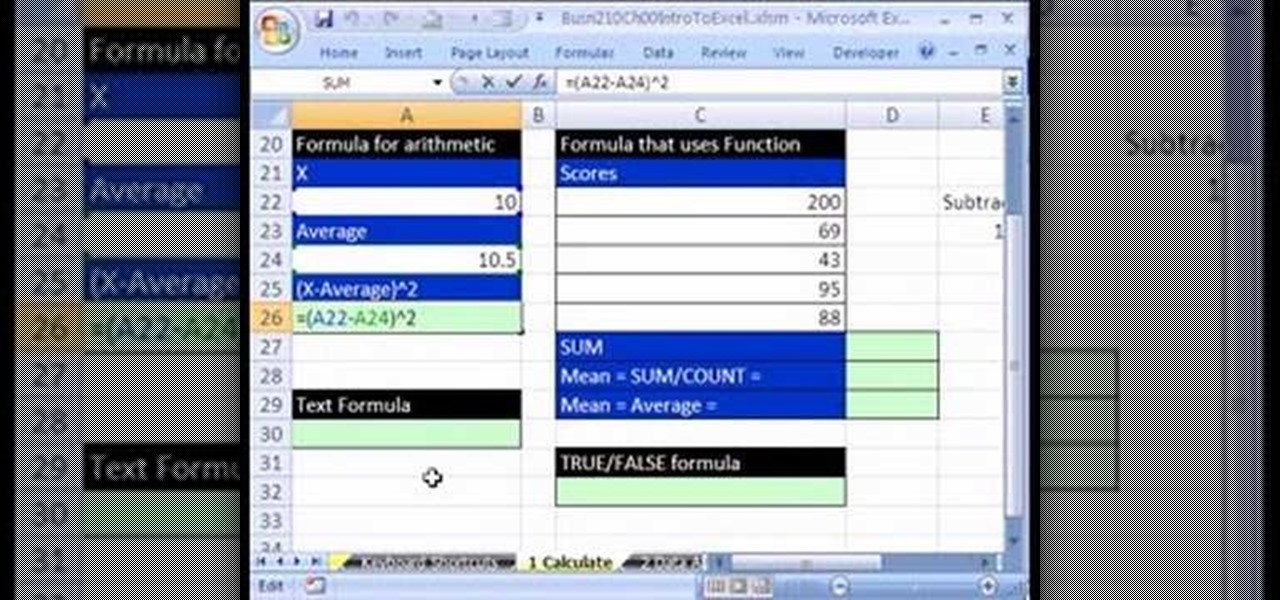
If you use Microsoft Excel on a regular basis, odds are you work with numbers. Put those numbers to work. Statistical analysis allows you to find patterns, trends and probabilities within your data. In this MS Excel tutorial from everyone's favorite Excel guru, YouTube's ExcelsFun, the 2nd installment in his "Excel Statistics" series of free video lessons, you'll learn how to make calculations in Excel using formulas and cell references. Learn about the different Excel Math operators and func...
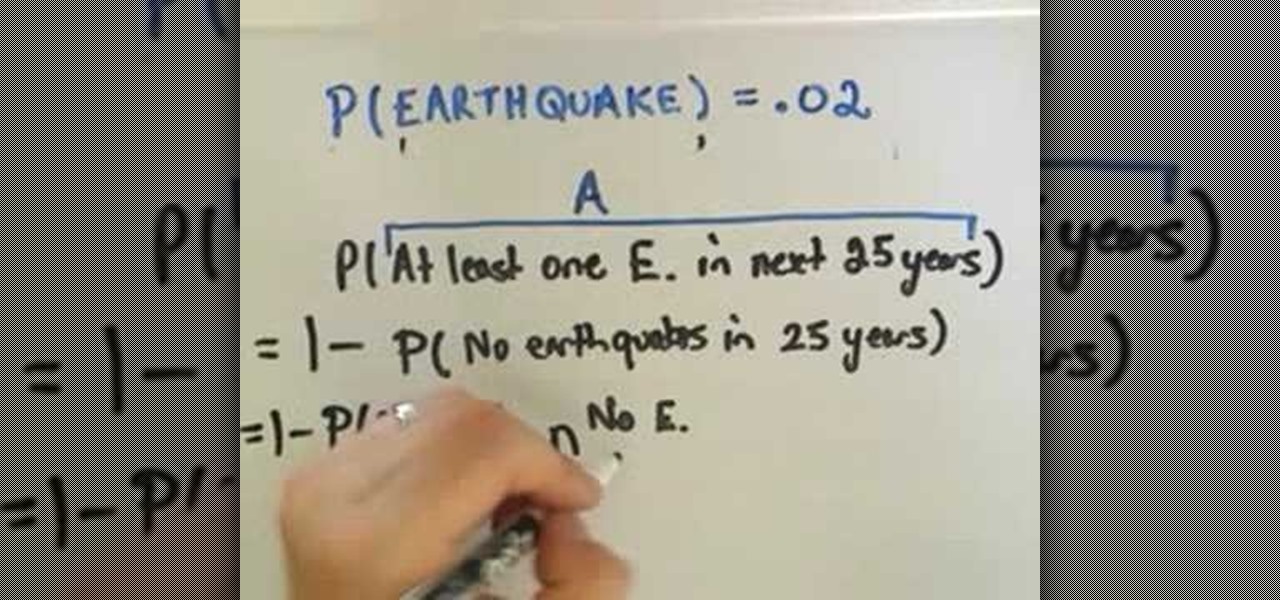
Calculating probablities can be used to help us make decision. PatrickJMT explains how to calculate probability in an "either A or not A" scenario. The probability of A plus the probability of not A is equal to one. Therefore, the probability of A is equal to one minus the probability of not A ; P(A)= 1 - P(not A). The probability of a major earthquake in San Francisco over a period of time is used as an example. The probablity of an earthquake of a magnitude of 7.5 or greater in San Francisc...
If you use Microsoft Excel on a regular basis, odds are you work with numbers. Put those numbers to work. Statistical analysis allows you to find patterns, trends and probabilities within your data. In this MS Excel tutorial from everyone's favorite Excel guru, YouTube's ExcelsFun, the 92nd installment in his "Excel Statistics" series of free video lessons, you'll learn how to use the TINV and TDIST functions to test a hypothesis.
If you use Microsoft Excel on a regular basis, odds are you work with numbers. Put those numbers to work. Statistical analysis allows you to find patterns, trends and probabilities within your data. In this MS Excel tutorial from everyone's favorite Excel guru, YouTube's ExcelsFun, the 85th installment in his "Excel Statistics" series of free video lessons, you'll learn how to construct confidence intervals for proportions using NORMSINV function and other formulas.
Watch the following math probability video to learn how to find the probability of two independent events. This will help you with your algebra or geometry homework.
As was mentioned by the great OTW last week, TOR, aka The Onion Router, has had its integrity attacked by the NSA. In an attempt to reduce the anonymity granted by the service, the NSA has opened a great many nodes of their own. The purpose is presumably to trace the origin of a communication by compromising some entrance and exit nodes. Once both are compromised, it is much easier to correlate traffic with a particular individual.
Cryptography is the science of keeping secrets, or more specifically, the science of disguising them. As a point of fact, cryptography has progressed quite a bit farther and now encompasses file and message integrity, sender authentication, and pseudo-random number generators.
Want to actually catch 'em all? Pokémon GO has long-teased the opportunity to hunt for Pokémon in the real world through augmented reality, but few have had the opportunity to actually see it in action.
Hi, gang! Time for another hack using Metasploit. We have exploited Windows XP (a very insecure operating system) and we have exploited Ubuntu and installed Meterpreter on a Linux system exploiting the Samba service. Several of you have asked for a hack on more modern Windows systems, so here goes.
In this lesson we will learn how to solve probability problems involving a spinner. A probability measures the likelihood of a certain event. It always ranges between 0 and 1. The following formula can be used to find the probability of a particular event:
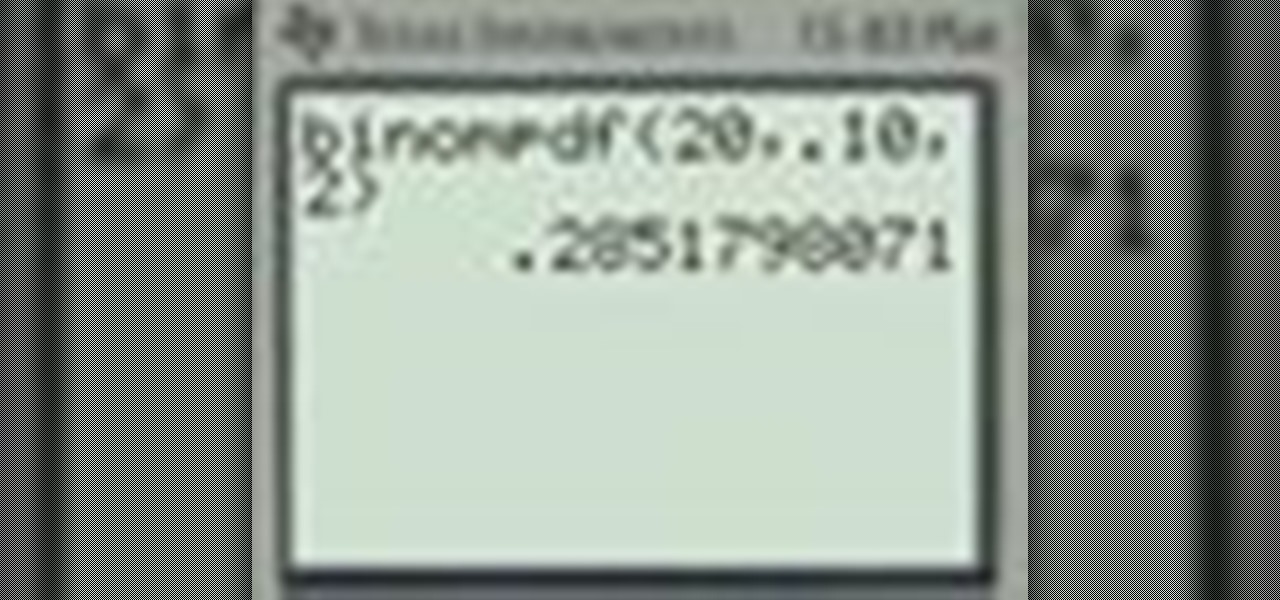
Need to know how to use your Texas Instruments graphing calculator for your college math or statistics class? You're in luck... watch this video tutorial to see how to do binomial probabilities with a TI-83 graphing calculator.
STANDP'S WINDOWS 7 "ASTON-2" CUSTOMIZED DESKTOP IT ROCKS COMPLETELY!. DEC
Today isn't actually Pi Day, but I was unable to get this article out in time. Pi Day was actually yesterday, March 14th (3.14), so let's call this a post-Pi Day treat!
In 1988, John Langley created COPS for the fledgling FOX network. 23 years later, the show is still running. It is the Energizer bunny of prime time television. Since John has followed more police officers and witnessed more crime than any human being on earth (absolutely no question), I had to ask some advice for hypothetical unwanted encounters with the men in blue.
STANDP'S CUSTOM DESKTOP "ASK NOT WHAT YOUR DESKTOP CAN DO FOR YOU...". http://standp-how-to-vidzzz.wonderhowto.com/corkboard/new-post/text/