

How To: Install the Xposed Framework on Your Rooted LG G3 for 100s of Fast & Easy Mods
If you've done any root-level hacking or modding on any of your previous Android devices, you're probably well familiar with Rovo89's famous Xposed Framework.

If you've done any root-level hacking or modding on any of your previous Android devices, you're probably well familiar with Rovo89's famous Xposed Framework.

Now that all variants of the Galaxy S5 have finally been rooted, we can start exploring all of the tweaks and hacks that Superuser privileges open up to us.
I've been on a customizing kick over the past few weeks, showing you sweet mods for your Samsung Galaxy Note 2 like interactive live wallpapers, app and settings backgrounds, status bar tweaks, and more. But, I'm not done yet. There's still plenty to softMod on your Note 2, and today I'm going to show you how to customize your Quick Settings toggles.

In this tutorial, we learn how to build your own hydroponics system. To do this, you will need: square line rain gutter, 6x end caps, 3x gutter running outlet, 1x small pond pump, 2 meters pond pump tubing, timber for framework, large plastic container, and gutter leaf guard. When you start, you will need to measure out how tall your pump will need to be, then build the framework to surround it. Then, grab all your gutter parts and put them together. Once you do this, start to set up all the ...

Have you seen odd, square codes on some specific merchandise? These are called QR codes, or quick-response codes, and they are a type of bar code which your smartphone can read and then take you to a particular website, give you coupons or even a business card. Here's how you can get the most out of QR codes.

Hitting up antiques stores or flea markets every now and then engenders eccentric rewards of odds and ends, pretty semiprecious stones that look dazzling but have no home.
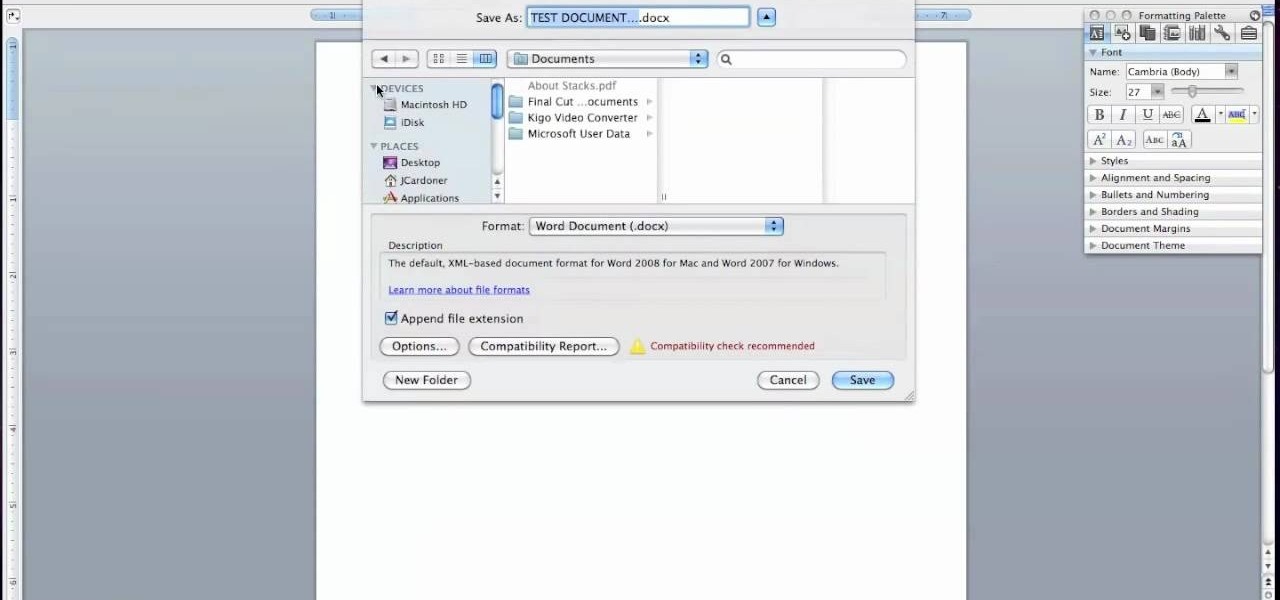
If you're one of the many people who work with Macs and PCs, the odds are you work with file formats that are more often than not incompatible with the other computers. This can be a major problem if you run into it with your Word documents. This tutorial will show you how to open Word docs on either computer.

If you use Microsoft Excel on a regular basis, odds are you work with numbers. Put those numbers to work. Statistical analysis allows you to find patterns, trends and probabilities within your data. In this MS Excel tutorial from everyone's favorite Excel guru, YouTube's ExcelsFun, the 45th installment in his "Excel Statistics" series of free video lessons, you'll learn how to see how to calculate a z-score.

If you use Microsoft Excel on a regular basis, odds are you work with numbers. Put those numbers to work. Statistical analysis allows you to find patterns, trends and probabilities within your data. In this MS Excel tutorial from everyone's favorite Excel guru, YouTube's ExcelsFun, the 35.2nd installment in his "Excel Statistics" series of free video lessons, you'll learn how to use Excel's GEOMEAN function to find geometric mean.

If you use Microsoft Excel on a regular basis, odds are you work with numbers. Put those numbers to work. Statistical analysis allows you to find patterns, trends and probabilities within your data. In this MS Excel tutorial from everyone's favorite Excel guru, YouTube's ExcelsFun, the 40th installment in his "Excel Statistics" series of free video lessons, you'll learn how to calculate range & interquartile range for variability using the MAX, MIN, QUARTILE functions.

If you use Microsoft Excel on a regular basis, odds are you work with numbers. Put those numbers to work. Statistical analysis allows you to find patterns, trends and probabilities within your data. In this MS Excel tutorial from everyone's favorite Excel guru, YouTube's ExcelsFun, the 86th installment in his "Excel Statistics" series of free video lessons, you'll learn how to construct confidence intervals for proportions using NORMSINV function and other formulas.

If you use Microsoft Excel on a regular basis, odds are you work with numbers. Put those numbers to work. Statistical analysis allows you to find patterns, trends and probabilities within your data. In this MS Excel tutorial from everyone's favorite Excel guru, YouTube's ExcelsFun, the 87th installment in his "Excel Statistics" series of free video lessons, you'll learn how to calculate sample size (n) for confidence intervals.

If you use Microsoft Excel on a regular basis, odds are you work with numbers. Put those numbers to work. Statistical analysis allows you to find patterns, trends and probabilities within your data. In this MS Excel tutorial from everyone's favorite Excel guru, YouTube's ExcelsFun, the 27th installment in his "Excel Statistics" series of free video lessons, you'll learn how to create a quantitative data dot plot chart using the REPT and COUNTIF functions.

If you use Microsoft Excel on a regular basis, odds are you work with numbers. Put those numbers to work. Statistical analysis allows you to find patterns, trends and probabilities within your data. In this MS Excel tutorial from everyone's favorite Excel guru, YouTube's ExcelsFun, the 26th installment in his "Excel Statistics" series of free video lessons, you'll learn how to create quantitative data cumulative frequency distributions with pivot tables.

If you use Microsoft Excel on a regular basis, odds are you work with numbers. Put those numbers to work. Statistical analysis allows you to find patterns, trends and probabilities within your data. In this MS Excel tutorial from everyone's favorite Excel guru, YouTube's ExcelsFun, the 16th installment in his "Excel Statistics" series of free video lessons, you'll learn how to cross tabulate & do percentage cross tabulation for categorical data using a pivot table (PivotTable).

If you use Microsoft Excel on a regular basis, odds are you work with numbers. Put those numbers to work. Statistical analysis allows you to find patterns, trends and probabilities within your data. In this MS Excel tutorial from everyone's favorite Excel guru, YouTube's ExcelsFun, the 19th installment in his "Excel Statistics" series of free video lessons, you'll learn how to group categories in a frequency distribution with a formula (2 COUNTIF) and the pivot table (PivotTable) grouping fea...

If you use Microsoft Excel on a regular basis, odds are you work with numbers. Put those numbers to work. Statistical analysis allows you to find patterns, trends and probabilities within your data. In this MS Excel tutorial from everyone's favorite Excel guru, YouTube's ExcelsFun, the 17th installment in his "Excel Statistics" series of free video lessons, you'll learn how to cross tabulate & do percentage cross tabulation for categorical data using formulas rather than pivot tables.

If you use Microsoft Excel on a regular basis, odds are you work with numbers. Put those numbers to work. Statistical analysis allows you to find patterns, trends and probabilities within your data. In this MS Excel tutorial from everyone's favorite Excel guru, YouTube's ExcelsFun, the 3rd installment in his "Excel Statistics" series of free video lessons, you'll learn how to use Excel's sorting and pivot tables (PivotTables) data analysis tools.

If you use Microsoft Excel on a regular basis, odds are you work with numbers. Put those numbers to work. Statistical analysis allows you to find patterns, trends and probabilities within your data. In this MS Excel tutorial from everyone's favorite Excel guru, YouTube's ExcelsFun, the 35th installment in his "Excel Statistics" series of free video lessons, you'll learn how to calculate weighted and geometric means and see how to use the GEOMEAN function.
If you use Microsoft Excel on a regular basis, odds are you work with numbers. Put those numbers to work. Statistical analysis allows you to find patterns, trends and probabilities within your data. In this MS Excel tutorial from everyone's favorite Excel guru, YouTube's ExcelsFun, the 33rd installment in his "Excel Statistics" series of free video lessons, you'll learn how to use the AVEARGE, MEDIAN, MODE, PERCENTILE, QUARTILE and PERCENTILERANK functions to measure location.

If you use Microsoft Excel on a regular basis, odds are you work with numbers. Put those numbers to work. Statistical analysis allows you to find patterns, trends and probabilities within your data. In this MS Excel tutorial from everyone's favorite Excel guru, YouTube's ExcelsFun, the 4th installment in his "Excel Statistics" series of free video lessons, you'll learn how to create a frequency table and percentage frequency table using a Pivot Table (PivotTable).

This is a Jumpstyle tutorial by Crewster Jumpen. Jumpstyle is huge in Europe. It is an odd folk inspired dance to rhythmic electronica. The basics of jumpstyle are jumps. Master little nuances of the jumps that move your feet back and forth rhythmically with the music. It's very athletic like breakdancing or the Irish jig.
jQuery is a very popular and easy-to-use Javascript framework that allows you to make very interactive websites quickly and easily. This video introduction will show you how to use the basics of jQuery and explains why you should be learning how to use it in the first place. If you want to make really smooth user interfaces for websites, watch this video. You really need to know jQuery.
Use Adobe Dreamweaver CS4? See how to create quick-and-easy collapsible panel using the open-source Spry Ajax framework. Whether you're new to Adobe's popular WISYWIG HTML editor or a seasoned web development professional just looking to better acquaint yourself with the CS4 workflow, you're sure to be well served by this video tutorial. For more information, including a step-by-step overview, watch this free video guide.
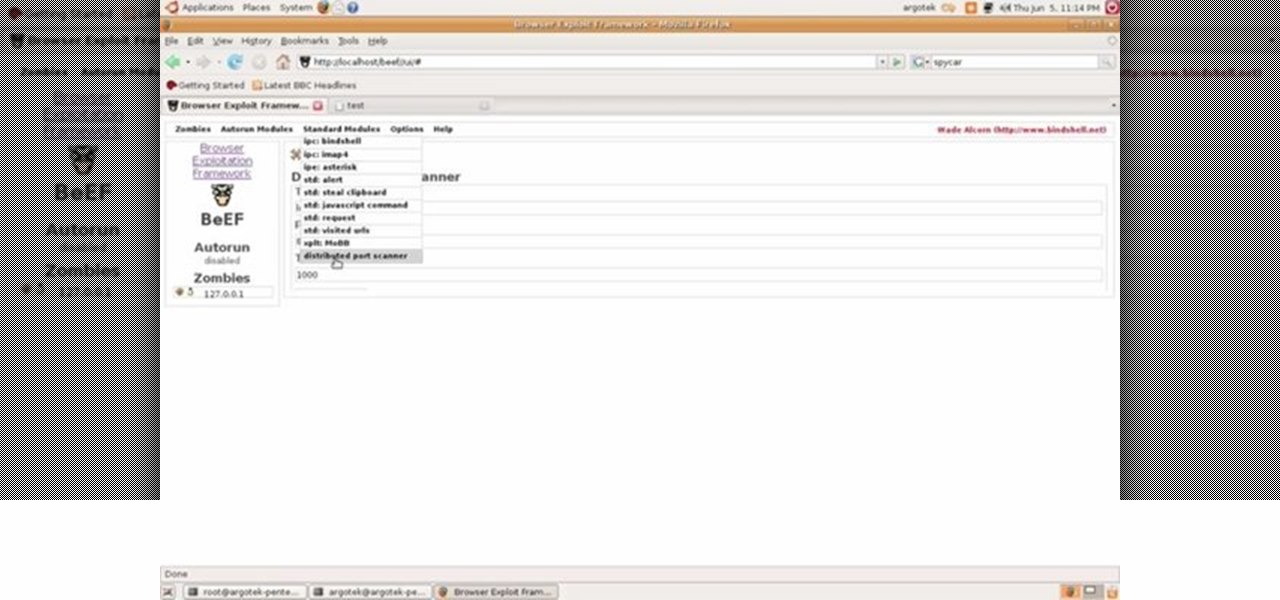
This video tutorial talks about browser exploitation. Particularly, it talks about tools, like BeEF, that can be used to hack known vulnerabilities within browsers and some cool frameworks that you can use to check the security of your own browser. To get started hacking your own browser, watch this how-to.

In this tutorial, we learn how to make a web browser in Xcode. First, open up Xcode on your Apply computer, then create a new project. Now go under actions and click 'add', then 'existing frameworks'. Next, click add twice, then scroll down to where you see "menu.xib". Double click on this, and interface builder will open up. You will now have four windows on your desktop opened up. Now go to web view and drag and drop the screen. From here, you can create buttons for the web browser and deci...
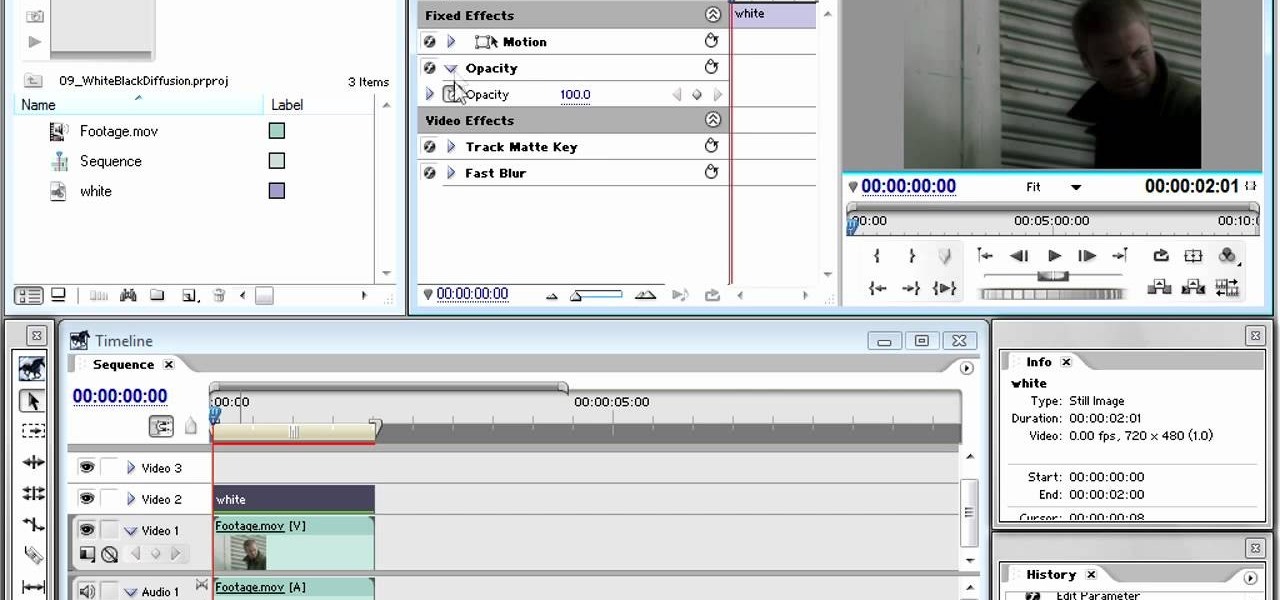
It's odd how something that filmmakers fought for so long to get rid of, blurriness in their film, is now so sought after by new filmmakers who wish they still had it. This video will teach those new digital filmmakers how to diffuse images using track and color mattes. If your film needs to look lower-quality, the tips in this video should be very helpful to you.
If you use Microsoft Office Excel on anything resembling a regular basis, odds are you work with numbers. Put those numbers to work with this free MS Excel video tutorial, which will teach you how to use a number of Excel's basic statistical functions (e.g., STDEV, AVERAGE, MEDIAN, MODE, RANK, ROUND, LARGE & SMALL).

If you use Microsoft Excel on a regular basis, odds are you work with numbers. Put those numbers to work. Statistical analysis allows you to find patterns, trends and probabilities within your data. In this MS Excel tutorial from everyone's favorite Excel guru, YouTube's ExcelsFun, the 44th installment in his "Excel Statistics" series of free video lessons, you'll learn how to use the SKEW function to calculate the skew in a distribution of data.

f you use Microsoft Excel on a regular basis, odds are you work with numbers. Put those numbers to work. Statistical analysis allows you to find patterns, trends and probabilities within your data. In this MS Excel tutorial from everyone's favorite Excel guru, YouTube's ExcelsFun, the 37th installment in his "Excel Statistics" series of free video lessons, you'll learn how to use the PERCENTILE and QUARTILE functions.

If you use Microsoft Excel on a regular basis, odds are you work with numbers. Put those numbers to work. Statistical analysis allows you to find patterns, trends and probabilities within your data. In this MS Excel tutorial from everyone's favorite Excel guru, YouTube's ExcelsFun, the 47th installment in his "Excel Statistics" series of free video lessons, you'll learn about the basics of the empirical rule (the bell curve) and how to apply it in various ways.

If you use Microsoft Excel on a regular basis, odds are you work with numbers. Put those numbers to work. Statistical analysis allows you to find patterns, trends and probabilities within your data. In this MS Excel tutorial from everyone's favorite Excel guru, YouTube's ExcelsFun, the 89th installment in his "Excel Statistics" series of free video lessons, you'll learn how to use the NORMSINV function for critical values and the NORSDIST function for p-values.

If you use Microsoft Excel on a regular basis, odds are you work with numbers. Put those numbers to work. Statistical analysis allows you to find patterns, trends and probabilities within your data. In this MS Excel tutorial from everyone's favorite Excel guru, YouTube's ExcelsFun, the 91st installment in his "Excel Statistics" series of free video lessons, you'll learn how to use TINV and TDIST functions to find critical values given an unknown sigma value.

If you use Microsoft Excel on a regular basis, odds are you work with numbers. Put those numbers to work. Statistical analysis allows you to find patterns, trends and probabilities within your data. In this MS Excel tutorial from everyone's favorite Excel guru, YouTube's ExcelsFun, the 80th installment in his "Excel Statistics" series of free video lessons, you'll learn how to construct confidence intervals when the sigma is known known using the CONFIDENCE and NORMSINV functions.

If you use Microsoft Excel on a regular basis, odds are you work with numbers. Put those numbers to work. Statistical analysis allows you to find patterns, trends and probabilities within your data. In this MS Excel tutorial from everyone's favorite Excel guru, YouTube's ExcelsFun, the 21st installment in his "Excel Statistics" series of free video lessons, you'll learn how to build labels and counting formulas for a frequency distribution.

If you use Microsoft Excel on a regular basis, odds are you work with numbers. Put those numbers to work. Statistical analysis allows you to find patterns, trends and probabilities within your data. In this MS Excel tutorial from everyone's favorite Excel guru, YouTube's ExcelsFun, the 87th installment in his "Excel Statistics" series of free video lessons, you'll learn how to use NORMSINV to test a hypothesis with population standard deviation (sigma) known and proportions.

If you use Microsoft Excel on a regular basis, odds are you work with numbers. Put those numbers to work. Statistical analysis allows you to find patterns, trends and probabilities within your data. In this MS Excel tutorial from everyone's favorite Excel guru, YouTube's ExcelsFun, the 28th installment in his "Excel Statistics" series of free video lessons, you'll learn how to create quantitative data stem & leaf charts using the REPT and COUNTIF functions.

If you use Microsoft Excel on a regular basis, odds are you work with numbers. Put those numbers to work. Statistical analysis allows you to find patterns, trends and probabilities within your data. In this MS Excel tutorial from everyone's favorite Excel guru, YouTube's ExcelsFun, the 13th installment in his "Excel Statistics" series of free video lessons, you'll learn how to create a column chart from a frequency distribution for categorical data.

If you use Microsoft Excel on a regular basis, odds are you work with numbers. Put those numbers to work. Statistical analysis allows you to find patterns, trends and probabilities within your data. In this MS Excel tutorial from everyone's favorite Excel guru, YouTube's ExcelsFun, the 5th installment in his "Excel Statistics" series of free video lessons, you'll learn how to use relative and absolute cell references to save time when writing formulas.
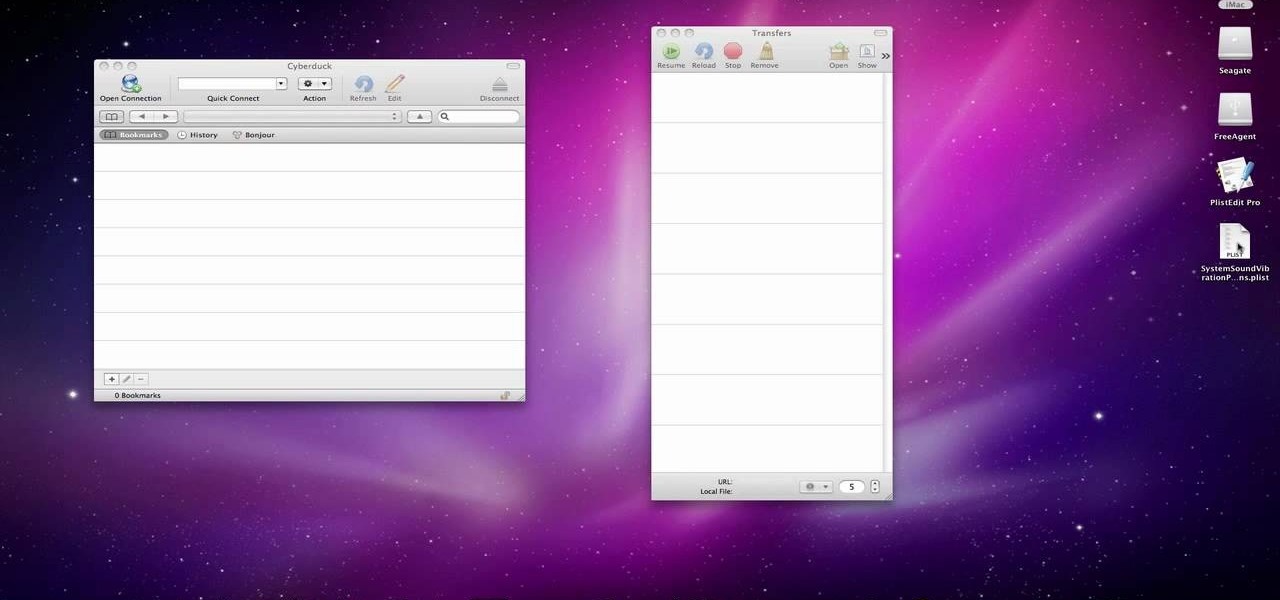
In this video we learn how to make your iPhone vibrate your notifications longer. For this you need an SSH program like cyberduck. You also need plist edit pro. Once you have SSH in your phone, go to system, library, private frameworks, celestial framework, then find vibration patterns. Double click that. Download it to the desktop. Open it. Open up the plist file. Go to default, look at total duration, click into that to change the time of the vibrate duration. Change the On Duration too. No...