Whether you're interested in learning Microsoft Excel from the bottom up or just looking to pick up a few tips and tricks, you're in the right place. In this tutorial from everyone's favorite digital spreadsheet guru, ExcelIsFun, the 10th installment in his "Highline Excel Class" series of free video Excel lessons, you'll learn how to create projections for sales numbers from a database using the SUMIF, VLOOKUP and COLUMNS functions and a percentage increase formula.

As you might guess, one of the domains in which Microsoft Excel really excels is business math. Brush up on the stuff for your next or current job with this how-to. In this tutorial from everyone's favorite digital spreadsheet guru, YouTube's ExcelIsFun, the 60th installment in his "Excel Business Math" series of free video lessons, you'll learn how to use the Excel functions FV and PMT to make a future value calculation for an annuity.
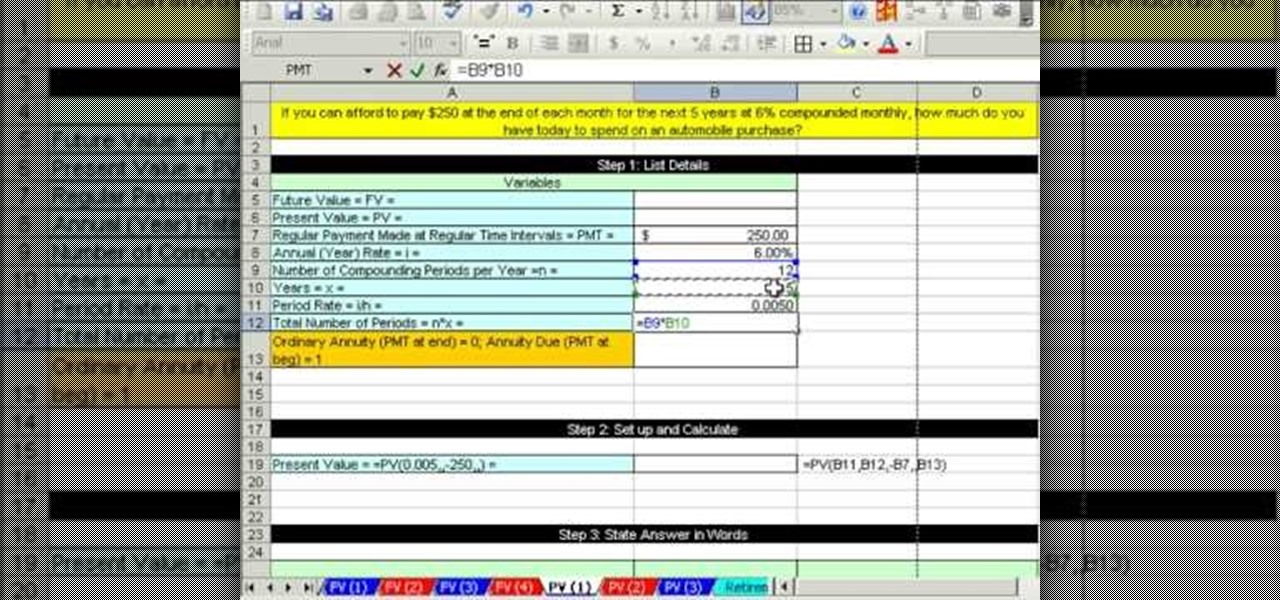
As you might guess, one of the domains in which Microsoft Excel really excels is business math. Brush up on the stuff for your next or current job with this how-to. In this tutorial from everyone's favorite digital spreadsheet guru, YouTube's ExcelIsFun, the 61st installment in his "Excel Business Math" series of free video lessons, you'll learn how to use the Excel functions PV and PMT to make a present value calculation for an annuity.

If you use Microsoft Excel on a regular basis, odds are you work with numbers. Put those numbers to work. Statistical analysis allows you to find patterns, trends and probabilities within your data. In this MS Excel tutorial from everyone's favorite Excel guru, YouTube's ExcelsFun, the 45th installment in his "Excel Statistics" series of free video lessons, you'll learn how to see how to calculate a z-score.

If you use Microsoft Excel on a regular basis, odds are you work with numbers. Put those numbers to work. Statistical analysis allows you to find patterns, trends and probabilities within your data. In this MS Excel tutorial from everyone's favorite Excel guru, YouTube's ExcelsFun, the 35.2nd installment in his "Excel Statistics" series of free video lessons, you'll learn how to use Excel's GEOMEAN function to find geometric mean.
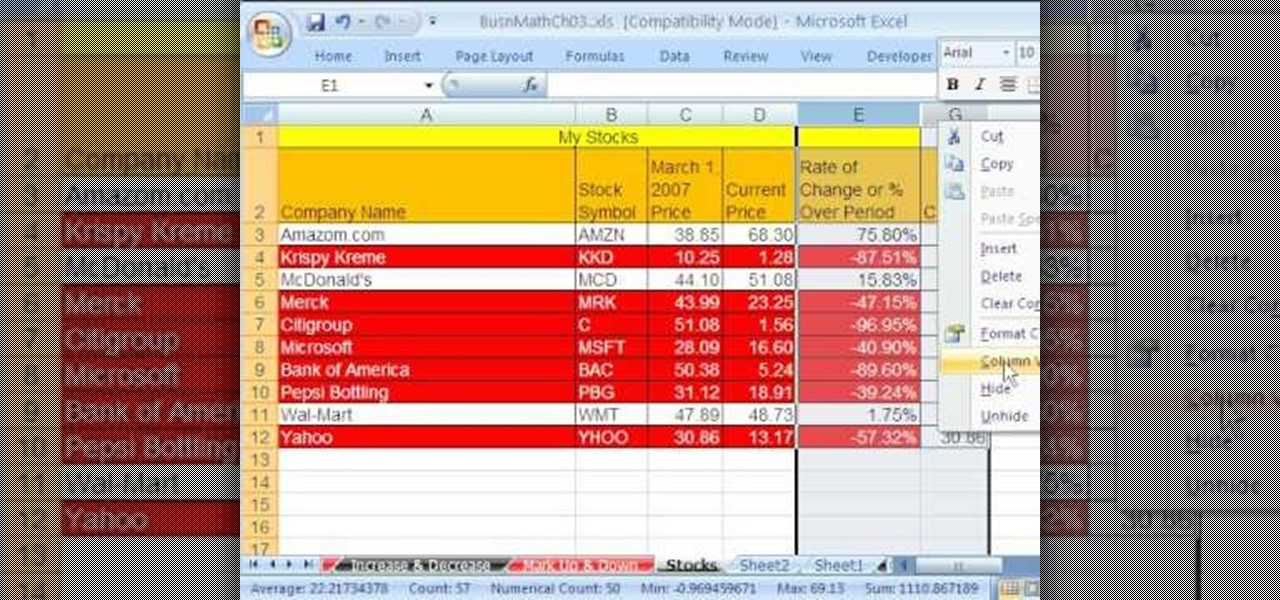
As you might guess, one of the domains in which Microsoft Excel really excels is business math. Brush up on the stuff for your next or current job with this how-to. In this tutorial from everyone's favorite digital spreadsheet guru, YouTube's ExcelIsFun, the 33rd installment in his "Excel Business Math" series of free video lessons, you'll learn how to add current stock prices to a stock analysis table in Excel using a web query.

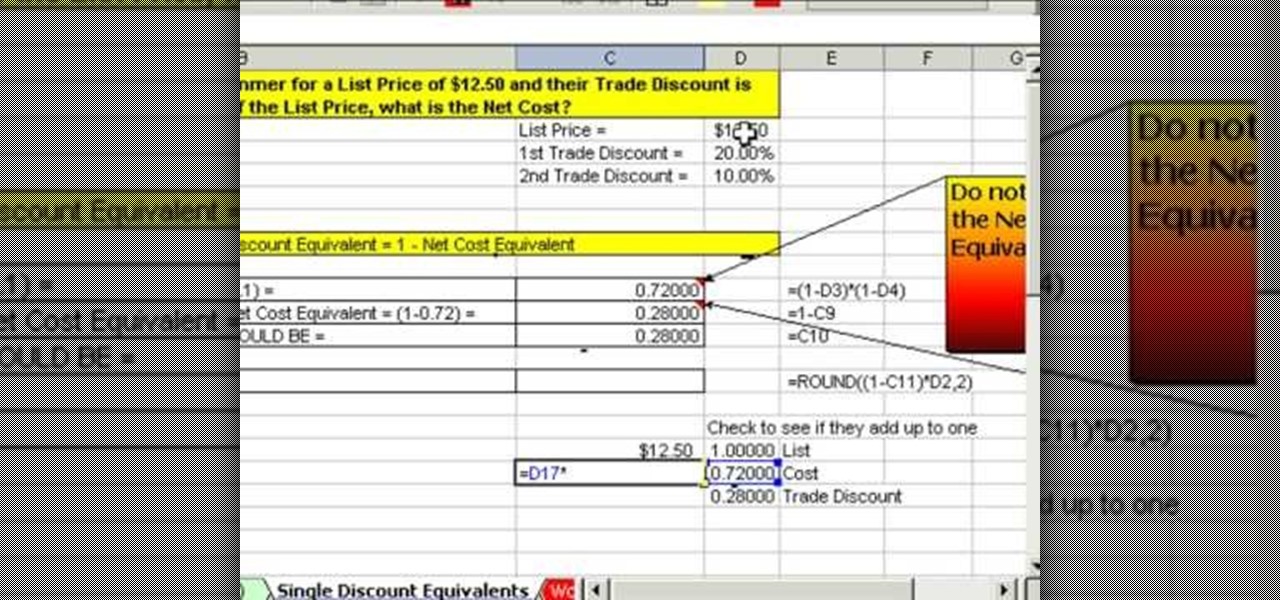
As you might guess, one of the domains in which Microsoft Excel really excels is business math. Brush up on the stuff for your next or current job with this how-to. In this tutorial from everyone's favorite digital spreadsheet guru, YouTube's ExcelIsFun, the 44th installment in his "Excel Business Math" series of free video lessons, you'll learn how to work with series trade discounts in MS Excel.
As you might guess, one of the domains in which Microsoft Excel really excels is business math. Brush up on the stuff for your next or current job with this how-to. In this tutorial from everyone's favorite digital spreadsheet guru, YouTube's ExcelIsFun, the 38th installment in his "Excel Business Math" series of free video lessons, you'll learn how to calculate gross and overtime pay in MS Excel.
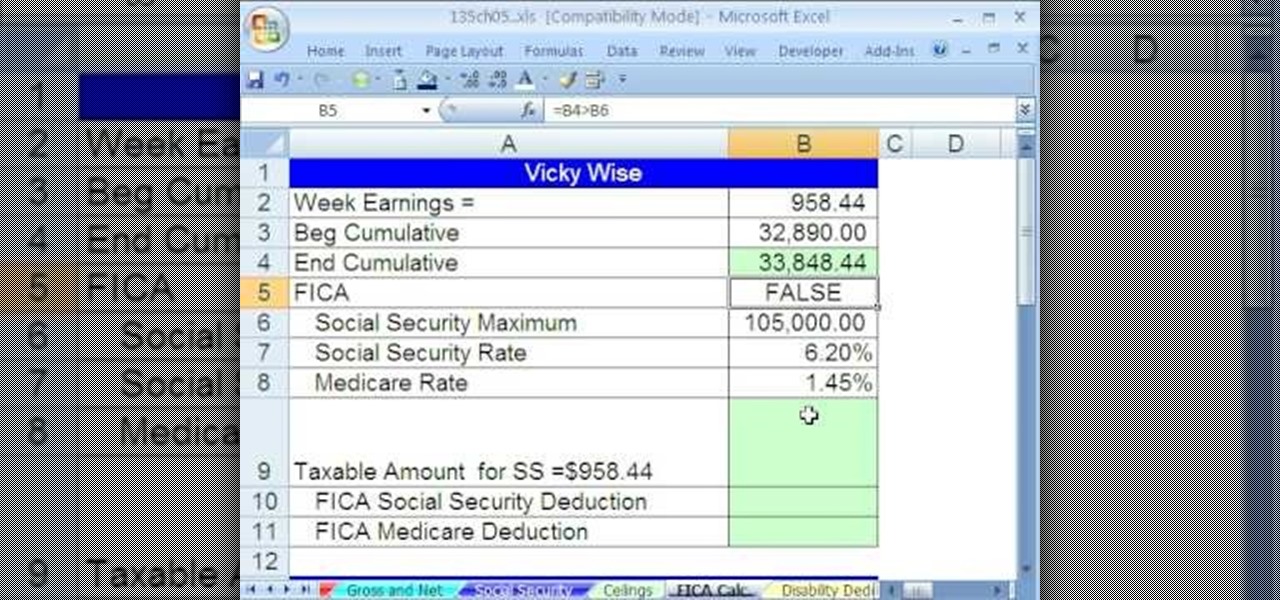
As you might guess, one of the domains in which Microsoft Excel really excels is business math. Brush up on the stuff for your next or current job with this how-to. In this tutorial from everyone's favorite digital spreadsheet guru, YouTube's ExcelIsFun, the 41st installment in his "Excel Business Math" series of free video lessons, you'll learn how to calculate deductions from paychecks when there is a ceiling or max taxable amount or hurdle.
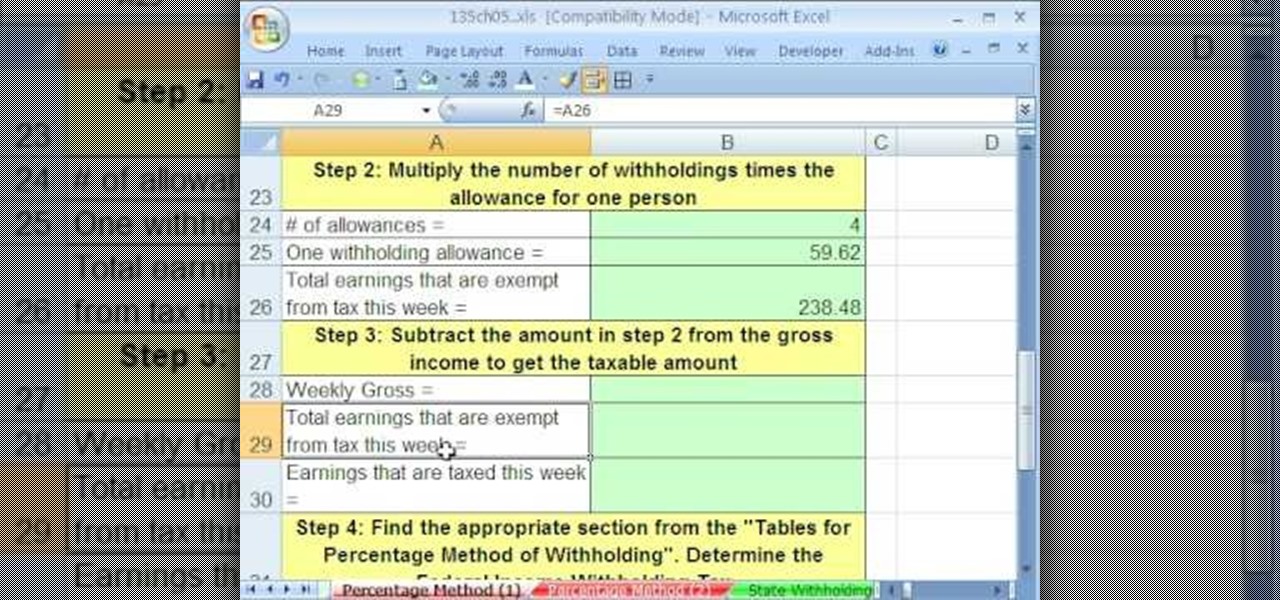
As you might guess, one of the domains in which Microsoft Excel really excels is business math. Brush up on the stuff for your next or current job with this how-to. In this tutorial from everyone's favorite digital spreadsheet guru, YouTube's ExcelIsFun, the 42nd installment in his "Excel Business Math" series of free video lessons, you'll learn about the wage bracket and percentage methods for calculating federal income tax payroll deductions.
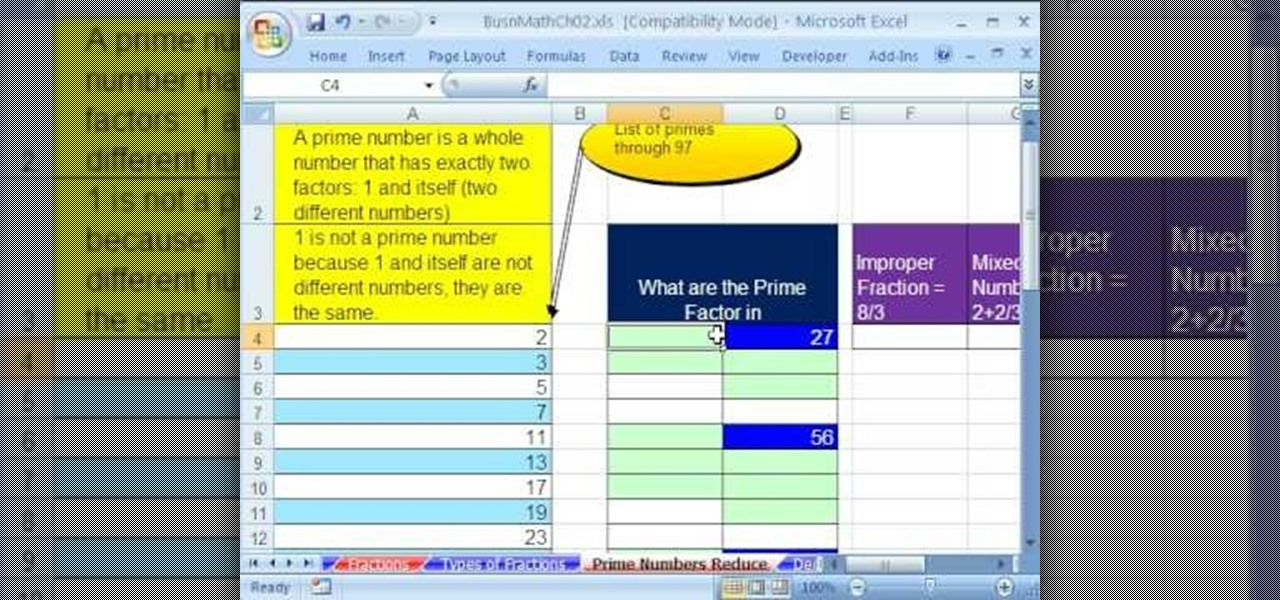
As you might guess, one of the domains in which Microsoft Excel really excels is business math. Brush up on the stuff for your next or current job with this how-to. In this tutorial from everyone's favorite digital spreadsheet guru, YouTube's ExcelIsFun, the 17th installment in his "Excel Business Math" series of free video lessons, you'll learn how to define prime numbers, determine prime factors, reduce fractions (i.e., write fractions in their lowest terms) and convert mixed numbers to imp...
If you use Microsoft Excel on a regular basis, odds are you work with numbers. Put those numbers to work. Statistical analysis allows you to find patterns, trends and probabilities within your data. In this MS Excel tutorial from everyone's favorite Excel guru, YouTube's ExcelsFun, the 40th installment in his "Excel Statistics" series of free video lessons, you'll learn how to calculate range & interquartile range for variability using the MAX, MIN, QUARTILE functions.
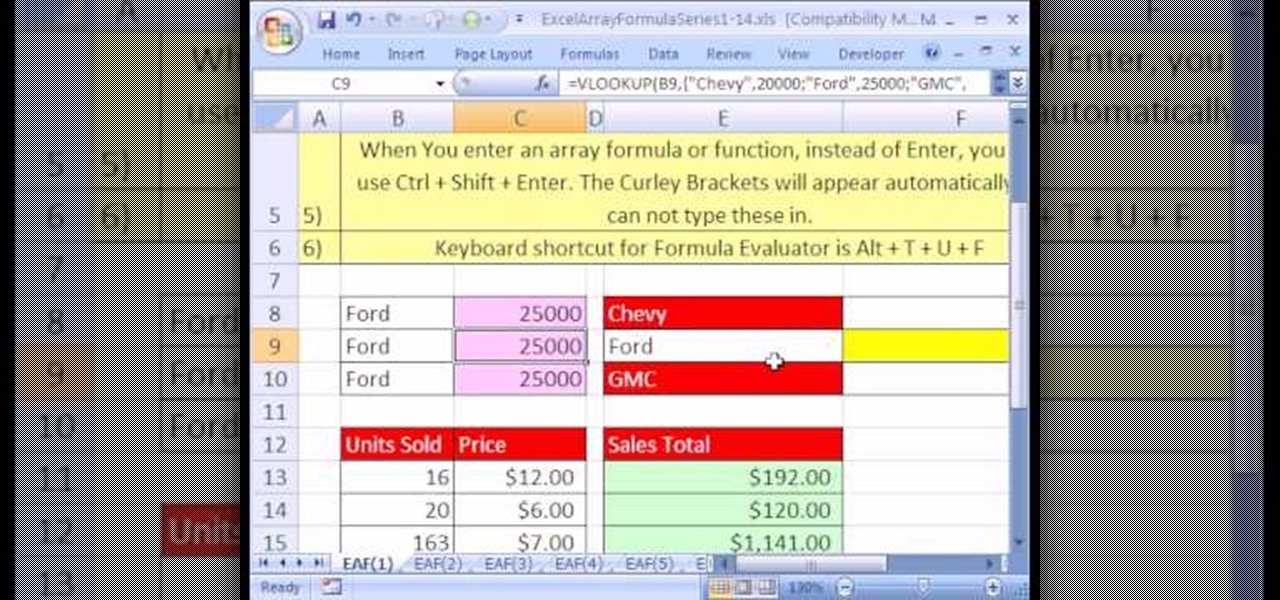
Looking for a primer on how to create and work with arrays in Microsoft Office Excel? You've come to the right place. In this free video tutorial from everyone's favorite MS Excel guru, YouTube's ExcelIsFun, the very first installment in his series of Excel array formula series, you'll learn how to create a basic array formula. Learn about the syntax, the Ctrl + Shift + Enter method of formula entry and the curly brackets that get entered automatically by Excel.
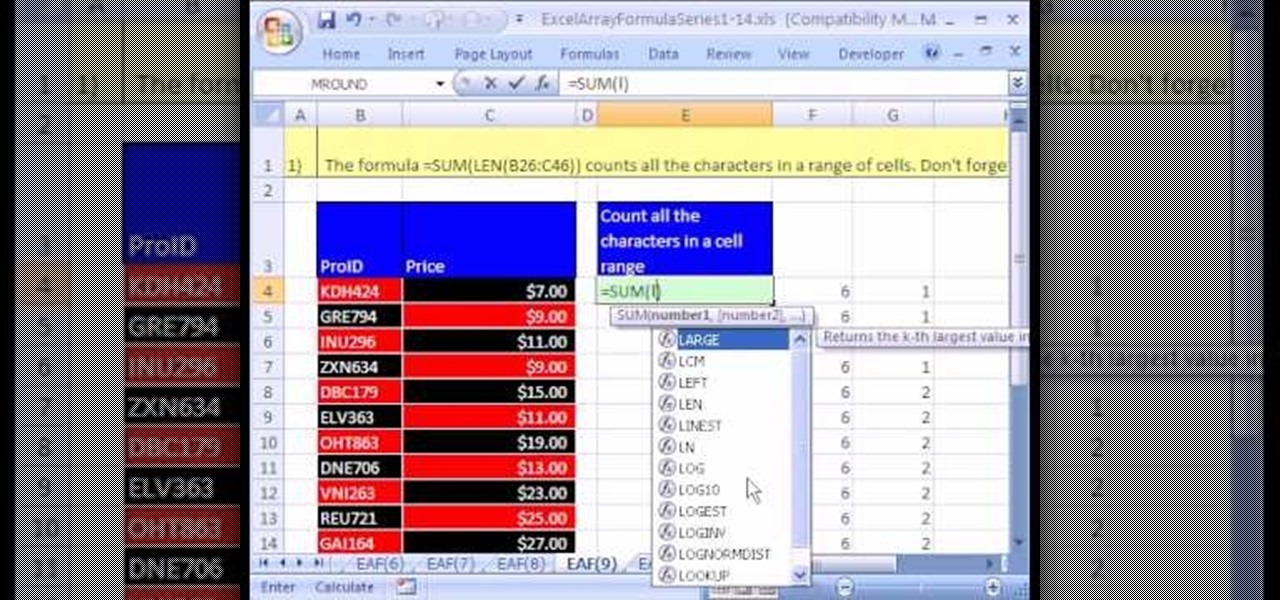
Looking for a primer on how to create and work with array formulas in Microsoft Office Excel? You've come to the right place. In this free video tutorial from everyone's favorite MS Excel guru, YouTube's ExcelIsFun, the 9th installment in his series of Excel array formula series, you'll learn create array formula that counts all the characters in a range of cells.
Looking for a primer on how to create and work with array formulas in Microsoft Office Excel? You've come to the right place. In this free video tutorial from everyone's favorite MS Excel guru, YouTube's ExcelIsFun, the 12th installment in his series of Excel array formula series, you'll learn how to use the array function MMULT to multiply multiple matrices in matrix algebra. (NB: This is an array function that requires the Ctrl + Shift + Enter trick.)
Looking for a primer on how to create and work with names in Microsoft Office Excel? You've come to the right place. In this free video tutorial from everyone's favorite MS Excel guru, YouTube's ExcelIsFun, the 12th installment in his series of Excel name tricks, you'll learn how to use the built-in dynamic range names in Excel 2007 Tables.
Looking for a primer on how to create and work with names in Microsoft Office Excel? You've come to the right place. In this free video tutorial from everyone's favorite MS Excel guru, YouTube's ExcelIsFun, the 10th installment in his series of Excel name tricks, you'll learn how to store lookup tables in memory using a named array.
Looking for a primer on how to create and work with names in Microsoft Office Excel? You've come to the right place. In this free video tutorial from everyone's favorite MS Excel guru, YouTube's ExcelIsFun, the 8th installment in his series of Excel name tricks, you'll learn how to name cell ranges with relative cell references instead of the default absolute cell references.
If you use Microsoft Excel on a regular basis, odds are you work with numbers. Put those numbers to work. Statistical analysis allows you to find patterns, trends and probabilities within your data. In this MS Excel tutorial from everyone's favorite Excel guru, YouTube's ExcelsFun, the 86th installment in his "Excel Statistics" series of free video lessons, you'll learn how to construct confidence intervals for proportions using NORMSINV function and other formulas.
If you use Microsoft Excel on a regular basis, odds are you work with numbers. Put those numbers to work. Statistical analysis allows you to find patterns, trends and probabilities within your data. In this MS Excel tutorial from everyone's favorite Excel guru, YouTube's ExcelsFun, the 87th installment in his "Excel Statistics" series of free video lessons, you'll learn how to calculate sample size (n) for confidence intervals.
If you use Microsoft Excel on a regular basis, odds are you work with numbers. Put those numbers to work. Statistical analysis allows you to find patterns, trends and probabilities within your data. In this MS Excel tutorial from everyone's favorite Excel guru, YouTube's ExcelsFun, the 27th installment in his "Excel Statistics" series of free video lessons, you'll learn how to create a quantitative data dot plot chart using the REPT and COUNTIF functions.
If you use Microsoft Excel on a regular basis, odds are you work with numbers. Put those numbers to work. Statistical analysis allows you to find patterns, trends and probabilities within your data. In this MS Excel tutorial from everyone's favorite Excel guru, YouTube's ExcelsFun, the 26th installment in his "Excel Statistics" series of free video lessons, you'll learn how to create quantitative data cumulative frequency distributions with pivot tables.
If you use Microsoft Excel on a regular basis, odds are you work with numbers. Put those numbers to work. Statistical analysis allows you to find patterns, trends and probabilities within your data. In this MS Excel tutorial from everyone's favorite Excel guru, YouTube's ExcelsFun, the 16th installment in his "Excel Statistics" series of free video lessons, you'll learn how to cross tabulate & do percentage cross tabulation for categorical data using a pivot table (PivotTable).
If you use Microsoft Excel on a regular basis, odds are you work with numbers. Put those numbers to work. Statistical analysis allows you to find patterns, trends and probabilities within your data. In this MS Excel tutorial from everyone's favorite Excel guru, YouTube's ExcelsFun, the 19th installment in his "Excel Statistics" series of free video lessons, you'll learn how to group categories in a frequency distribution with a formula (2 COUNTIF) and the pivot table (PivotTable) grouping fea...
If you use Microsoft Excel on a regular basis, odds are you work with numbers. Put those numbers to work. Statistical analysis allows you to find patterns, trends and probabilities within your data. In this MS Excel tutorial from everyone's favorite Excel guru, YouTube's ExcelsFun, the 17th installment in his "Excel Statistics" series of free video lessons, you'll learn how to cross tabulate & do percentage cross tabulation for categorical data using formulas rather than pivot tables.
If you use Microsoft Excel on a regular basis, odds are you work with numbers. Put those numbers to work. Statistical analysis allows you to find patterns, trends and probabilities within your data. In this MS Excel tutorial from everyone's favorite Excel guru, YouTube's ExcelsFun, the 3rd installment in his "Excel Statistics" series of free video lessons, you'll learn how to use Excel's sorting and pivot tables (PivotTables) data analysis tools.
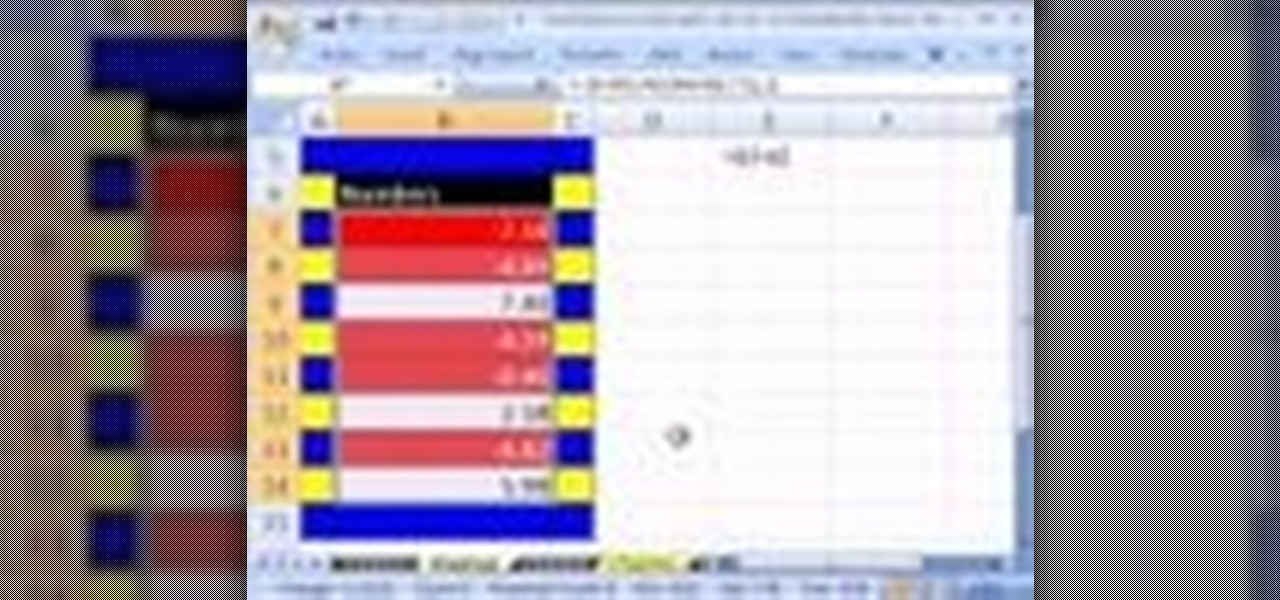
Love Microsoft Excel? This clip contains a tip that just might induce you to. With this free video tutorial from ExcelIsFun, the 4nd installment of his "YouTubers Love Excel 2007" or YTLE2k7 series of free video MS Excel lessons, you'll learn how to use conditional formatting to add red to negative numbers and green to positive numbers using a single True/False formula!
If you use Microsoft Excel on a regular basis, odds are you work with numbers. Put those numbers to work. Statistical analysis allows you to find patterns, trends and probabilities within your data. In this MS Excel tutorial from everyone's favorite Excel guru, YouTube's ExcelsFun, the 35th installment in his "Excel Statistics" series of free video lessons, you'll learn how to calculate weighted and geometric means and see how to use the GEOMEAN function.
If you use Microsoft Excel on a regular basis, odds are you work with numbers. Put those numbers to work. Statistical analysis allows you to find patterns, trends and probabilities within your data. In this MS Excel tutorial from everyone's favorite Excel guru, YouTube's ExcelsFun, the 33rd installment in his "Excel Statistics" series of free video lessons, you'll learn how to use the AVEARGE, MEDIAN, MODE, PERCENTILE, QUARTILE and PERCENTILERANK functions to measure location.
If you use Microsoft Excel on a regular basis, odds are you work with numbers. Put those numbers to work. Statistical analysis allows you to find patterns, trends and probabilities within your data. In this MS Excel tutorial from everyone's favorite Excel guru, YouTube's ExcelsFun, the 4th installment in his "Excel Statistics" series of free video lessons, you'll learn how to create a frequency table and percentage frequency table using a Pivot Table (PivotTable).
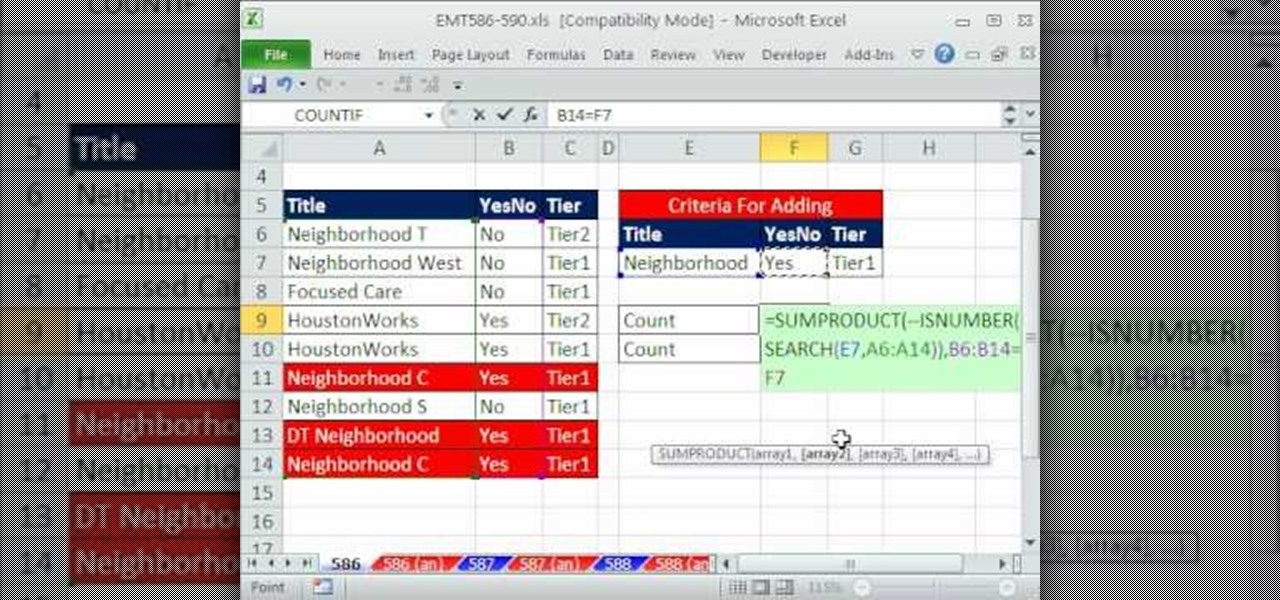
New to Microsoft Excel? Looking for a tip? How about a tip so mind-blowingly useful as to qualify as a magic trick? You're in luck. In this MS Excel tutorial from ExcelIsFun, the 586th installment in their series of digital spreadsheet magic tricks, you'll learn how to enumerate rows that meet 3 using the SEARCH function.
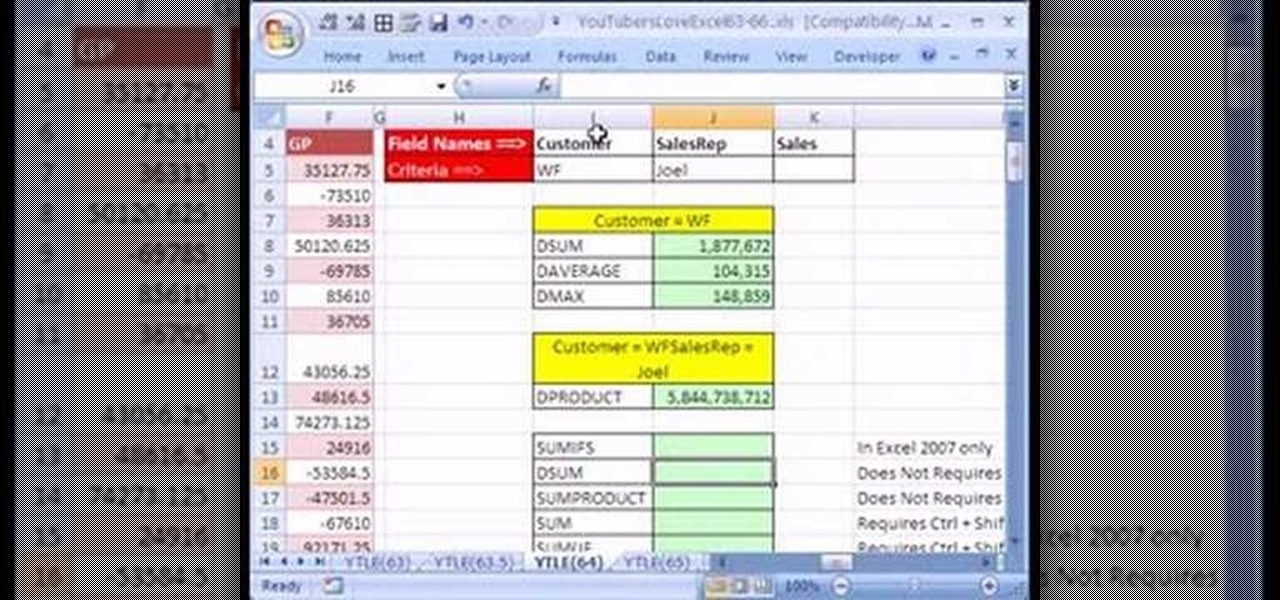
video tutorial from ExcelIsFun, the 64th installment of his "YouTubers Love Excel" or YTLE series of free video MS Excel lessons, you'll learn how to Excel's D (i.e., database) functions such as DSUM, DAVERAGE, and DMAX.
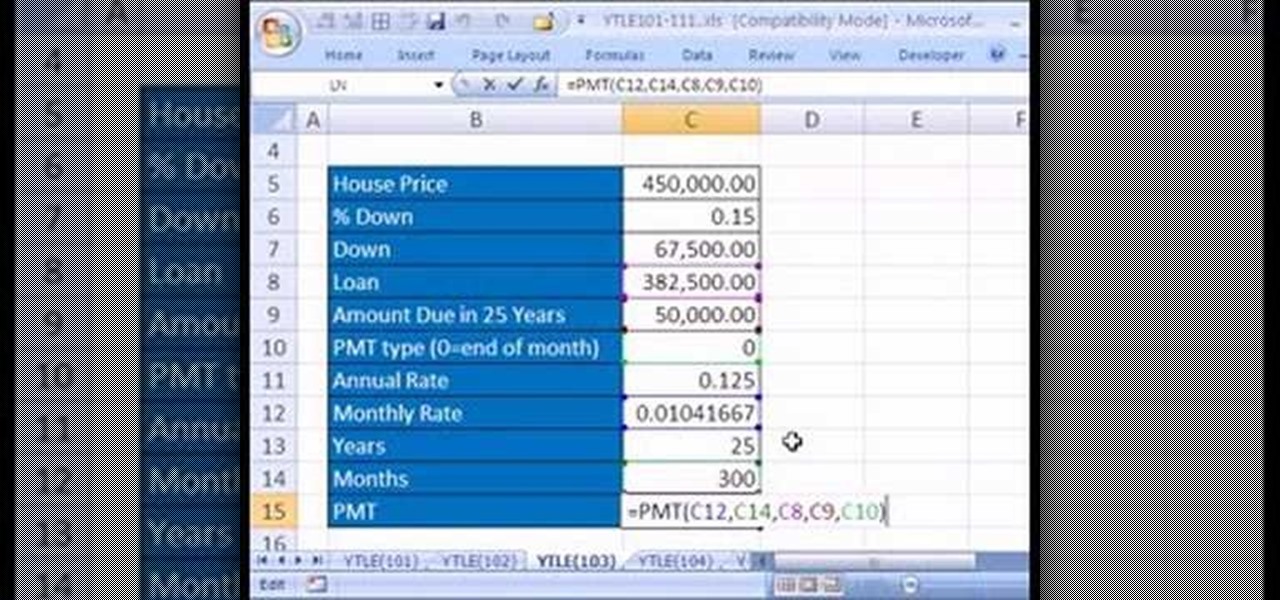
Love Microsoft Excel? This clip contains a tip that just might induce you to. With this free video tutorial from ExcelIsFun, the 103rd installment of his "YouTubers Love Excel" or YTLE series of free video MS Excel lessons, you'll learn how to use Goal Seek to change a formula input number so that the formula is a desired result. Also learn how to use the PMT function.
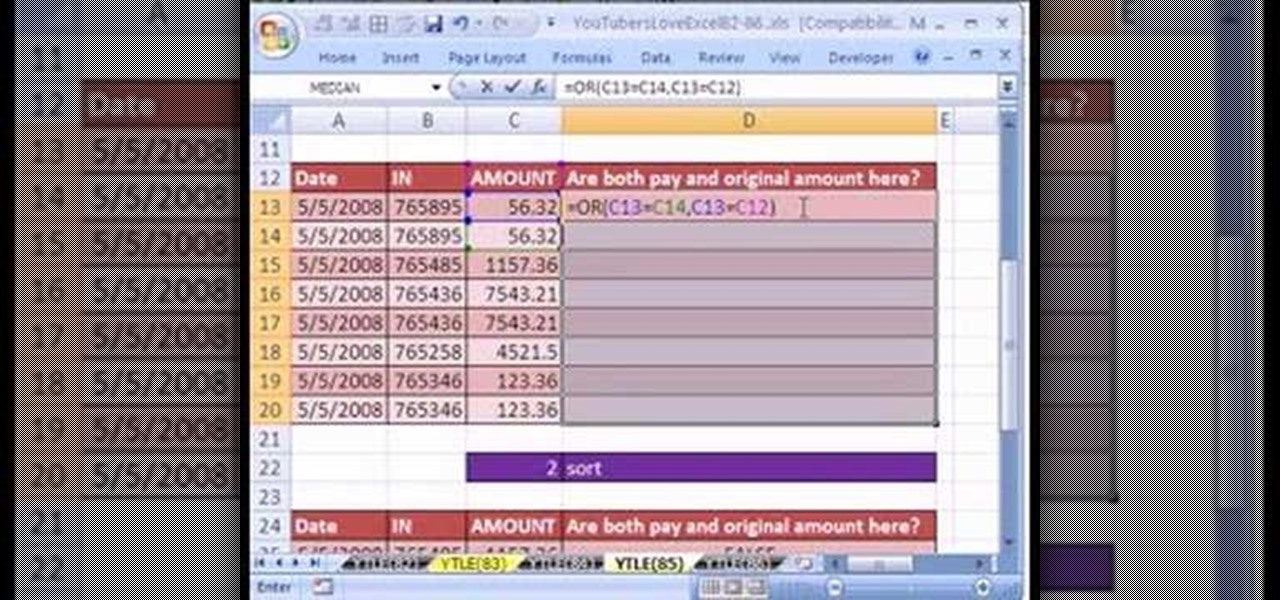
Love Microsoft Excel? This clip contains a tip that just might induce you to. With this free video tutorial from ExcelIsFun, the 85th installment of his "YouTubers Love Excel" or YTLE series of free video MS Excel lessons, you'll learn how to isolate unique records with the OR function.
Love Microsoft Excel? This clip contains a tip that just might induce you to. With this free video tutorial from ExcelIsFun, the 74th installment of his "YouTubers Love Excel" or YTLE series of free video MS Excel lessons, you'll learn how to fix bad data with the CLEAN & TRIM functions.
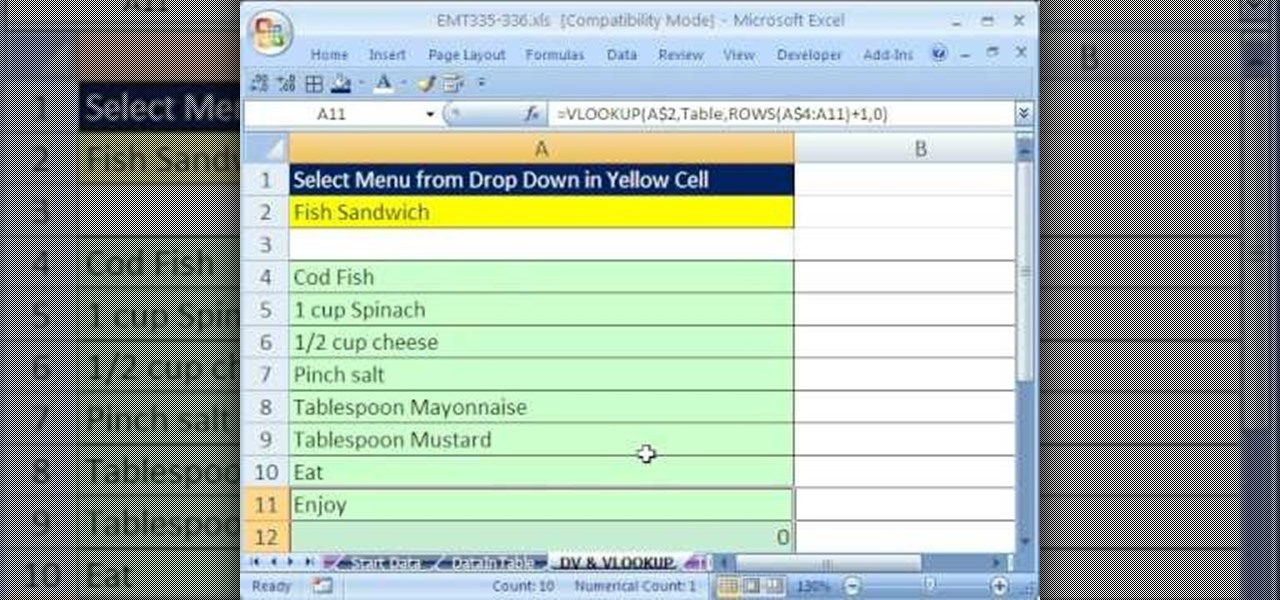
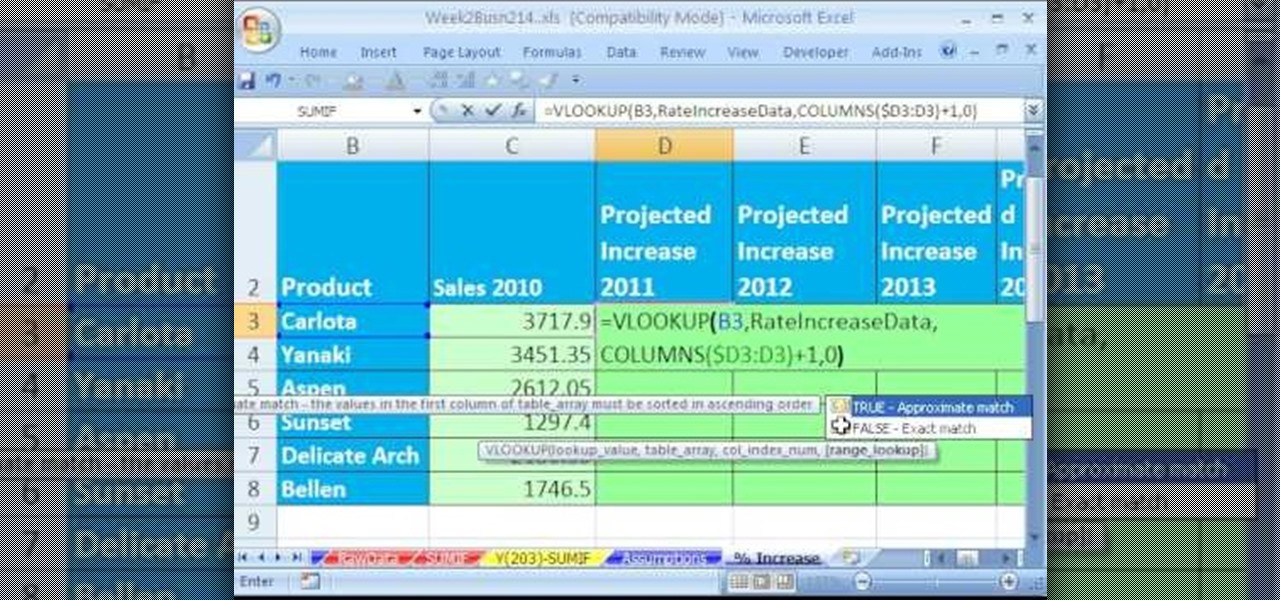
New to Microsoft Excel? Looking for a tip? How about a tip so mind-blowingly useful as to qualify as a magic trick? You're in luck. In this MS Excel tutorial from ExcelIsFun, the 335th installment in their series of digital spreadsheet magic tricks, you'll learn how to increment column numbers for a VLOOKUP lookup table when you are copying the formula down across the rows (down a column).
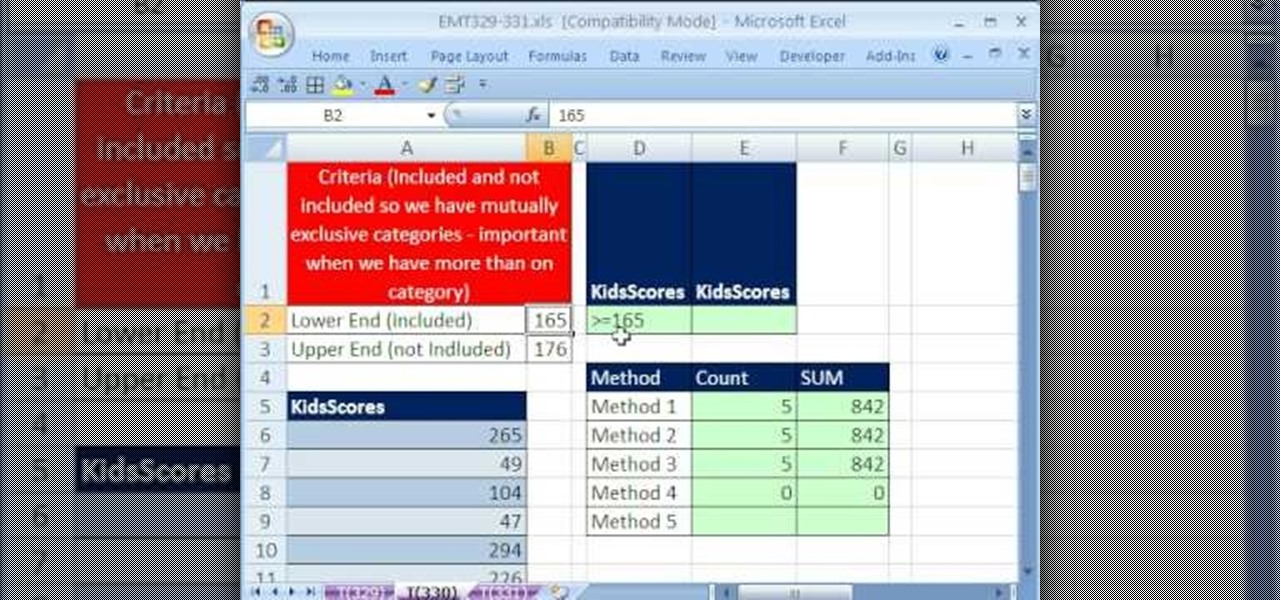
New to Microsoft Excel? Looking for a tip? How about a tip so mind-blowingly useful as to qualify as a magic trick? You're in luck. In this MS Excel tutorial from ExcelIsFun, the 90th installment in their series of digital spreadsheet magic tricks, you'll learn how to use the DSUM and DCOUNT functions to sum or count between an upper and lower limit.
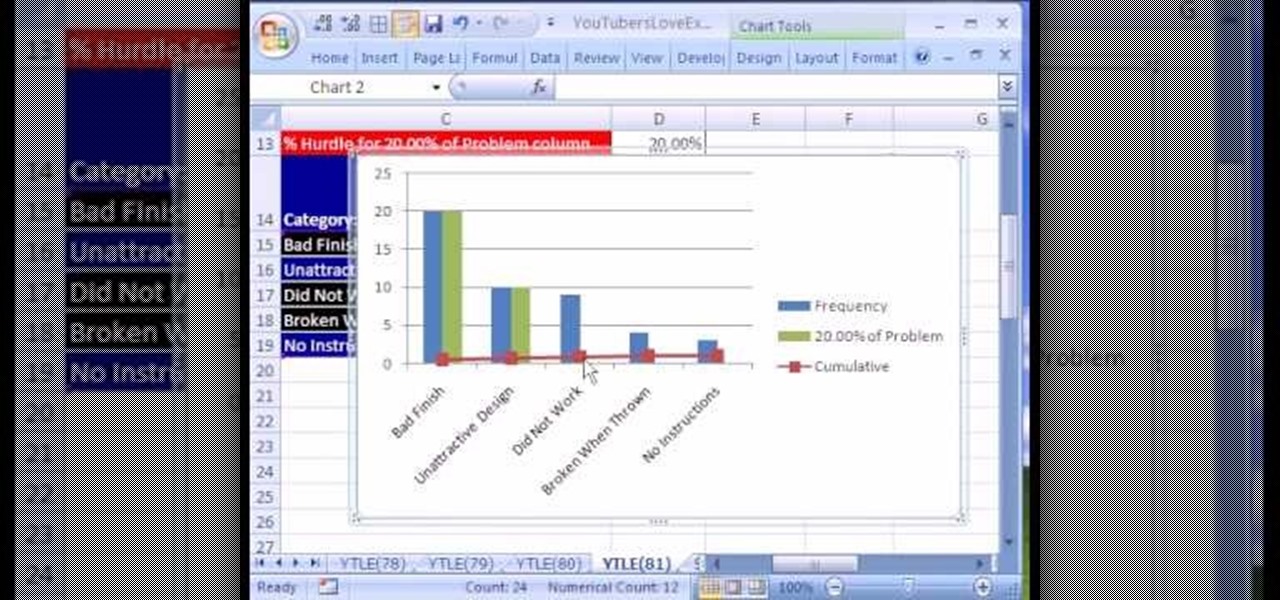
Love Microsoft Excel? This clip contains a tip that just might induce you to. With this free video tutorial from ExcelIsFun, the 81st installment of his "YouTubers Love Excel" or YTLE series of free video MS Excel lessons, you'll learn how to add conditional formatting to a chart by creating a new column of data with a formula.
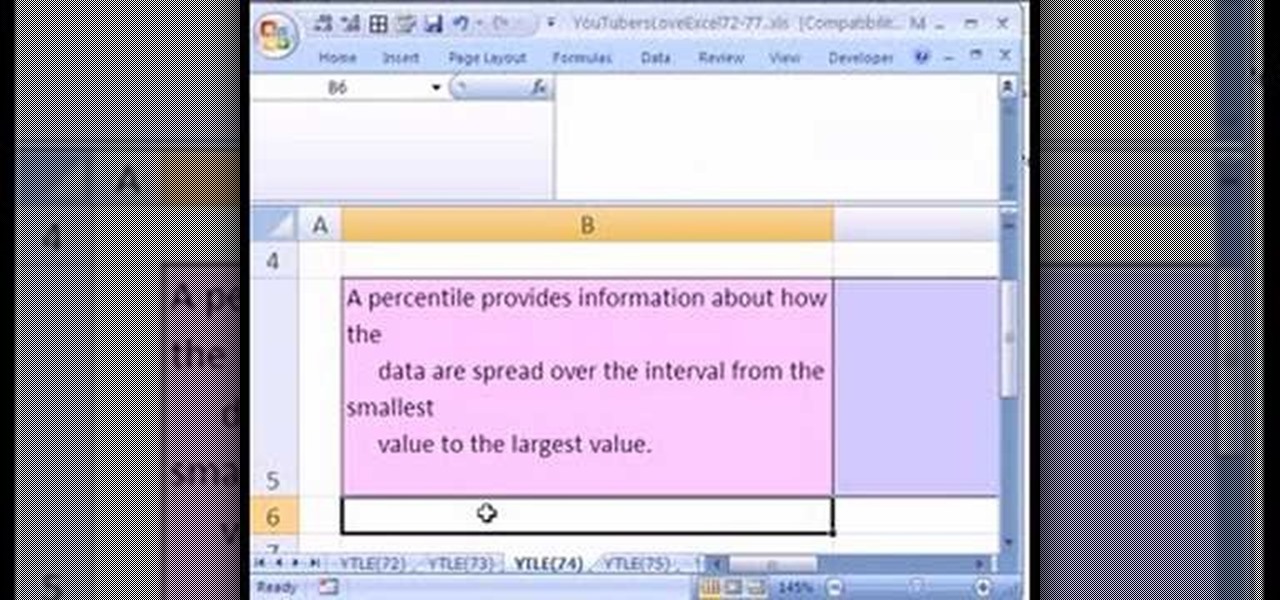
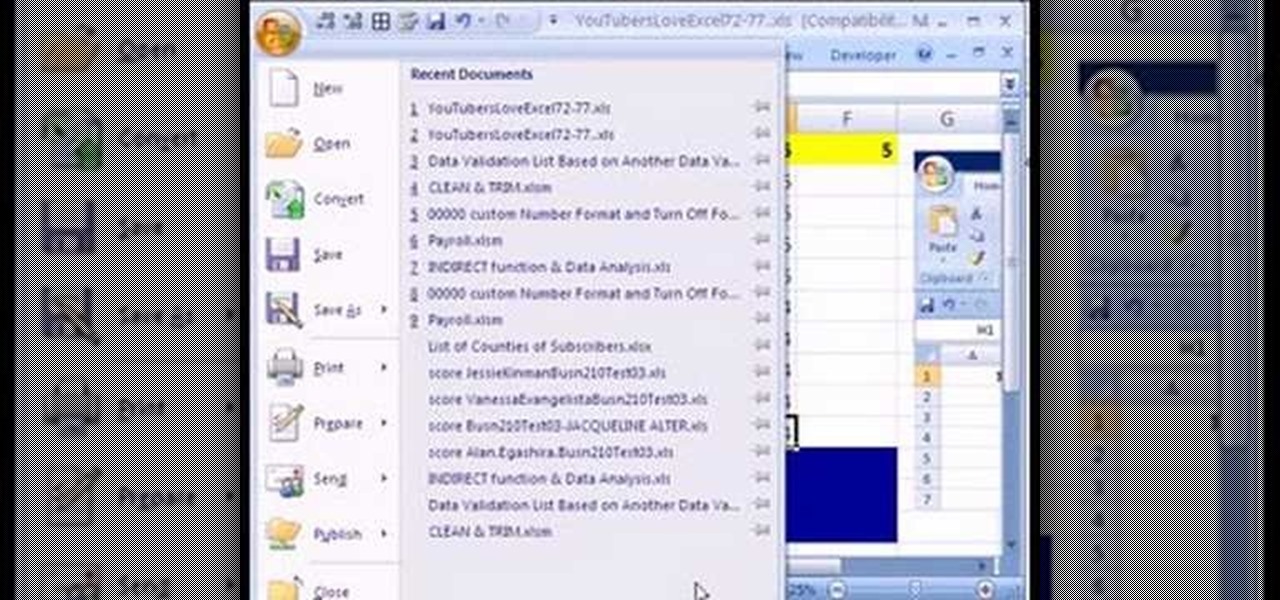
Love Microsoft Excel? This clip contains a tip that just might induce you to. With this free video tutorial from ExcelIsFun, the 72nd installment of his "YouTubers Love Excel" or YTLE series of free video MS Excel lessons, you'll learn how to turn off auto formatting so that column and row formatting or formulas are not automatically created.
Love Microsoft Excel? This clip contains a tip that just might induce you to. With this free video tutorial from ExcelIsFun, the 101st installment of his "YouTubers Love Excel" or YTLE series of free video MS Excel lessons, you'll learn how to use conditional formatting AND custom number formatting to add styling to a cell.