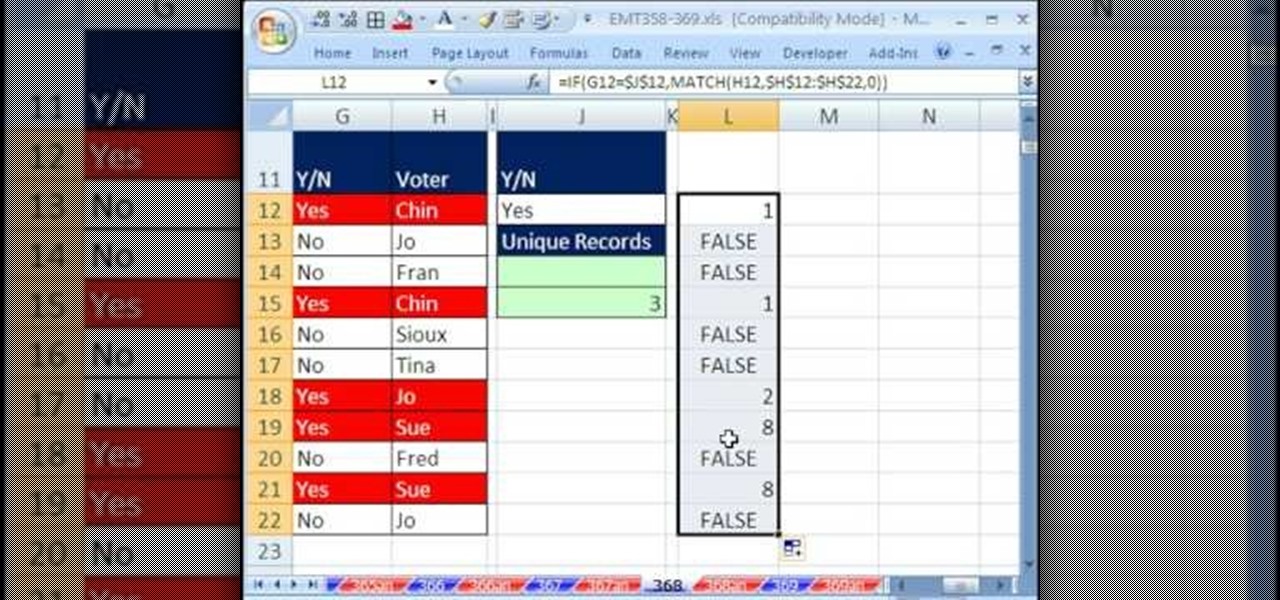
New to Excel? Looking for a tip? How about a tip so mind-blowingly useful as to qualify as a magic trick? You're in luck. With this video tutorial from ExcelIsFun, the 368th installment in their series of digital spreadsheet video tutorials, you'll learn how to create and use an array formula that will permit you to count unique items within a column while specifying more than one criterion. This guide uses the SUM, IF FREQUENCY, MATCH, ROW, and ISNUMBER functions (in a somewhat unusual combi...

In Scooby's opinion, pushups are the #1 best exercise you can do! They are simple to do and are a great upper body workout for the complete beginner or the advanced bodybuilder. You can get a complete upper body workout by combining these pushups with crunches and pullups, all of which can be done easily at home.
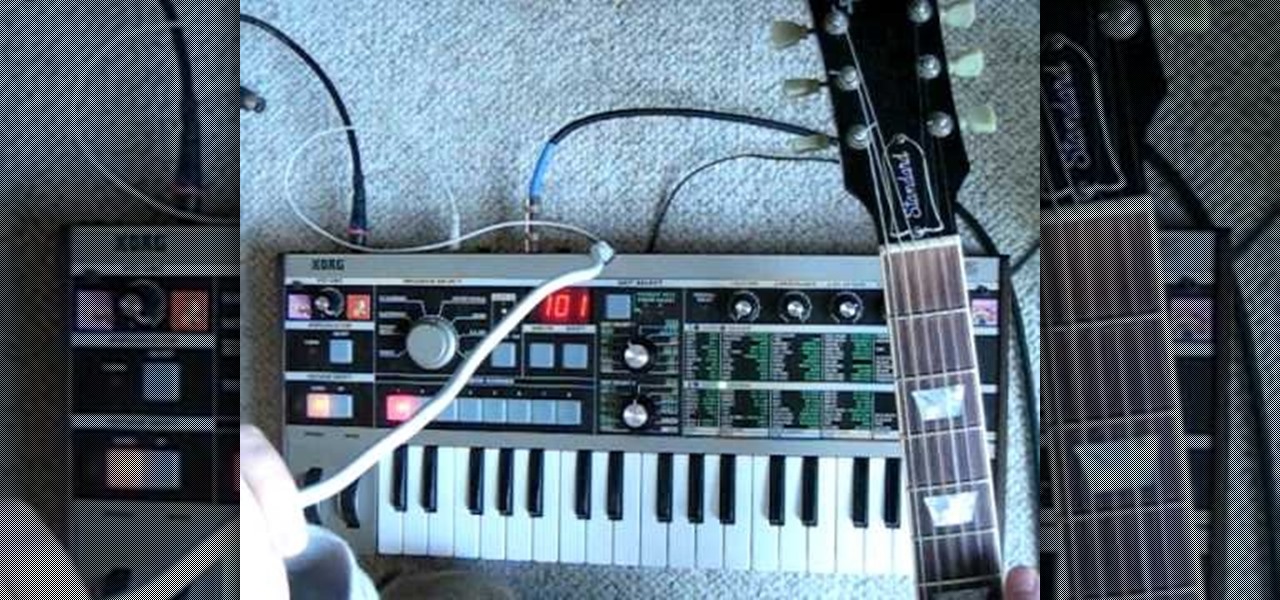
Many MicroKorg enthusiasts focus on it's synthesizer functions, but it's also a vocoder, and nowhere is that more apparent than in this video. It will teach you how to connect an electric guitar and a mic to your MicroKorg and use them together so that you can hear your voice on your guitar. It's very worth it.
Check out this overclocking tutorial from HotHardware.com! Intel's Core i7 processor offers a significant performance increase over previous generation Core 2 processors. In addition, like the legacy Core 2 architecture, the new Core i7 also has a bunch more headroom for wringing upside performance out of the chip, maximizing value, power and return on your investment with overclocking. In fact, Intel actually built-in a predefined overclocking feature called "Turbo Mode". We explain how not ...

Dave and Pat break down the basics of RFID technology and show you how to put it to use by building an RFID beer safe!
As a parent, navigating smartphone usage with your children can be a perilous journey as you hand them that new device they've always wanted, or even your older hand-me-down phone or tablet.

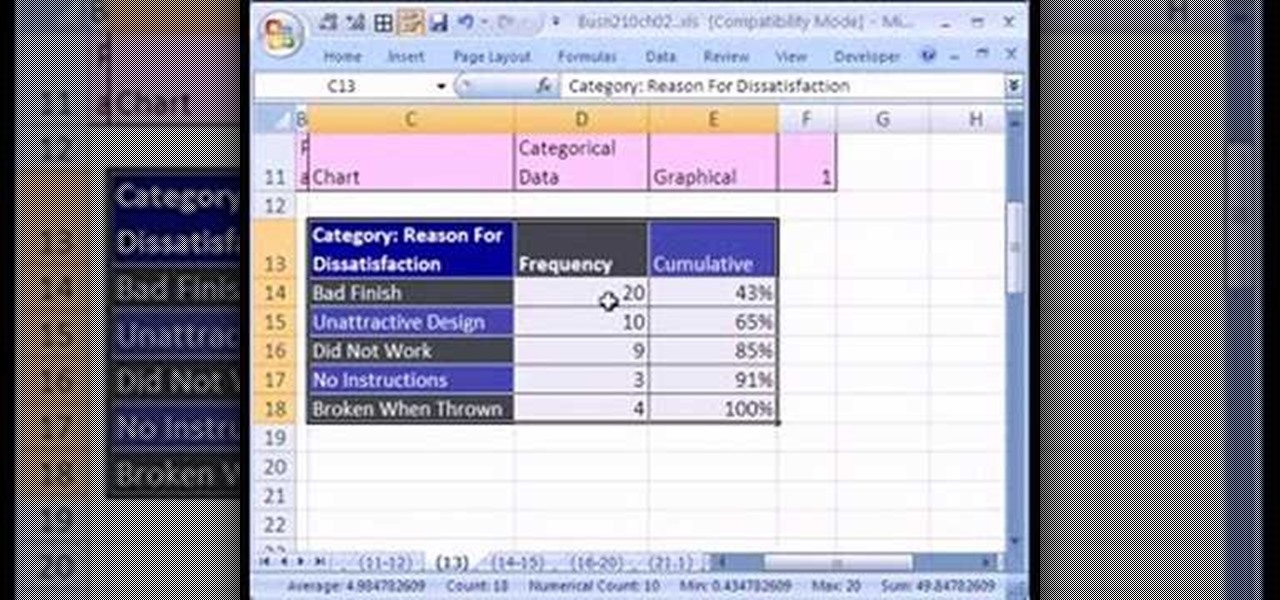
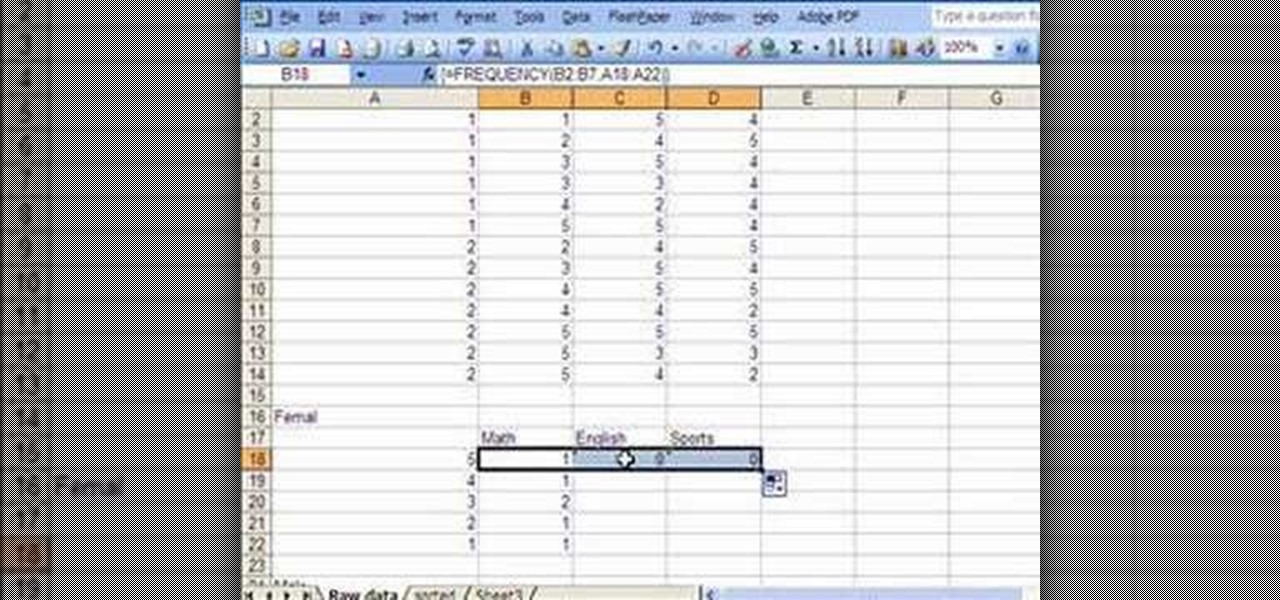
If you want to create a Pareto Chart for categorical data in MS Excel you should first have your data input into Excel already. From your data, you should highlight the cells that you want to count the frequency for and in the frequency box you should type in =COUNTIF and highlight the data you want the frequency for and put in F4 and then press , click on cell to the left and click enter. Now this will work all the way down. If you have not sorted it, you can right click and then click sort....
A histogram is a summary graph showing a count of data points that fall in various ranges. Histograms are used in statistics and other forms of mathematics. In this video, learn how to create your own histogram using data analysis on the computer. This tutorial will show you how to create a frequency distribution, a cumulative frequency distribution, a histogram chart and an ogive chart with the data analysis add-in.
5G is undoubtedly the future of mobile networks, and there's a good chance your next phone will have it. But just like with 4G, as carriers race to get the best 5G coverage, the ones running behind are abusing marketing terms to make themselves seem further ahead than they actually are.
We are now in the age of 5G. Carriers worldwide are upgrading their networks to the newest standard for mobile, which will dramatically improve your phone experience. How? By giving it download speeds and latency that surpass Wi-Fi. But before you upgrade, there are few things you should know first.
In this how-to video, you will learn how to use the instrument landing system in Microsoft Flight Simulator X. First, open the FSX map. Click on the airport and an ILS frequency will be displayed. Put the ILS frequency in your radio panel. Switch using the arrows and confirm by clicking on the buttons shown. With the displayed dial you are going to do the approach. The vertical bar indicates whether you are on a good glide or not. The horizontal bar indicates whether you are on the runway. Wh...
All waves in the electromagnetic spectrum (light, x-rays, radio waves, microwaves, etc.) travel at the speed of light c=299,792,458 m/s. For any wave, the wavelength times the frequency yields the speed:
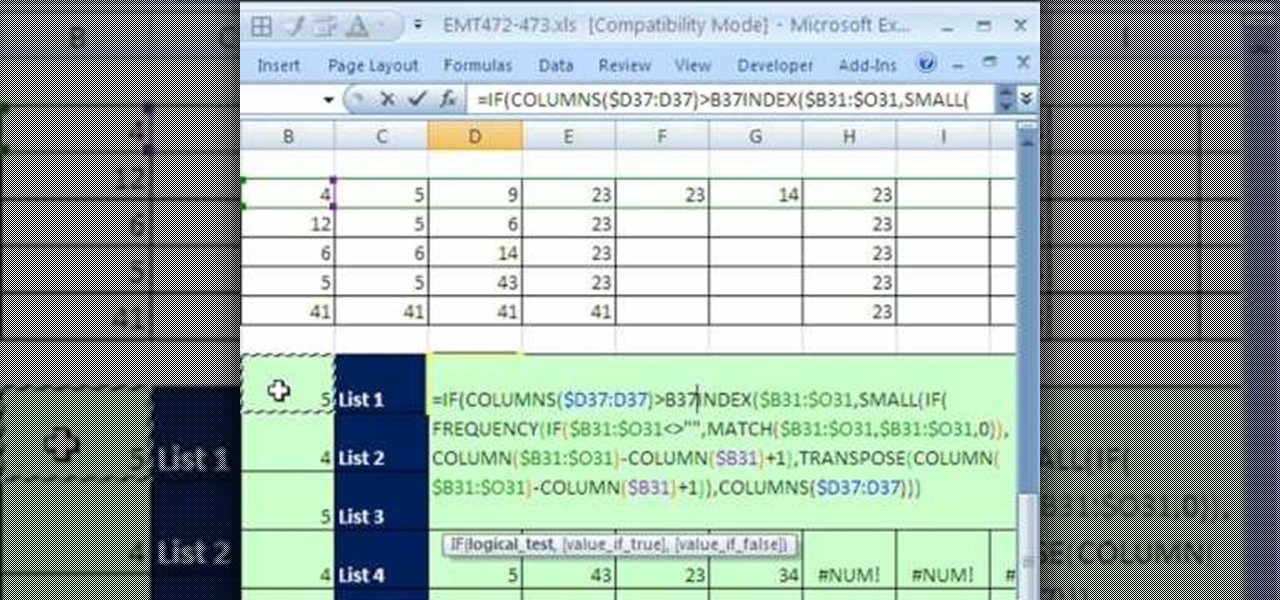
New to Excel? Looking for a tip? How about a tip so mind-blowingly advanced as to qualify as a magic trick? You're in luck. In this Excel tutorial from ExcelIsFun, the 473rd installment in their series of digital spreadsheet magic tricks, you'll learn how to extract a unique list from a group of individual rows.
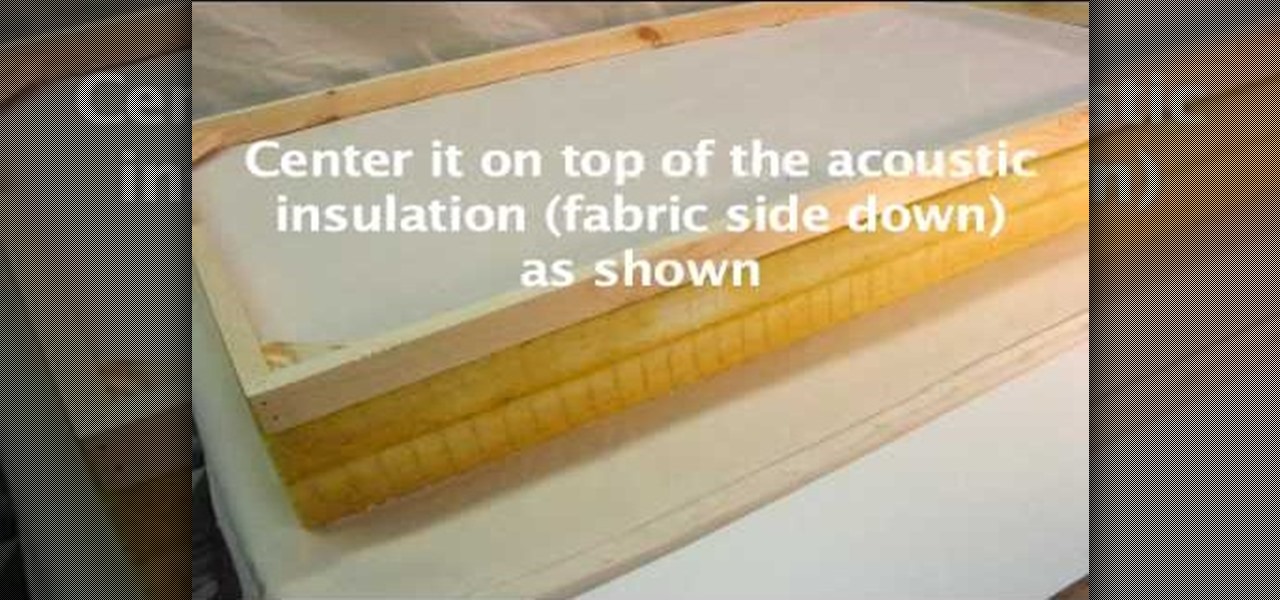
Learn to make your own super effective bass traps and acoustic panels with materials from your local hardware store, just by watching this home audio video tutorial.
In 2017, after purchasing a majority of the 600 MHz frequency, T-Mobile began a massive rollout of the new LTE Bands across the US. However, there are currently only two devices that support the frequency, also known as LTE Band 71. Thanks to a recent FCC listing, we've learned this number will double when the Galaxy S9 and S9+ debut next month.
In this Tutorial I will show you how you can use the frequency of letters to decrypt the famous Caesar cipher. I hope it is easy to understand and helpful for getting in touch with basic cryptanalysis. If you find any mistakes or have questions feel free to ask me. Finally I ask you to give me feedback which I will take into account for the next part.
In this video tutorial the instructor demonstrates resonant frequency. In this video the instructor shows the sound of resonance and how to generate it. Resonance is a forced vibration of energy into molecules of an object that makes those molecules vibrate at their resonant frequency. When these molecules vibrate naturally they produce a kind of noise that can be annoying some times. In this video the author makes a small object using a rubber band and a net that produces vibrations when rot...
This tutorial will show you how to achieve romantic curls. All you need is a curling iron and some helpful advice from Michelle Phan. Create pretty curls for Valentine's Day in no time.
First of all you have to go to 'logic pro' and select any instrument you want to play. Here you can choose a synthesizer. Now click on the record button at the bottom and it shall start playing and produce a loop. Now from the side bar you can select the ‘low pass filter’ and change the ‘frequency’. From the new pop out, you can change the volume or the note. You can click in ‘command 'L' to open the keyboard ‘assignments settings’ and click where you want to add it. In this case you have to ...
HOW TO UNLOCK & USE THE FM TRANSMITTER ON NOKIA N900: Nokia N900 officially has FM Radio receiver but not a transmitter. Here are step by step procedure to enable & use the FM transmitter facility.
This is a tutorial video on uploading HD quality video onto YouTube. The video is simply a screen shot view of the YouTube home page. As the narrator goes through the steps the cursor moves and clicks on what you should click on. He advises to click on upload; he clicks to choose a video. The video must have a certain resolution to be assigned HD video. He indicates that YouTube will accept a variety of file formats to upload. You must use the 44.1 kHz frequency rates to get the best resoluti...
On this episode of Scientific Tuesdays, Dylan shows you how to create a non-Newtonian fluid using corn starch and a little water. A non-Newtonian fluid is any fluid that does not follow the laws of physics.
Tom Wiggins from Stuff.tv shows you how to pimp your PS3 in 3 easy steps. Here's 3 ways to get the best out of it. First up upscale to make sure you are getting 1080p. Second, change your audio output settings to get premium sound quality. This will change your output to CD quality output frequency. This will depend on your hifi. Finally, expanding your harddrive is not as easy as plug and play. You need a 2.5" laptop style harddrive add-on. Mod the stock harddrive and increase your storage s...
While music may not technically be a "universe language," it is the one language listened to by all. There are over 1,500 music genres today—rap, classical, rock, jazz, trap, hip-hop, house, new wave, vaperwave, charred death, nintendocore... and the list goes on. And if you're like most people, you now probably listen to the majority of your music on your phone.
Multiband processing allows you to apply an effect to only those parts of a track that fall within a certain frequency range. This official video guide from James Bernard of Propellerhead will teach you everything you'll need to know to use multiband processing (like multiband compression) in your own Reason & Record sessions. Whether you're new to Propellerhead's virtual music studio application, Reason, or their newer DAW app, Record, you're sure to find much to take away from this brief vi...
There will never be as many ways to quiet the vuvuzela sounds that buzz out of your TV constantly while you watch this World Cup as there are people bothered by the noise, but there are still quite a few. This video will show you how to use a hardware equalizer to cut out certain frequency ranges, largely muting the sound of the reviled horns. If you have a hardware EQ or are willing to buy one just for this, try it!
New to Microsoft Excel? Looking for a tip? How about a tip so mind-blowingly useful as to qualify as a magic trick? You're in luck. In this MS Excel tutorial from ExcelIsFun, the 616th installment in their series of digital spreadsheet magic tricks, you'll learn how to use the LARGE and SMALL functions to retrieve the 1st, 2nd, and 3rd largest values from a list. You'll also see how to do each of the following:
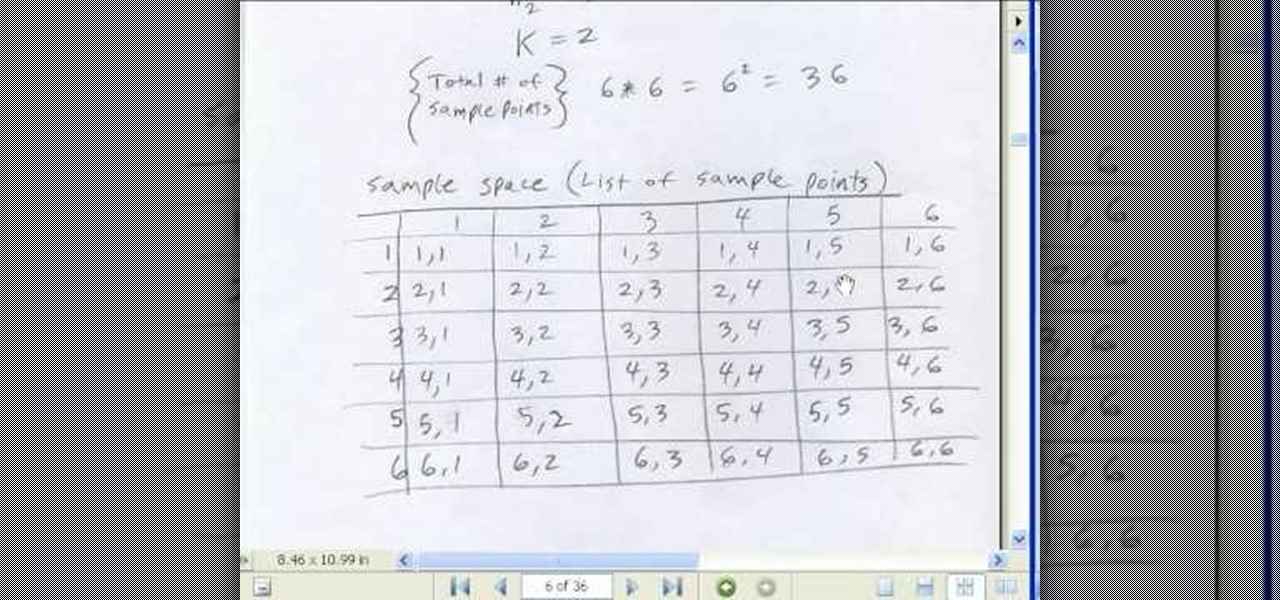
If you use Microsoft Excel on a regular basis, odds are you work with numbers. Put those numbers to work. Statistical analysis allows you to find patterns, trends and probabilities within your data. In this MS Excel tutorial from everyone's favorite Excel guru, YouTube's ExcelsFun, the 50th installment in his "Excel Statistics" series of free video lessons, you'll learn the basics of probability:
The video shows you how to calculate capital budgeting with a Texas Instruments BA2+ financial calculator. Capital budgeting will help you determine cash flows for given investments for a certain number of years in the future, thus helping you determine if the investment is worthwhile. The buttons you will use are the CF (cashflows) button, the NPV (net present value) button, and the IRR (internal rate of return) button. The video uses the example of a $10,000 investment that will return $5,0...
Stop a bladder or urinary tract infection in its tracks by learning what to look for and how to prevent it from getting worse.
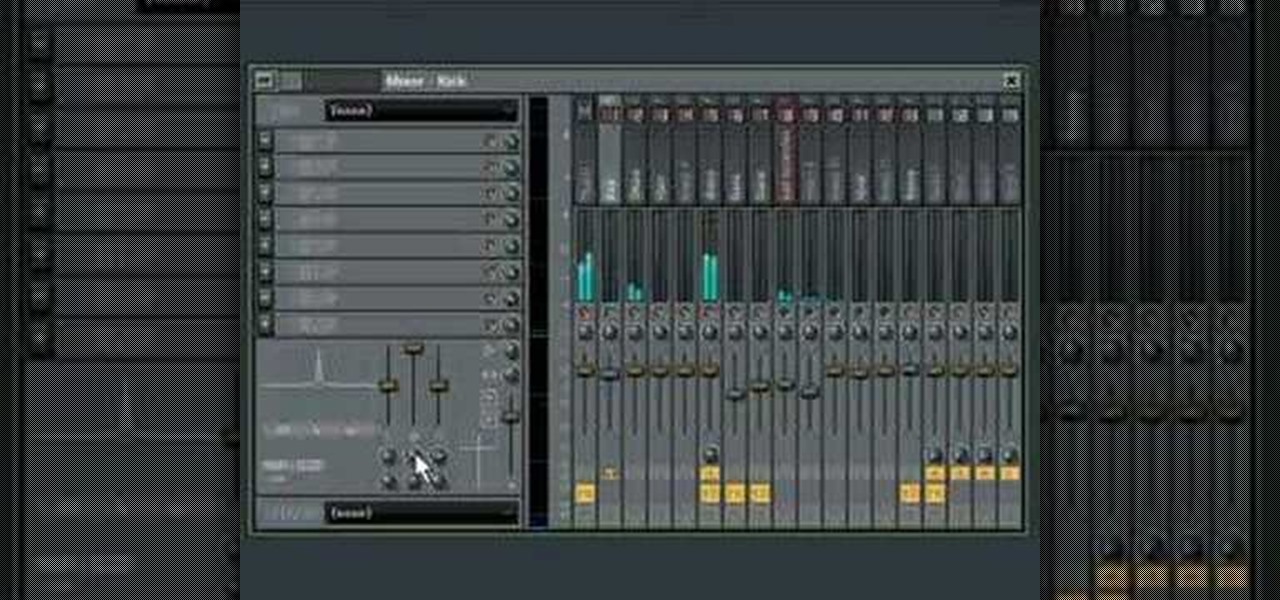
Sometimes we have great individual sounds and we put them together in a mix but they don't gel as good as they should. You might need to find the sweet spot or sour spot in the frequency spectrum. This tutorial shows you how to use the EQ to find the sweet spot when working in FL Studio.
This 3ds Max video tutorial goes over how to create bump maps and how to quickly create one using your existing color map as a starting point in Autodesk's 3D Studio Max digital graphic modeling software in conjunction with Adobe Photoshop. It will also cover how to breakup your bump map with high frequency noise at the shader level for those closeup shots.
In this video you will learn how to make a high voltage, high frequency power supply in just five minutes, and for less than twenty bucks. All you'll need is a compact fluorescent light (CFL) and a flyback transformer to make that alternative energy source of yours.
This video shows you how to use proper lower body position and stride mechanics when running cross country. Learn about stride length, the distance of each step and stride frequency, how fast the legs should turnover.
To combat their poor coverage in rural areas, T-Mobile spent nearly $8 billion on 600 MHz spectrum in 2017, which was converted to LTE Band 71. With such a low frequency, the signal can travel further, providing LTE speeds to more Americans. But your phone also has to support this frequency, and so far, only a handful do.
How you work out your abs determines how they'll appear in the long run. Not only are the type of ab exercises you do important, but also the frequency with which you do them.
New to Microsoft Excel? Looking for a tip? How about a tip so mind-blowingly useful as to qualify as a magic trick? You're in luck. In this MS Excel tutorial from ExcelIsFun, the 713th installment in their series of digital spreadsheet magic tricks, you'll learn how to count the max number of items in succession in a column of data using the FREQUENCY, IF, MAX and ROW functions.
This video introduces how to use Excel to sort data, perform the Frequency function, and present data in line chart. See how to apply condition formatting when working in Microsoft Excel 2007. Whether you're new to Microsoft's popular word processing application application or a seasoned MS Office professional just looking to better acquaint yourself with the Word 2007 workflow, you're sure to be well served by this video tutorial. For more information, and to get started creating your own li...
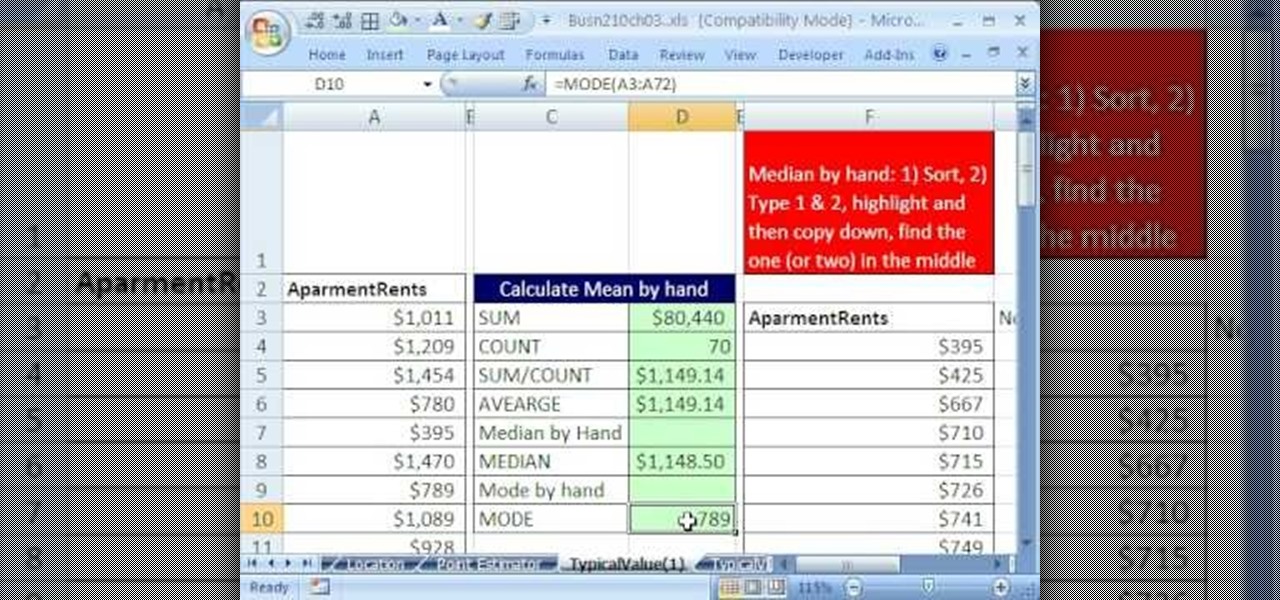
If you use Microsoft Excel on a regular basis, odds are you work with numbers. Put those numbers to work. Statistical analysis allows you to find patterns, trends and probabilities within your data. In this MS Excel tutorial from everyone's favorite Excel guru, YouTube's ExcelsFun, the 34th installment in his "Excel Statistics" series of free video lessons, you'll learn how to use MEAN, MEDIAN, MODE. These measures give us a typical value, a measure of central tendency one value that can repr...
If you use Microsoft Excel on a regular basis, odds are you work with numbers. Put those numbers to work. Statistical analysis allows you to find patterns, trends and probabilities within your data. In this MS Excel tutorial from everyone's favorite Excel guru, YouTube's ExcelsFun, the 20th installment in his "Excel Statistics" series of free video lessons, you'll learn how to take raw quantitative (numerical) data and figure out how to group it into classes so that you can have categories an...