The truck in this video was having a misfire problem during routine service. This video for mechanics will show how to find the problem of this misfire. The first thing to look at is the lab scope. After that, comes time for the smoke machine test to identify a possible cylinder compression leak. Watch and learn. This is very similar for a lot of different automobiles.

This tutorial demonstrates use of the Native Instruments' MASSIVE synthesizer, which shifted the paradigm for software synthesis development in late 2006. MASSIVE's fat, analog sound is unique to the soft-synth world, offering a wide scope of sound design possibilities. But underneath all that, it is an extremely simple-to-use, great-sounding engine that can provide some of the baddest bass tones you've ever heard. And remember: all patches discussed in the video are available through http://...
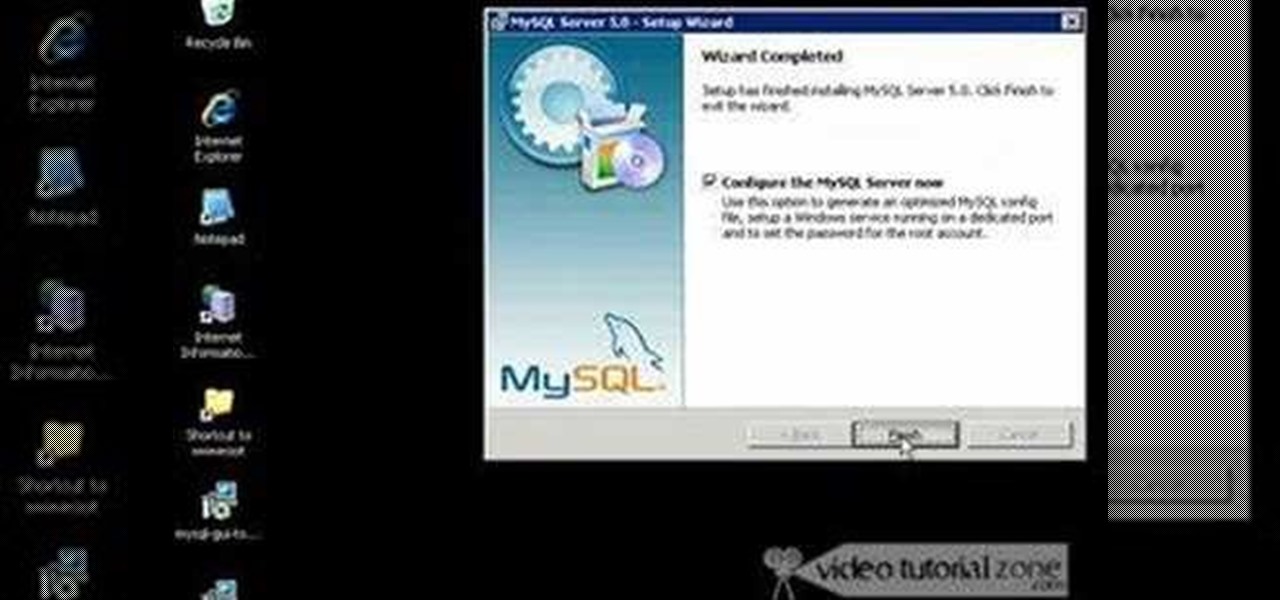
MySQL is a multithreaded, multi-user SQL database management system which has over 10 million installations. It runs as a server providing multi-user access to databases. It is by far the most popular and common database used in web applications throughout the world, and almost all hosting companies provide it free of charge to their users. MySQL AB makes MySQL Server available as free software under the GNU General Public License (GPL). For this tutorial we are going to download and install ...

Last year, Todd Blatt ran a Kickstarter campaign to make 3D-printed accessories for Google Glass, and has turned it into a company: GlassKap.
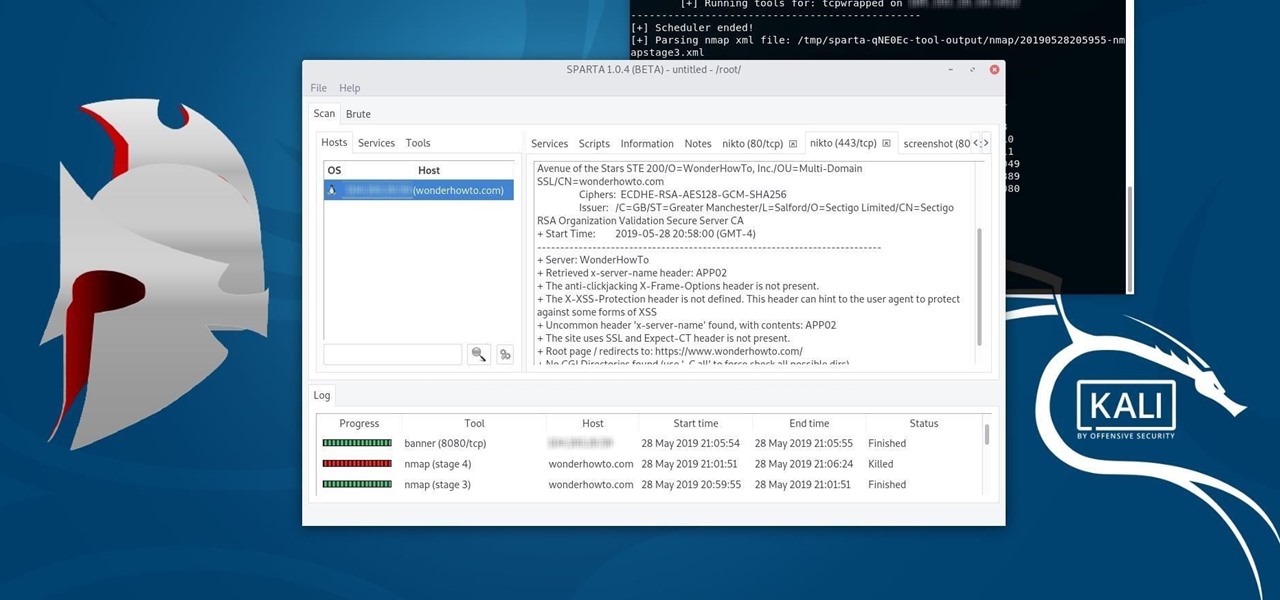
Automating port scanners, directory crawlers, and reconnaissance tools can be complicated for beginners just getting started with Kali Linux. Sparta solves this problem with an easy-to-use graphical interface designed to simplify a penetration tester's tasks.
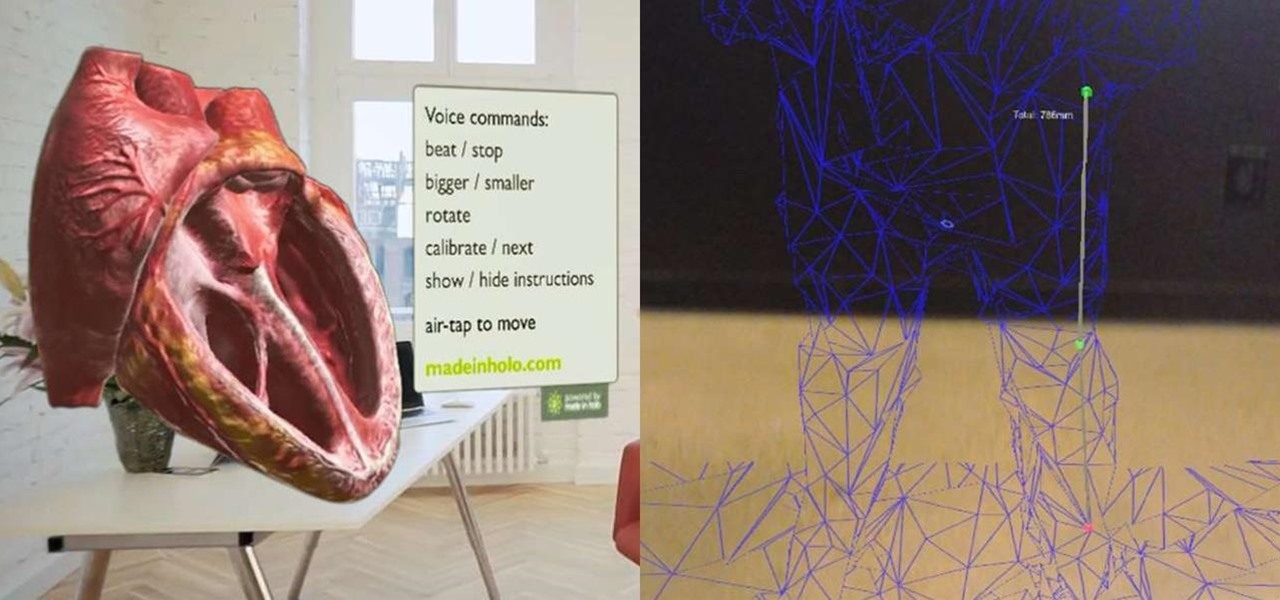
While all of my previous Have You Seen This? posts have all focused on individual HoloLens apps in the Windows Store, this time I'll be sharing a couple at once. These holographic applications are really simple in scope, so there is not a lot to say about them, yet they are interesting enough for me to want to share them with you.
In any project management career, there is no such thing as a person who knows everything for each project. Many times, those who got too much confident with their jobs fail because they were not able to make things clear before and during the project implementation.

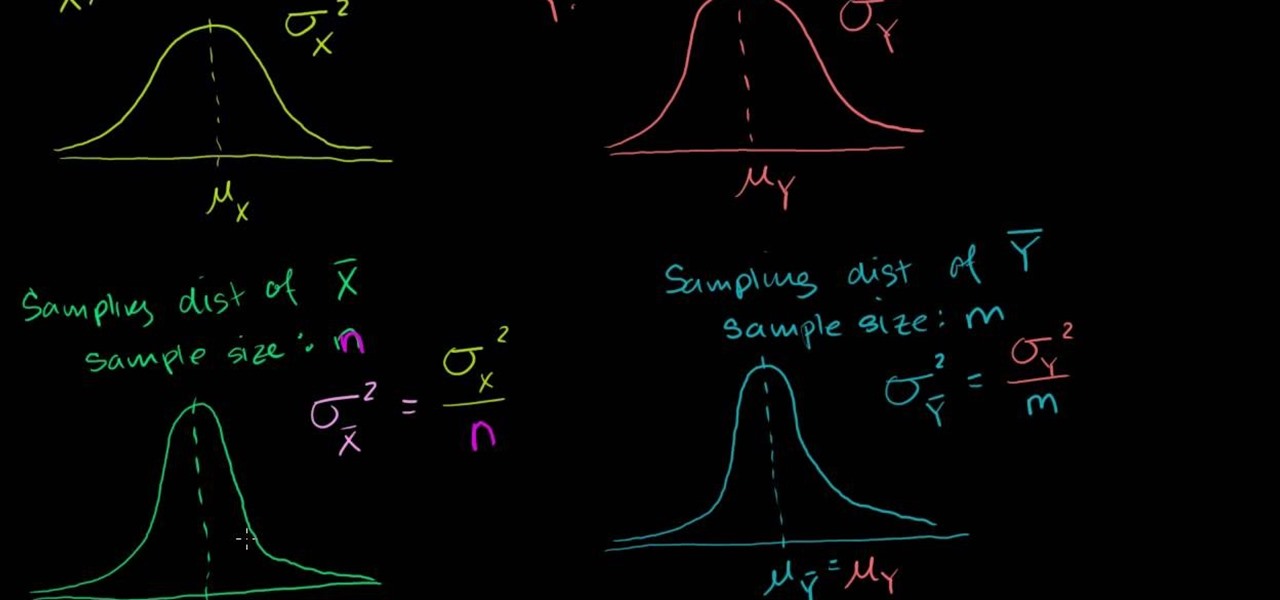
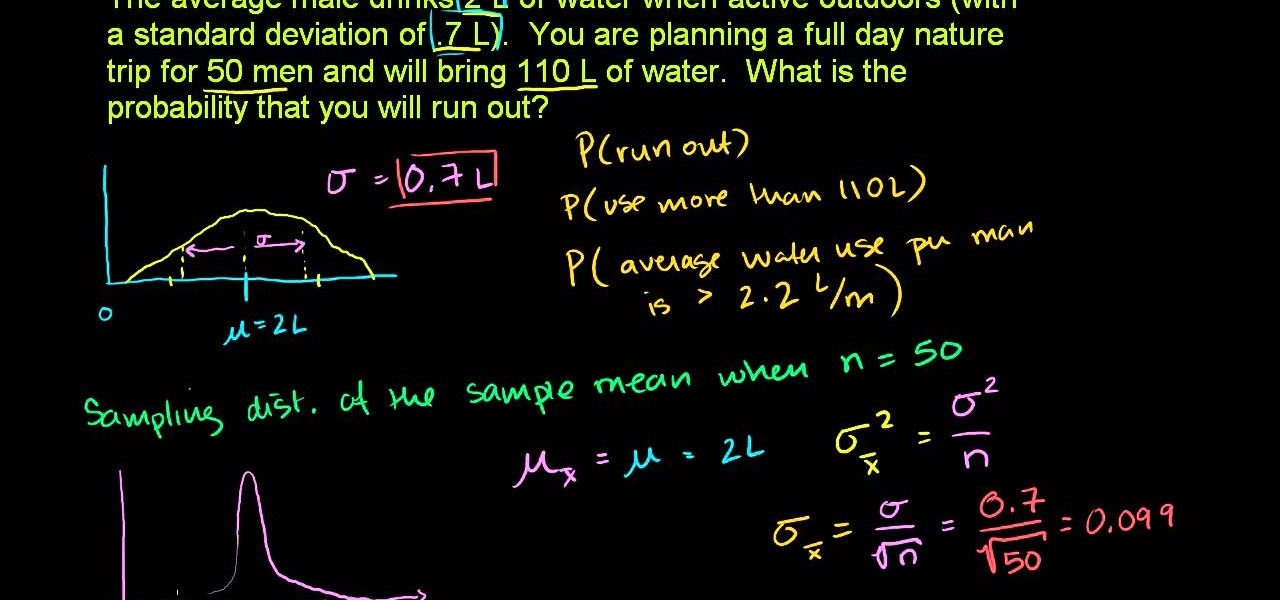
In this video the tutor explains about the standard error of the mean. He starts explaining by drawing the diagram of a distribution and now he takes ten samples from the distribution and starts plotting them. He says that in theory if we do it infinite times then we can obtain the sampling distribution of the sampling mean. For the example he takes the number of samples as 10. Now depending on these values of n we can get different sampling distributions. Now he intends to find the mean of t...
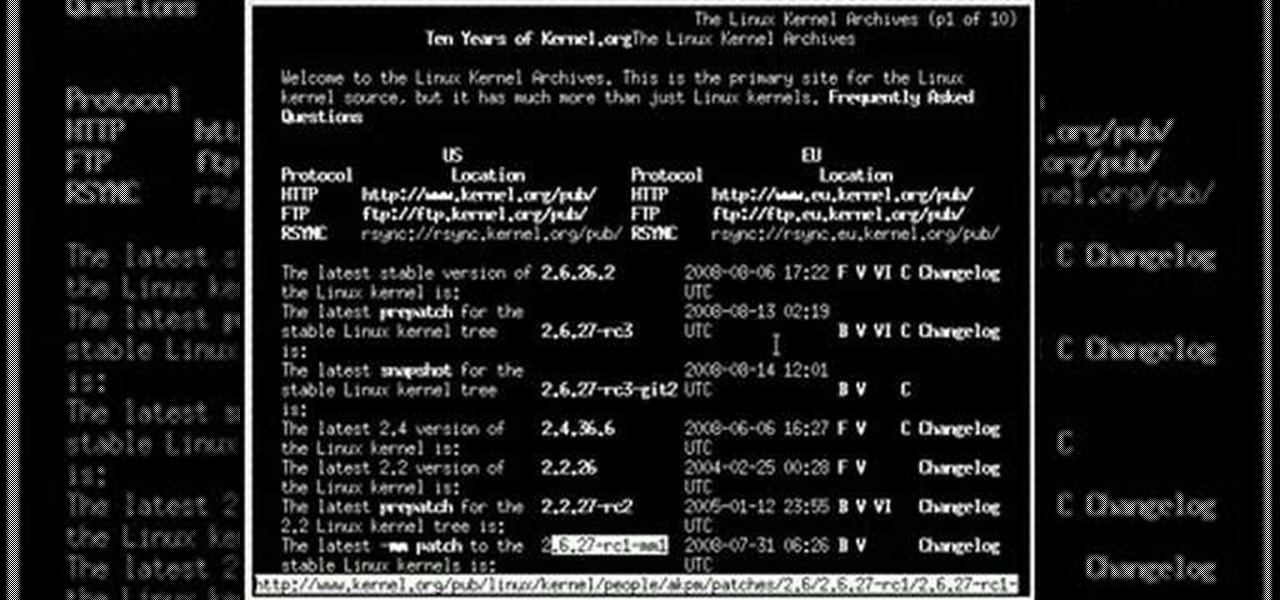
In this four-part video tutorial series, you'll learn how to compile a Linux kernel on a Debian-based system (e.g., Ubuntu). You'll learn two separate methods for kernel compilation, both (1) how to make the kernel into a Debian package, which can be handy if you're using a package manager and (2) how to install the kernel manually with make and make install. Take a look!
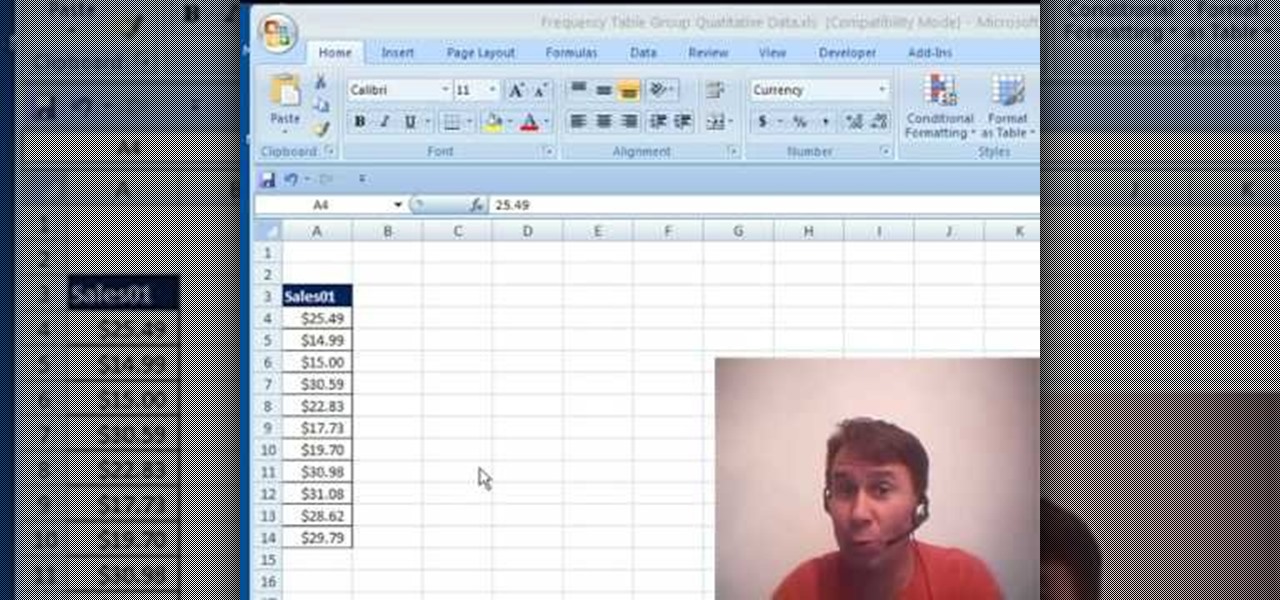
If you use Microsoft Excel on a regular basis, odds are you work with numbers. Put those numbers to work. Statistical analysis allows you to find patterns, trends and probabilities within your data. In this MS Excel tutorial from everyone's favorite Excel guru, YouTube's ExcelsFun, the 15th installment in his "Excel Statistics" series of free video lessons, you'll learn how to use create a frequency distribution, relative frequency distribution, percent frequency distribution and pie chart wi...
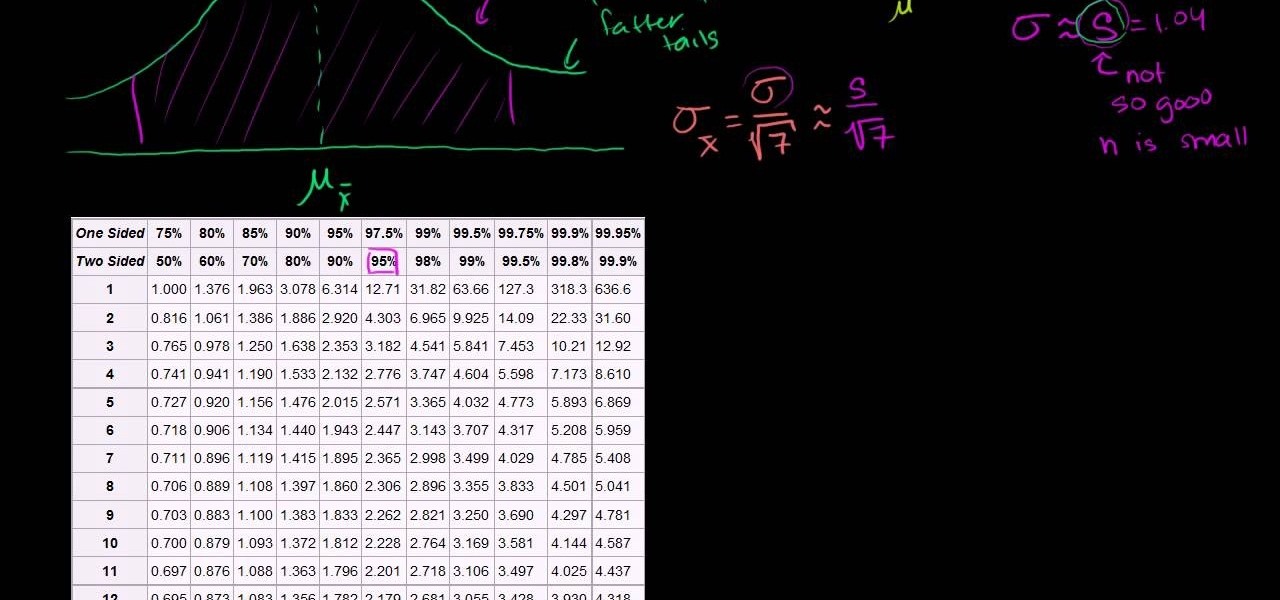
Learn how to build small sample size confidence intervals using t-distributions. From Ramanujan to calculus co-creator Gottfried Leibniz, many of the world's best and brightest mathematical minds have belonged to autodidacts. And, thanks to the Internet, it's easier than ever to follow in their footsteps. With this installment from Internet pedagogical superstar Salman Khan's series of free math tutorials, you'll learn how to construct a small size sample confidence interval using t distribut...
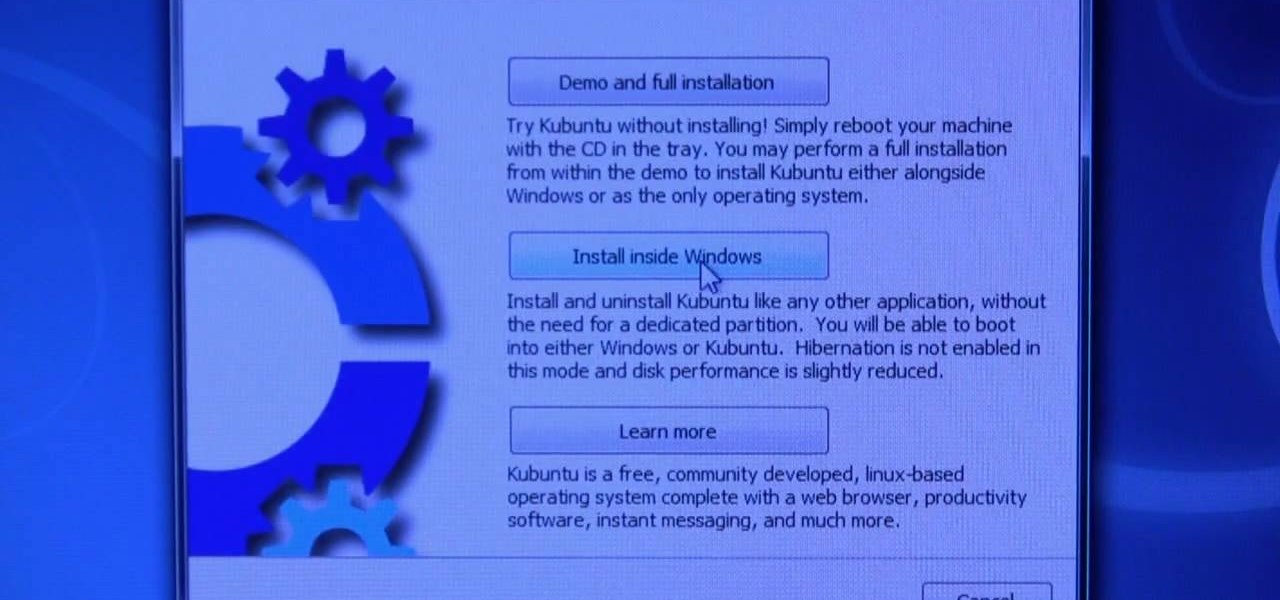
This video describes basics about using Wubi installer for Ubuntu in Windows operating system.Wubi installer is usually used for Ubuntu family distribution installations.You can download Wubi installer from the Internet and then it will install all desired distribution automatically or you can run installer from CD or DVD.In this example Wubi is installed from Kubuntu live DVD.After inserting DVD into your computer's disk drive autoplay function offers to run Kubuntu installer. If you don't h...
With the Group Text app, you can easily set up a distribution list so you can send out text messages to large numbers of people at once. You can also set up form templates, which are useful if you tend to send out a similar text message each time. This short tutorial shows you how to set up the distribution list, and how to get the most out of your Group Text. You can even set up multiple distribution lists for different topics or texts!
FreshDV had the opportunity recently to speak with Jerome Courshon on the marketing and distribution of movies and films. Jerome offers a full course in the “Secrets of Distribution” . If you are a filmmaker of any kind you owe it to your crew, your cast and yourself to watch this segment. From contracts, residuals, and pitfalls to avoid Jerome covers the 101 basics of film distribution and helps prepare you for what you need to know once the ink dries on the DVDs. In Jerome’s words:
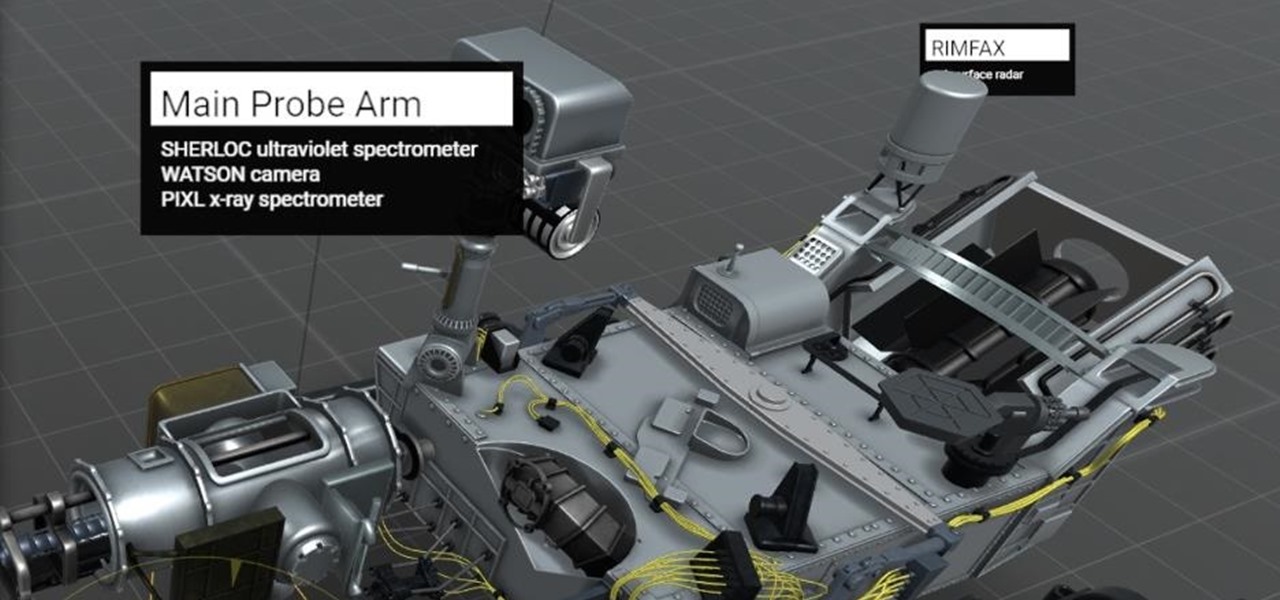
San Francisco-based augmented reality company Scope AR has made building AR instructional content for mobile devices and AR wearables as easy as throwing together a PowerPoint deck, primarily via its WorkLink platform.
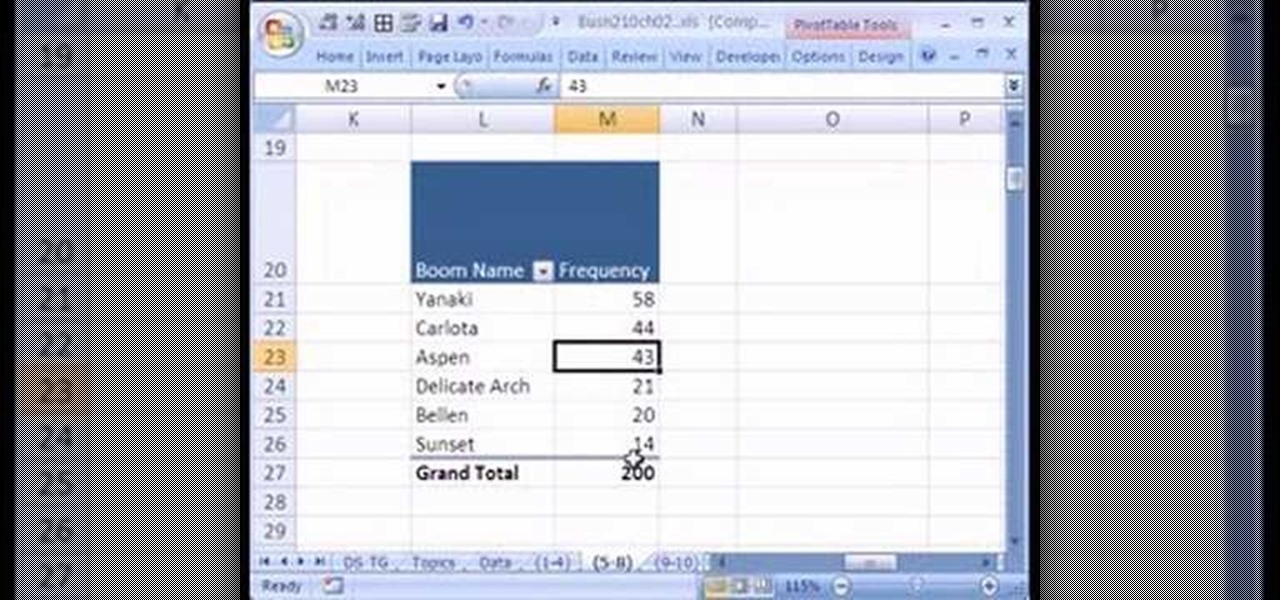
If you use Microsoft Excel on a regular basis, odds are you work with numbers. Put those numbers to work. Statistical analysis allows you to find patterns, trends and probabilities within your data. In this MS Excel tutorial from everyone's favorite Excel guru, YouTube's ExcelsFun, the 26th installment in his "Excel Statistics" series of free video lessons, you'll learn how to create quantitative data cumulative frequency distributions with pivot tables.
If you use Microsoft Excel on a regular basis, odds are you work with numbers. Put those numbers to work. Statistical analysis allows you to find patterns, trends and probabilities within your data. In this MS Excel tutorial from everyone's favorite Excel guru, YouTube's ExcelsFun, the 19th installment in his "Excel Statistics" series of free video lessons, you'll learn how to group categories in a frequency distribution with a formula (2 COUNTIF) and the pivot table (PivotTable) grouping fea...
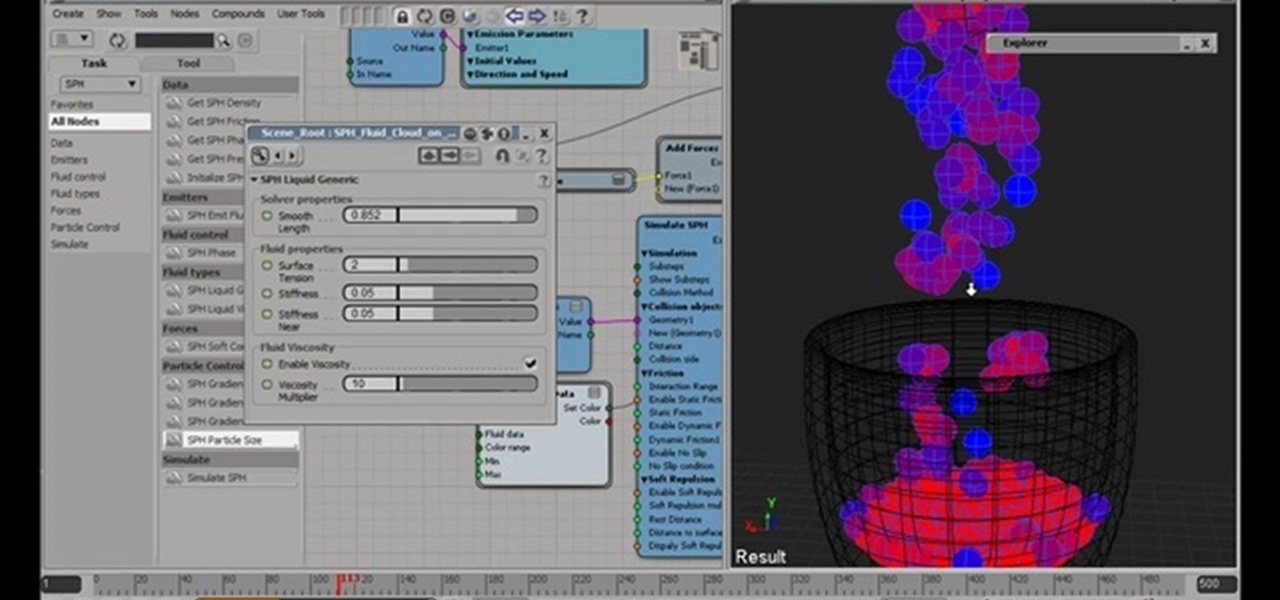
This is a tutorial on the SPH fluids nodes. This is a particle-based distributed fluid simulator application designed for Hewlett-Packard Scalabe Visualization Array. This application uses volume domain distribution among the nodes.
If you use Microsoft Excel on a regular basis, odds are you work with numbers. Put those numbers to work. Statistical analysis allows you to find patterns, trends and probabilities within your data. In this MS Excel tutorial from everyone's favorite Excel guru, YouTube's ExcelsFun, the 44th installment in his "Excel Statistics" series of free video lessons, you'll learn how to use the SKEW function to calculate the skew in a distribution of data.
If you use Microsoft Excel on a regular basis, odds are you work with numbers. Put those numbers to work. Statistical analysis allows you to find patterns, trends and probabilities within your data. In this MS Excel tutorial from everyone's favorite Excel guru, YouTube's ExcelsFun, the 21st installment in his "Excel Statistics" series of free video lessons, you'll learn how to build labels and counting formulas for a frequency distribution.
If you use Microsoft Excel on a regular basis, odds are you work with numbers. Put those numbers to work. Statistical analysis allows you to find patterns, trends and probabilities within your data. In this MS Excel tutorial from everyone's favorite Excel guru, YouTube's ExcelsFun, the 13th installment in his "Excel Statistics" series of free video lessons, you'll learn how to create a column chart from a frequency distribution for categorical data.
See how to install part number 7903 the Draw-Tite weight distribution assembly for our 1200 pounds tongue weight and 12000 pounds trailer weight. This video uses a Dodge Ram Pickup but it can be used on any truck.
Starting with Android 9 and 10, Google made privacy and security the main priorities for Android updates. Both versions brought numerous changes to help erase the notion that Android isn't safe, but Android 11 might even have them beat.
If your iPhone is a business tool for you, you'll want ways to send out mass e-mails, either to your customers or employees and coworkers. You can use the iEDL, or Email Distribution App, published by MerckTech, to set up a distribution list that will let you send out mass emails as often as you need. This video shows you all the ins and outs of this awesome little app. Expand your productivity and marketing reach for your business and personal projects!
From Ramanujan to calculus co-creator Gottfried Leibniz, many of the world's best and brightest mathematical minds have belonged to autodidacts. And, thanks to the Internet, it's easier than ever to follow in their footsteps. With this installment from Internet pedagogical superstar Salman Khan's series of free math tutorials, you'll learn how to find the sampling distribution for the difference between means.
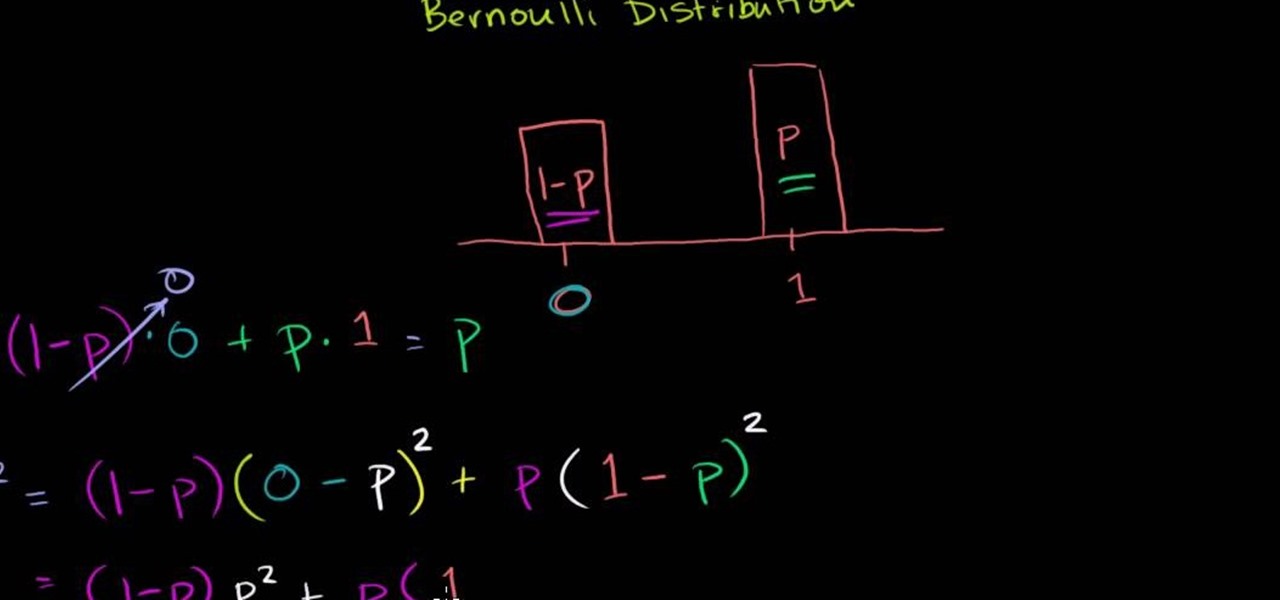
From Ramanujan to calculus co-creator Gottfried Leibniz, many of the world's best and brightest mathematical minds have belonged to autodidacts. And, thanks to the Internet, it's easier than ever to follow in their footsteps (or just study for that next big test). With this installment from Internet pedagogical superstar Salman Khan's series of free math tutorials, you'll learn how to calculate mean and variance for a Bernouilli distribution.
From Ramanujan to calculus co-creator Gottfried Leibniz, many of the world's best and brightest mathematical minds have belonged to autodidacts. And, thanks to the Internet, it's easier than ever to follow in their footsteps (or just study for that next big test). With this installment from Internet pedagogical superstar Salman Khan's series of free math tutorials, you'll learn how to calculate sample distribution in statistics.
From Ramanujan to calculus co-creator Gottfried Leibniz, many of the world's best and brightest mathematical minds have belonged to autodidacts. And, thanks to the Internet, it's easier than ever to follow in their footsteps (or just study for that next big test). With this installment from Internet pedagogical superstar Salman Khan's series of free math tutorials, you'll learn how to calculate the mean and variance of a Bernouilli distribution.
In need of a general (and quick) introduction to the Ubuntu GNU/Linux distribution or just Linux more generally? Let this video be your guide. For more information, and to learn more about Ubuntu Linux, watch this home-computing how-to from the folks at Butterscotch.
New to Microsoft Excel? Looking for a tip? How about a tip so mind-blowingly useful as to qualify as a magic trick? You're in luck. In this MS Excel tutorial from ExcelIsFun and Mr. Excel, the 15th installment in their joint series of digital spreadsheet magic tricks, you'll learn how to use a pivot table with grouping and a count function to create a frequency distribution.
If you use Microsoft Excel on a regular basis, odds are you work with numbers. Put those numbers to work. Statistical analysis allows you to find patterns, trends and probabilities within your data. In this MS Excel tutorial from everyone's favorite Excel guru, YouTube's ExcelsFun, the 24th installment in his "Excel Statistics" series of free video lessons, you'll learn how to create quantitative data frequency distributions with pivot tables. See how to create the correct unambiguous labels ...
If you use Microsoft Excel on a regular basis, odds are you work with numbers. Put those numbers to work. Statistical analysis allows you to find patterns, trends and probabilities within your data. In this MS Excel tutorial from everyone's favorite Excel guru, YouTube's ExcelsFun, the 12th installment in his "Excel Statistics" series of free video lessons, you'll learn how to use Advanced Filter 'Unique Records Only" to extract a list of unique items from a data base, and then use the COUNTI...
A histogram is a summary graph showing a count of data points that fall in various ranges. Histograms are used in statistics and other forms of mathematics. In this video, learn how to create your own histogram using data analysis on the computer. This tutorial will show you how to create a frequency distribution, a cumulative frequency distribution, a histogram chart and an ogive chart with the data analysis add-in.
See Licker Beta and the U-8 Boss on this level of RE. See the playthrough for Resident Evil 5: Chapter 5-1, Underground Garden in this three-part video. The ruins appear to be adjacent to a large facility. Perhaps the answers Chris and Sheva seek can be found inside?
A little planning is all it takes to decorate your dorm with style! You Will Need
Compulsive gambling is a recognized addiction, just like alcoholism or chemical dependency. Follow these steps to see if you might fit the profile. Recognize the signs of compulsive gambling with this guide from Howcast.
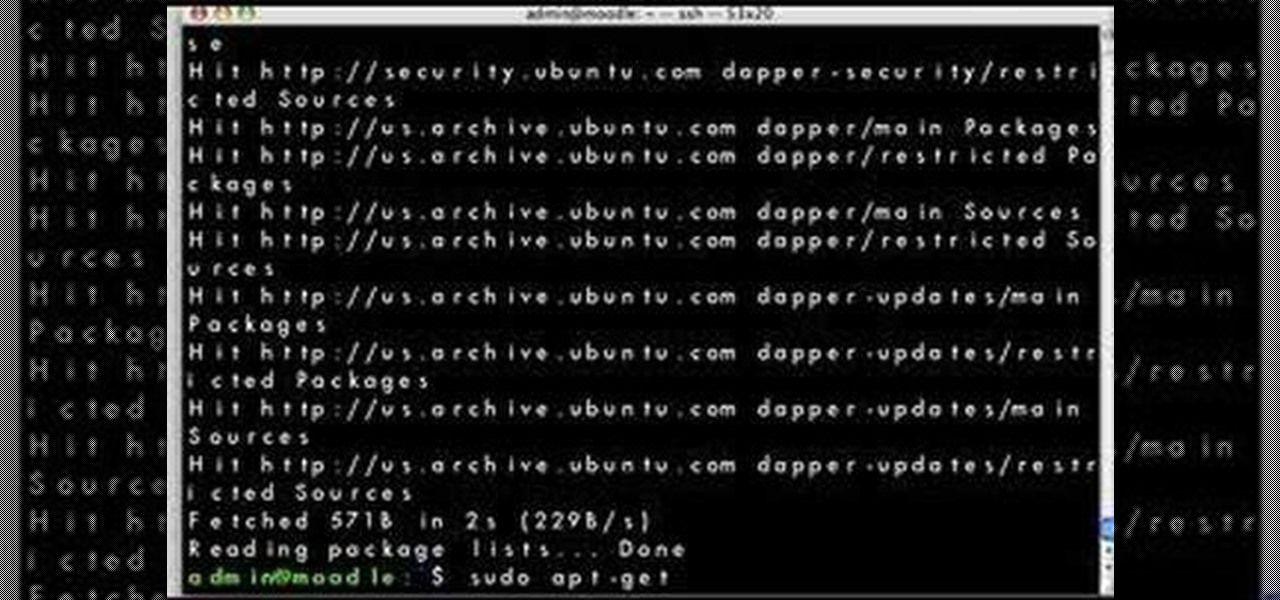
Looking for a simple way to update your Linux distribution? This video tutorial demonstrates how to upgrade your Linux distribution via the apt-get command in the terminal. To get started using the apt-get update tool, press play!
Every Friday, Next Reality reviews the latest headlines from the financial side of augmented and mixed reality. This Market Reality column covers funding announcements, mergers and acquisitions, market analysis, and the like. This week's column is led by two companies cashing in on visual inputs.
(Series designed to help explore whether your ideal employment ideas should be formalized into a business venture or as an employee or volunteer value added problem solver).
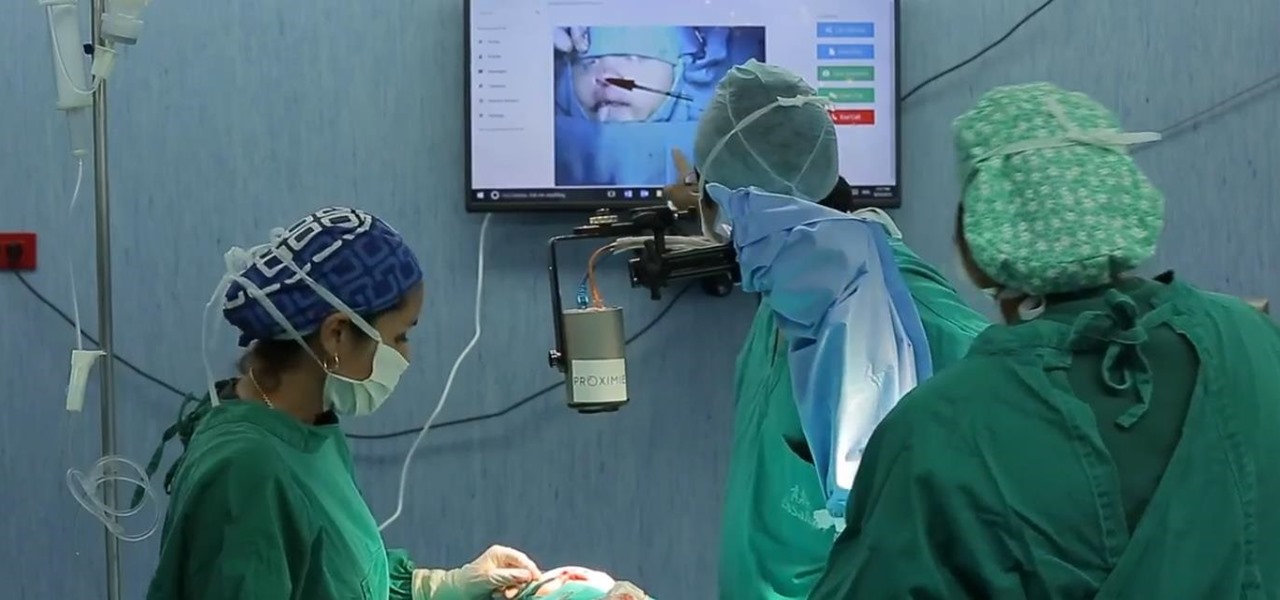
A recent TED Talk makes a strong case for the healthcare industry to adopt augmented reality as a means to expanding access to surgical care across the globe.