Matt covers some lines with a black ...Bg4. He found the first game with analysis on the Kenilworth Chess Club site. Most of the analysis he gave for this game is taken verbatim, but he does mention a couple side variations that you should be curious about. So watch!
How Do You Do A Business Plan? Part 1 of 5 (Series designed to discuss the parts of a business plan, what information is involved in each part, and why a business plan is needed.)
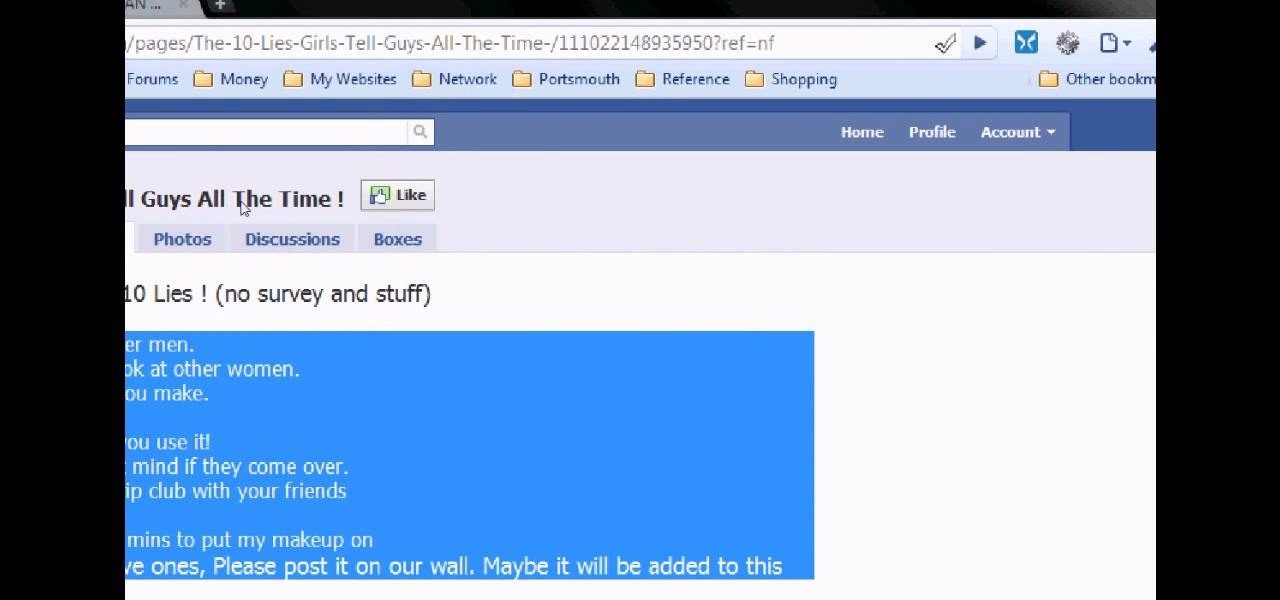
Tired of clicking on interesting looking links in Facebook, only to discover that they are hidden behind a page you have to 'Like' before you can see? If you're surfing using Google Chrome, you can completely bypass this privacy setting. When you get to the page, go to the menu bar and click on 'Inspect Element.' Then you'll see the code for the page, and you'll be able to get around the block to see the page you want.

If you use Microsoft Excel on a regular basis, odds are you work with numbers. Put those numbers to work. Statistical analysis allows you to find patterns, trends and probabilities within your data. In this MS Excel tutorial from everyone's favorite Excel guru, YouTube's ExcelsFun, the very first installment in his "Excel Statistics" series of free video lessons, you'll learn how to get started doing statistical analysis in Microsoft Excel 2007.

This how-to video is about how to enable the commenting tools in the free Adobe Reader using Acrobat 9 Pro and Acrobat 9 Pro Extended.

"Buy low and sell high" is great advice, but how do you accomplish it? While the stock market can be unpredictable, it's not a complete enigma. There are patterns to watch for that can make you a successful trader.

The Department of Biological Sciences at the University of Alberta brings you this flash animated video tutorial specifically relevant to your student laboratory courses, specifically microbiology. If you're a student at any school of biology, this information will be helpful for learning how to perform a microbiological analysis of food.
In this video the instructor talks about compound and continuous interest formula calculations. You need to understand the concepts of simple and compound interest. Only then you can understand what the bank is doing to your money which are in your bank account. Simple interest is a method where when returning a borrowed sum to some one you pay additional price for using the money all this time. Compound interest is a similar concept where you pay interest on the original sum borrowed, and al...
Data makes the world go round. It has gotten to the point that it's considered the most valuable resource, perhaps even more important than oil. Businesses use data to collect critical information about their users and improve their services; governments utilize it to improve things like public transportation; doctors analyze data to find more ways to save lives.
Unlock the "Closer Analysis: Hidden Intel" trophy in Call of Duty: Black Ops! This achievement is won by finding the hidden intelligence documents in Missions 11, 12 & 13.
Unlock the third "Closer Analysis: Hidden Intel" trophy in Call of Duty: Black Ops! This achievement is won by finding the hidden intelligence documents in Missions 14 & 15.
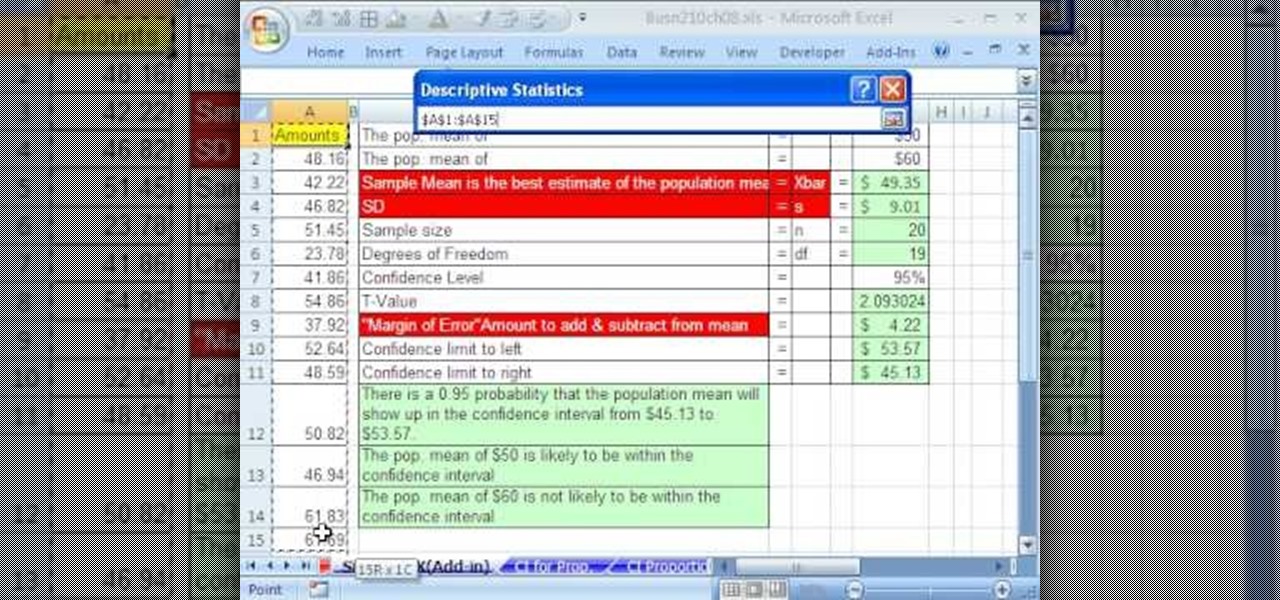
If you use Microsoft Excel on a regular basis, odds are you work with numbers. Put those numbers to work. Statistical analysis allows you to find patterns, trends and probabilities within your data. In this MS Excel tutorial from everyone's favorite Excel guru, YouTube's ExcelsFun, the 84th installment in his "Excel Statistics" series of free video lessons, you'll learn how to construct confidence intervals when the sigma is NOT known using the Descriptive Statistics data analysis add-in.
If you use Microsoft Excel on a regular basis, odds are you work with numbers. Put those numbers to work. Statistical analysis allows you to find patterns, trends and probabilities within your data. In this MS Excel tutorial from everyone's favorite Excel guru, YouTube's ExcelsFun, the 38th installment in his "Excel Statistics" series of free video lessons, you'll learn how to use the RANK and PERCENTRANK functions as well as the Data Analysis add-in's Rank & Percentile tools.
"I was wondering if you could take the triad Harmonic Analysis lesson you had done a step further and cover the concept of Transposing chord progressions into other keys?" Before you begin you do have to know some background information about your key signatures, knowing major, minor and diminished steps in triad analysis, and seventh chord harmony. The idea of transposing is that your take a set of notes and change they key it is originally played in. Andrew will walk you through all the ste...
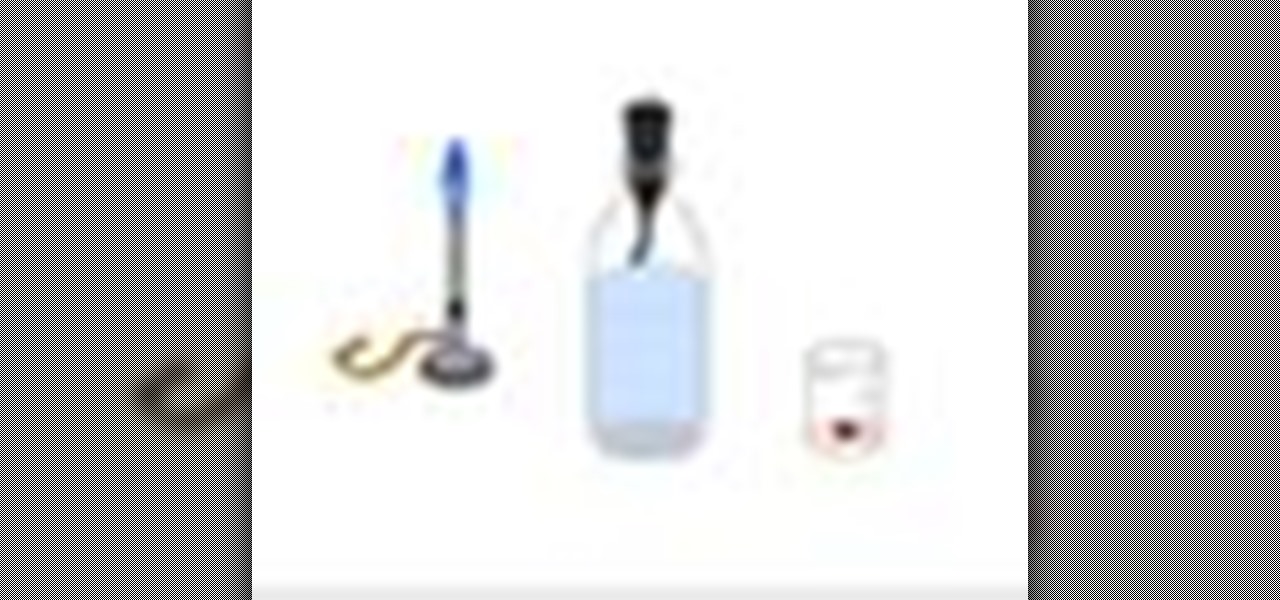
This video is based on a chemistry experiment. This video is going to explain to us how to use gravimetric analysis in order to analyze sulfuric acid. This experiment should not be done for those who do not have a fundamental knowledge of chemical compounds, reactions and chemical safety. He explains first what he is about to do before he does it. Sulfuric acid is acidic and can be toxic if ingested or in contact with the eyes. Take extreme care with this experiment.
Dimensional analysis is the process of analyzing units to decide which conversion factors to use. You can use this in real life if you want to figure your gas mileage. Here is a link to a website to help you Dimensional Analysis definitions | Quizlet.
This chess tutorial from Grandmaster Alexandra Kosteniuk is a perfect example of Retrograde Analysis.
In this Tutorial I will show you how you can use the frequency of letters to decrypt the famous Caesar cipher. I hope it is easy to understand and helpful for getting in touch with basic cryptanalysis. If you find any mistakes or have questions feel free to ask me. Finally I ask you to give me feedback which I will take into account for the next part.
Finger limes are one of those foods that bring out the little kid in even the most staid grown-up. I dare you not to squeal when you cut one open, squeeze, and see all that bubbly goodness emerge.
If you use Microsoft Excel on a regular basis, odds are you work with numbers. Put those numbers to work. Statistical analysis allows you to find patterns, trends and probabilities within your data. In this MS Excel tutorial from everyone's favorite Excel guru, YouTube's ExcelsFun, the 45th installment in his "Excel Statistics" series of free video lessons, you'll learn how to see how to calculate a z-score.
If you use Microsoft Excel on a regular basis, odds are you work with numbers. Put those numbers to work. Statistical analysis allows you to find patterns, trends and probabilities within your data. In this MS Excel tutorial from everyone's favorite Excel guru, YouTube's ExcelsFun, the 35.2nd installment in his "Excel Statistics" series of free video lessons, you'll learn how to use Excel's GEOMEAN function to find geometric mean.
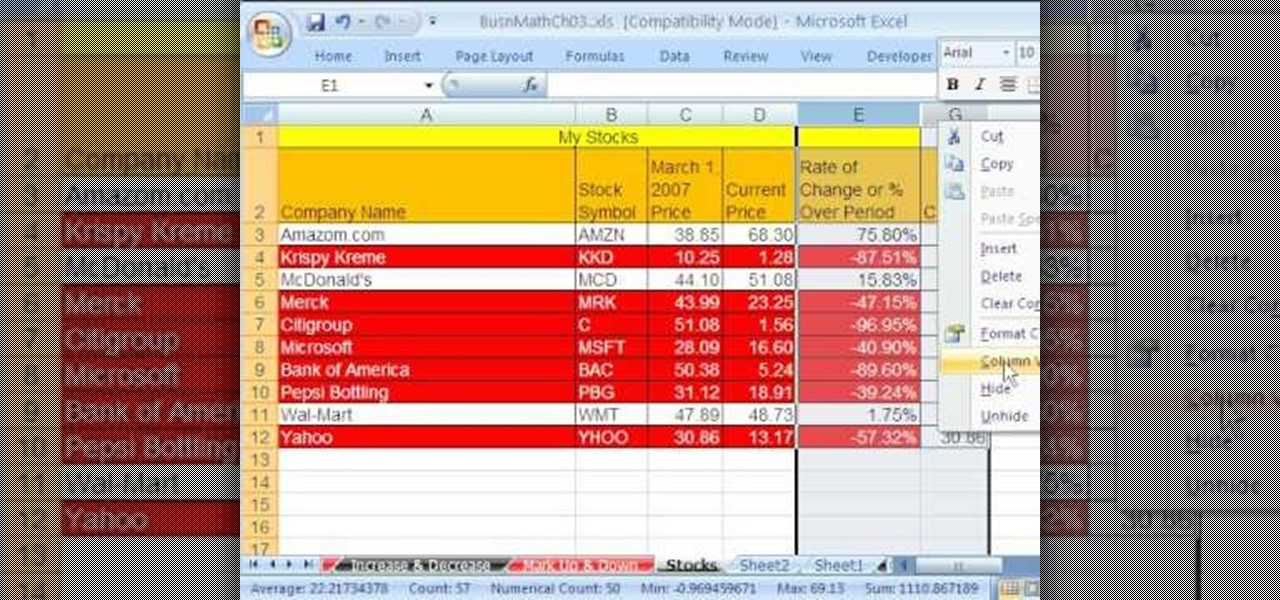
As you might guess, one of the domains in which Microsoft Excel really excels is business math. Brush up on the stuff for your next or current job with this how-to. In this tutorial from everyone's favorite digital spreadsheet guru, YouTube's ExcelIsFun, the 33rd installment in his "Excel Business Math" series of free video lessons, you'll learn how to add current stock prices to a stock analysis table in Excel using a web query.
If you use Microsoft Excel on a regular basis, odds are you work with numbers. Put those numbers to work. Statistical analysis allows you to find patterns, trends and probabilities within your data. In this MS Excel tutorial from everyone's favorite Excel guru, YouTube's ExcelsFun, the 40th installment in his "Excel Statistics" series of free video lessons, you'll learn how to calculate range & interquartile range for variability using the MAX, MIN, QUARTILE functions.
If you use Microsoft Excel on a regular basis, odds are you work with numbers. Put those numbers to work. Statistical analysis allows you to find patterns, trends and probabilities within your data. In this MS Excel tutorial from everyone's favorite Excel guru, YouTube's ExcelsFun, the 86th installment in his "Excel Statistics" series of free video lessons, you'll learn how to construct confidence intervals for proportions using NORMSINV function and other formulas.
If you use Microsoft Excel on a regular basis, odds are you work with numbers. Put those numbers to work. Statistical analysis allows you to find patterns, trends and probabilities within your data. In this MS Excel tutorial from everyone's favorite Excel guru, YouTube's ExcelsFun, the 87th installment in his "Excel Statistics" series of free video lessons, you'll learn how to calculate sample size (n) for confidence intervals.
If you use Microsoft Excel on a regular basis, odds are you work with numbers. Put those numbers to work. Statistical analysis allows you to find patterns, trends and probabilities within your data. In this MS Excel tutorial from everyone's favorite Excel guru, YouTube's ExcelsFun, the 27th installment in his "Excel Statistics" series of free video lessons, you'll learn how to create a quantitative data dot plot chart using the REPT and COUNTIF functions.
If you use Microsoft Excel on a regular basis, odds are you work with numbers. Put those numbers to work. Statistical analysis allows you to find patterns, trends and probabilities within your data. In this MS Excel tutorial from everyone's favorite Excel guru, YouTube's ExcelsFun, the 26th installment in his "Excel Statistics" series of free video lessons, you'll learn how to create quantitative data cumulative frequency distributions with pivot tables.
If you use Microsoft Excel on a regular basis, odds are you work with numbers. Put those numbers to work. Statistical analysis allows you to find patterns, trends and probabilities within your data. In this MS Excel tutorial from everyone's favorite Excel guru, YouTube's ExcelsFun, the 16th installment in his "Excel Statistics" series of free video lessons, you'll learn how to cross tabulate & do percentage cross tabulation for categorical data using a pivot table (PivotTable).
If you use Microsoft Excel on a regular basis, odds are you work with numbers. Put those numbers to work. Statistical analysis allows you to find patterns, trends and probabilities within your data. In this MS Excel tutorial from everyone's favorite Excel guru, YouTube's ExcelsFun, the 19th installment in his "Excel Statistics" series of free video lessons, you'll learn how to group categories in a frequency distribution with a formula (2 COUNTIF) and the pivot table (PivotTable) grouping fea...
If you use Microsoft Excel on a regular basis, odds are you work with numbers. Put those numbers to work. Statistical analysis allows you to find patterns, trends and probabilities within your data. In this MS Excel tutorial from everyone's favorite Excel guru, YouTube's ExcelsFun, the 17th installment in his "Excel Statistics" series of free video lessons, you'll learn how to cross tabulate & do percentage cross tabulation for categorical data using formulas rather than pivot tables.
If you use Microsoft Excel on a regular basis, odds are you work with numbers. Put those numbers to work. Statistical analysis allows you to find patterns, trends and probabilities within your data. In this MS Excel tutorial from everyone's favorite Excel guru, YouTube's ExcelsFun, the 35th installment in his "Excel Statistics" series of free video lessons, you'll learn how to calculate weighted and geometric means and see how to use the GEOMEAN function.
If you use Microsoft Excel on a regular basis, odds are you work with numbers. Put those numbers to work. Statistical analysis allows you to find patterns, trends and probabilities within your data. In this MS Excel tutorial from everyone's favorite Excel guru, YouTube's ExcelsFun, the 33rd installment in his "Excel Statistics" series of free video lessons, you'll learn how to use the AVEARGE, MEDIAN, MODE, PERCENTILE, QUARTILE and PERCENTILERANK functions to measure location.
If you use Microsoft Excel on a regular basis, odds are you work with numbers. Put those numbers to work. Statistical analysis allows you to find patterns, trends and probabilities within your data. In this MS Excel tutorial from everyone's favorite Excel guru, YouTube's ExcelsFun, the 4th installment in his "Excel Statistics" series of free video lessons, you'll learn how to create a frequency table and percentage frequency table using a Pivot Table (PivotTable).
Welcome to a tennis lesson from FuzzyYellowBalls, the the best place to learn how to play tennis online. Our free video tennis lessons teach you how to play the game in a new way that combines technical analysis, visual learning, and step-by-step progressions.
Welcome to a tennis lesson from FuzzyYellowBalls, the the best place to learn how to play tennis online. Our free video tennis lessons teach you how to play the game in a new way that combines technical analysis, visual learning, and step-by-step progressions.
This tutorial goes over how to perform ni-cho zai. This kata utilizes 2 zai (sais), and the video includes the bunkai, or step-by-step analysis.
If vaccines play absolutely no role in the development of childhood autism, a claim made by many medical authorities today, then why are some of the most popular vaccines commonly administered to children demonstrably causing autism in animal primates? This is the question many people are now asking after a recent study conducted by scientists at the University of Pittsburgh (UP) in Pennsylvania revealed that many of the infant monkeys given standard doses of childhood vaccines as part of the...
Where To?, the well-known points of interest finder for iPhone, has been updated to a new version including an Augmented Reality view.
If you use Microsoft Excel on a regular basis, odds are you work with numbers. Put those numbers to work. Statistical analysis allows you to find patterns, trends and probabilities within your data. In this MS Excel tutorial from everyone's favorite Excel guru, YouTube's ExcelsFun, the 44th installment in his "Excel Statistics" series of free video lessons, you'll learn how to use the SKEW function to calculate the skew in a distribution of data.
f you use Microsoft Excel on a regular basis, odds are you work with numbers. Put those numbers to work. Statistical analysis allows you to find patterns, trends and probabilities within your data. In this MS Excel tutorial from everyone's favorite Excel guru, YouTube's ExcelsFun, the 37th installment in his "Excel Statistics" series of free video lessons, you'll learn how to use the PERCENTILE and QUARTILE functions.