
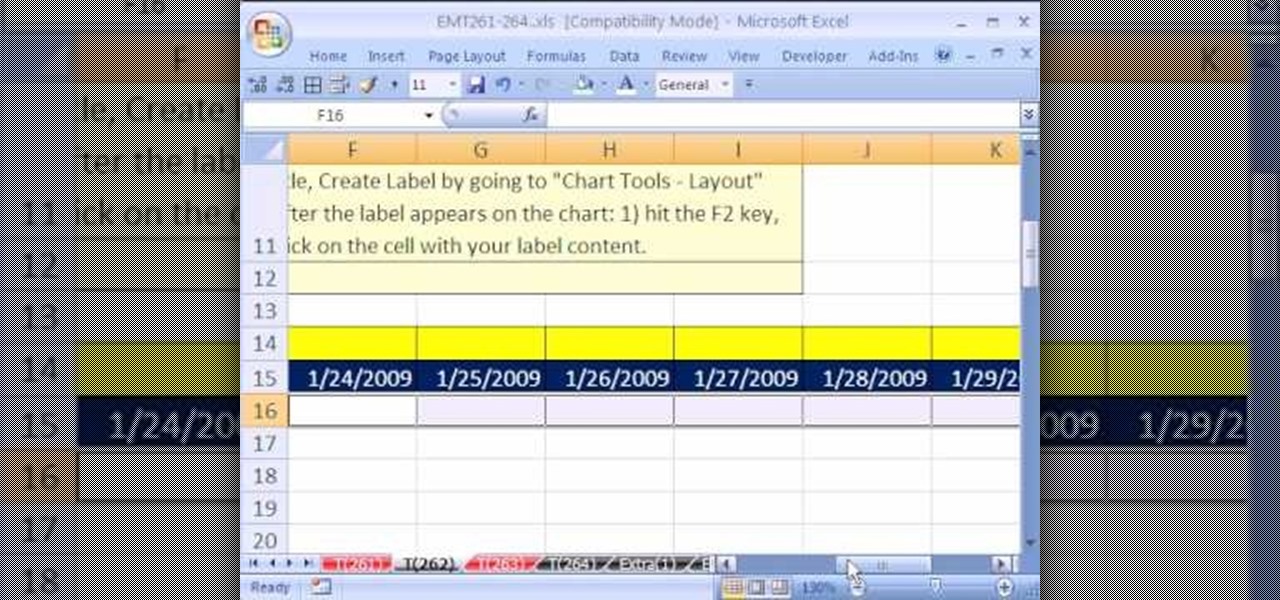
How To: Create a dynamic weekly chart in Microsoft Excel
New to Excel? Looking for a tip? How about a tip so mind-blowingly advanced as to qualify as a magic trick? You're in luck.

New to Excel? Looking for a tip? How about a tip so mind-blowingly advanced as to qualify as a magic trick? You're in luck.

In this video the instructor gives tips on how to erase a PC hard drive. An MIT study shows that 74 percent of the discarded hard drives contain private data on them that can be read and recovered by others. So you should learn how to completely erase all the data so that no one can recover or read from it later. Now formatting the drive or deleting a few files wont do it. For this you will need to have a proper software that meets or exceeds that US Department of Defense standards for data r...

MySQL is a database for serving data on the web. This video teaches viewers how to connect to a database and add data in PHP & MySQL. PHPMyAdmin is an interface that allows you to interact with MySQL more easily. Use the form in the program to create a database; choose the name for your database and select 'create'. Next you can create tables within your database, also using the forms provided. Within the tables you can set your variables; PHPMyAdmin has fields that allow you to choose the ty...

Your data is your most important asset on your computer. Learn how to keep your data safe using Carbonite.com

QR codes allow you to quickly and easily store and retrieve data within a single image. Much like barcodes at grocery stores, QR codes are images that can be scanned to discover data, such as an online website URL. Additionally, they can also be created by inputting text data into a QR code generator. Try scanning some of the QR codes in this video with an app on your phone or tablet to see how they work!
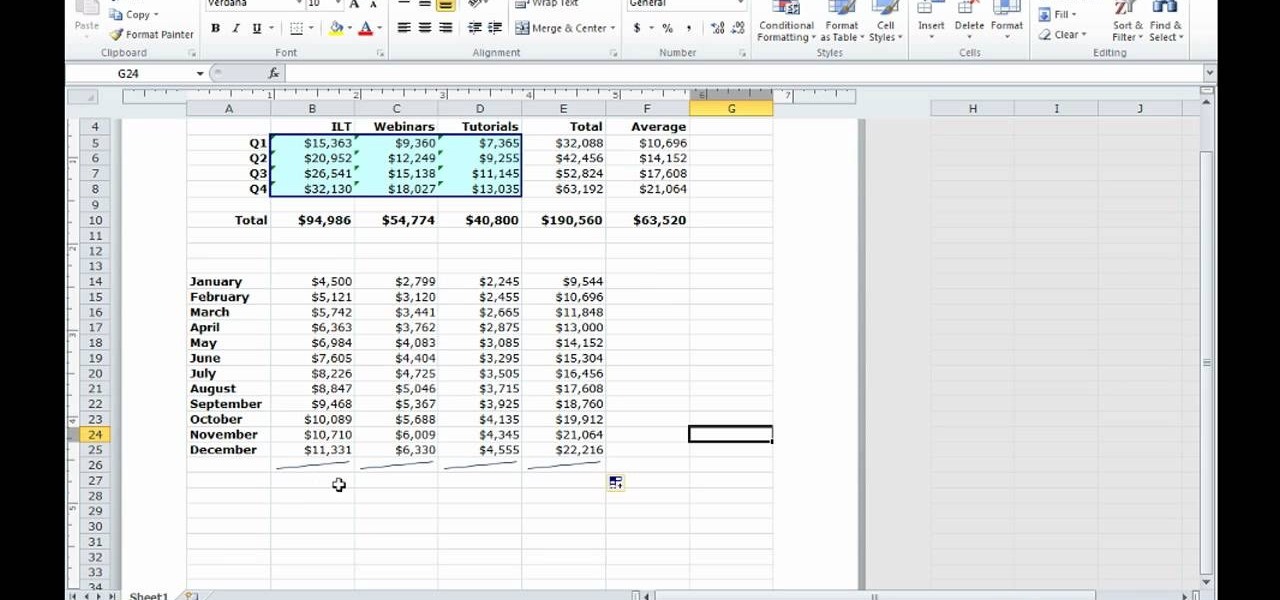
There is a new function in MS Excel 2010 called ‘Sparkline’ which helps you quickly find trends associated with a set of data. To create Sparkline, you can go to ‘Insert’ tab and then select ‘Sparkline’ section and then select the graph type. After you enter the data range and location range, the Sparkline will show up indicating the trend based on the data range you identified earlier. You can change the types and styles of your Sparkline easily. As the video demonstrates, whenever you use E...

Systm is the Do It Yourself show designed for the common geek who wants to quickly and easily learn how to dive into the latest and hottest tech projects. We will help you avoid pitfalls and get your project up and running fast.

Few things are more important than being well-versed in data analytics and interpretation when it comes to succeeding in today's increasingly data-driven world. As a data scientist, these skills are the key to a high-paying career. For hackers, there's no better way to defeat the enemy than to become the enemy.

Although the Health app mostly focuses on fitness, Apple has slowly added features to help with other aspects of well-being, including hearing. In iOS 13, there's now a headphones volume tracker in Health that monitors audio levels and lets you know when your music, podcast, movie, or whatever else is too loud.
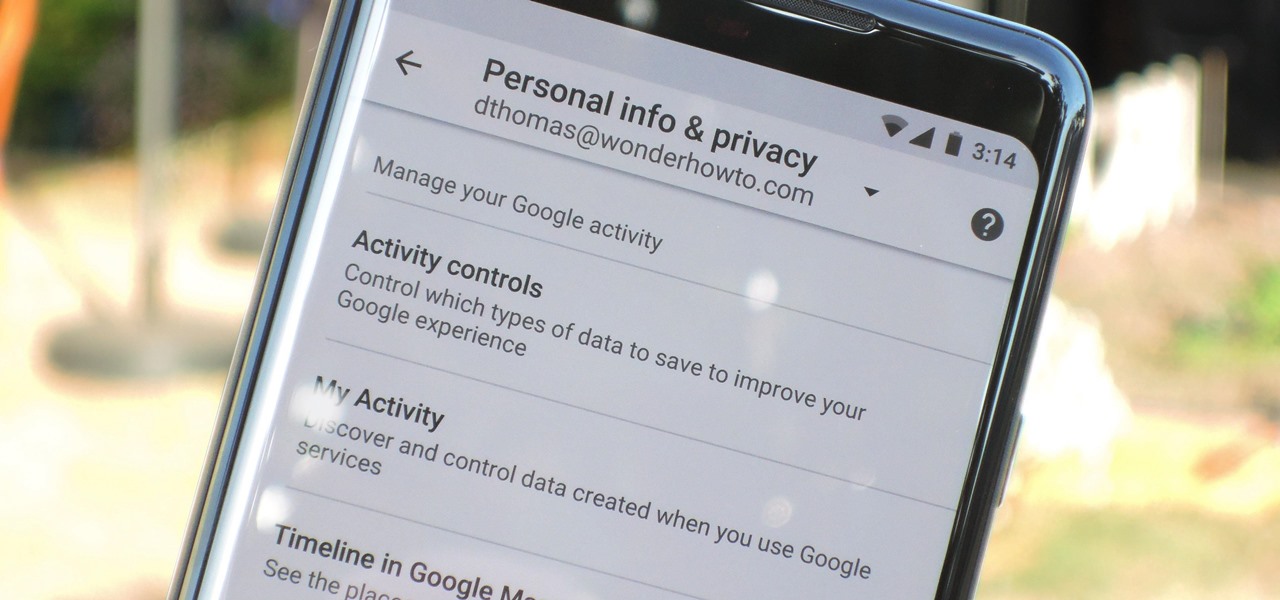
Threats to your privacy and security are everywhere, so protecting your data should be the highest priority for anyone with a smartphone. However, one threat many people overlook is the company who supplies the operating system your Android phone runs — Google.

As it turns out, your Android apps are pairing together to share your data without asking for your permission first. Researchers from Virginia Tech developed a tool called DIALDroid to monitor exchanges of data between Android apps over the last three years, and what they've found is quite alarming.
Hello everyone! This is my first attempt at a tutorial here. There are a couple great assembly tutorials here, and I wanted to toss my coin in the fountain.
Ever watched Netflix on your phone only to realize an hour later that you forgot to turn Wi-Fi on? That's a whole lot of data used.

Oops... did you forget to connect to a Wi-Fi network before streaming HBO GO on your iPhone? While those episodes of The Wire may have been absolutely life-changing, your three-digit cellular bill is definitely going to hit you a little harder.
Welcome back, my greenhorn hackers!

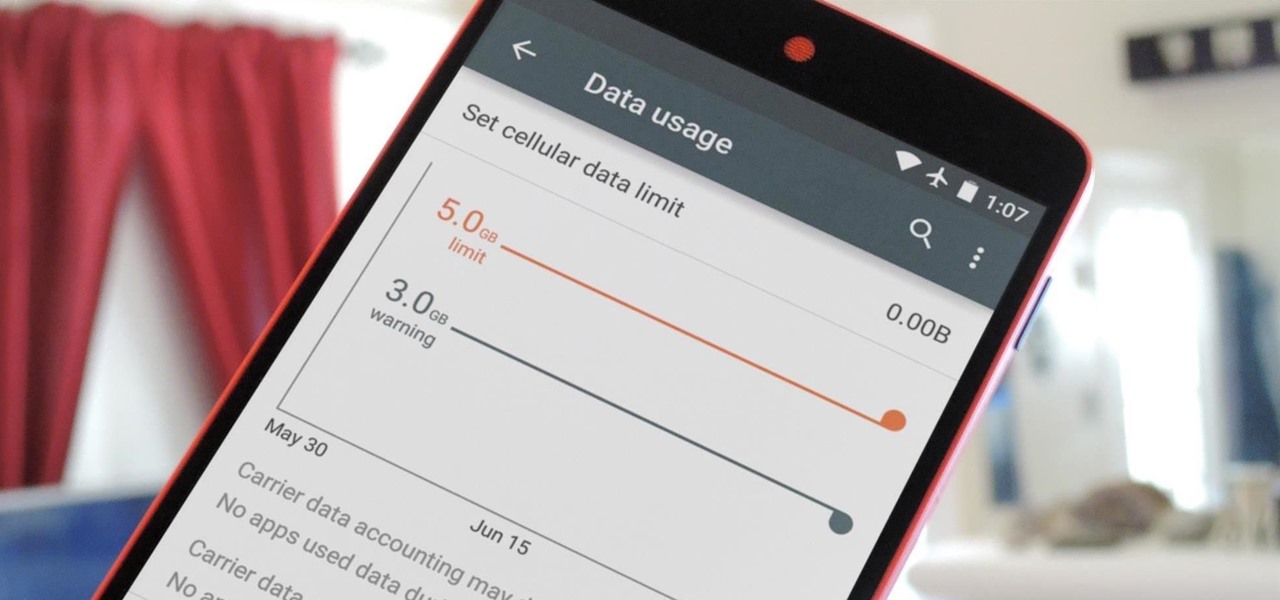
With the majority of smartphone carriers no longer offering unlimited data plans for the iPhone, monitoring how much mobile data you use is a key element to saving money on your phone bill.

The new Pyro FX in Houdini 10 are very impressive with improved workflow. The Pyro FX are great for creating 3D fire and smoke effects. And in this video tutorial series, you will learn the Pyro FX workflow in-depth and the parameters used to create fire and smoke effects. You will also see how volumetric data is created and recorded, and how to visualize it.
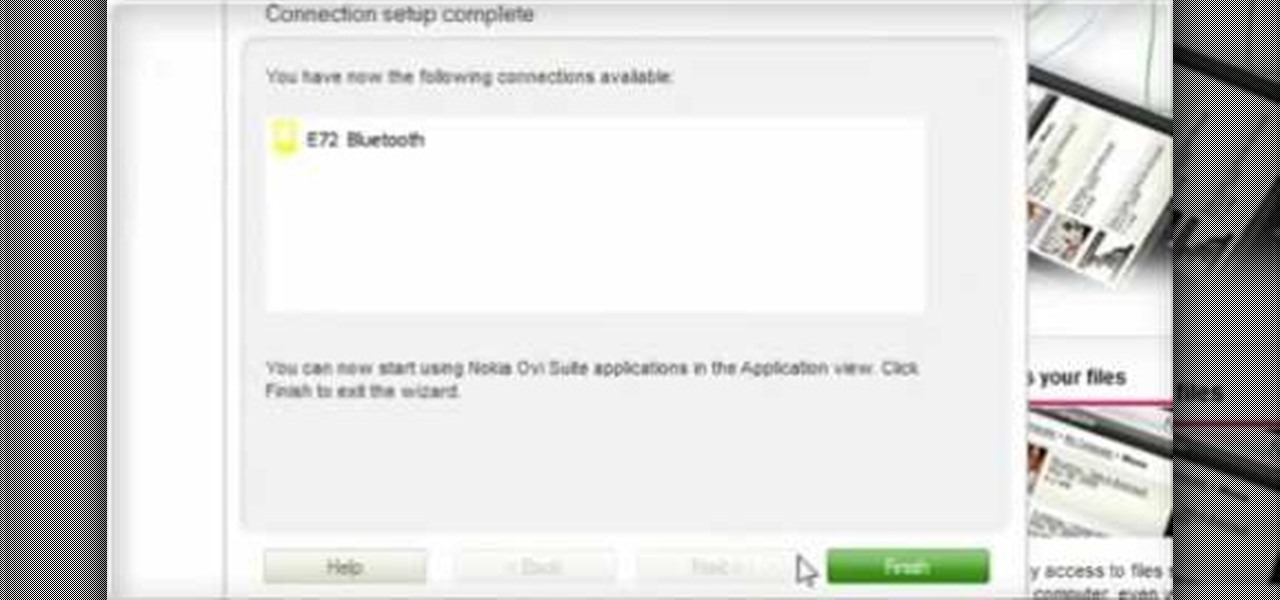
Calendar data, images, sounds, videos, and messages can be easily synchronized between your Nokia Booklet 3G netbook and supported mobile devices and phones when the two are connected using Bluetooth. To find out how to use Nokia's Ovi Suite software to synchronize your data, take a look at this tech support video from the company.

If you've had a hard drive go bad, you know the feeling of helplessness that comes from thinking you may have just lost all your data. This video will show you how to recover data from an Xbox 360 hard drive.
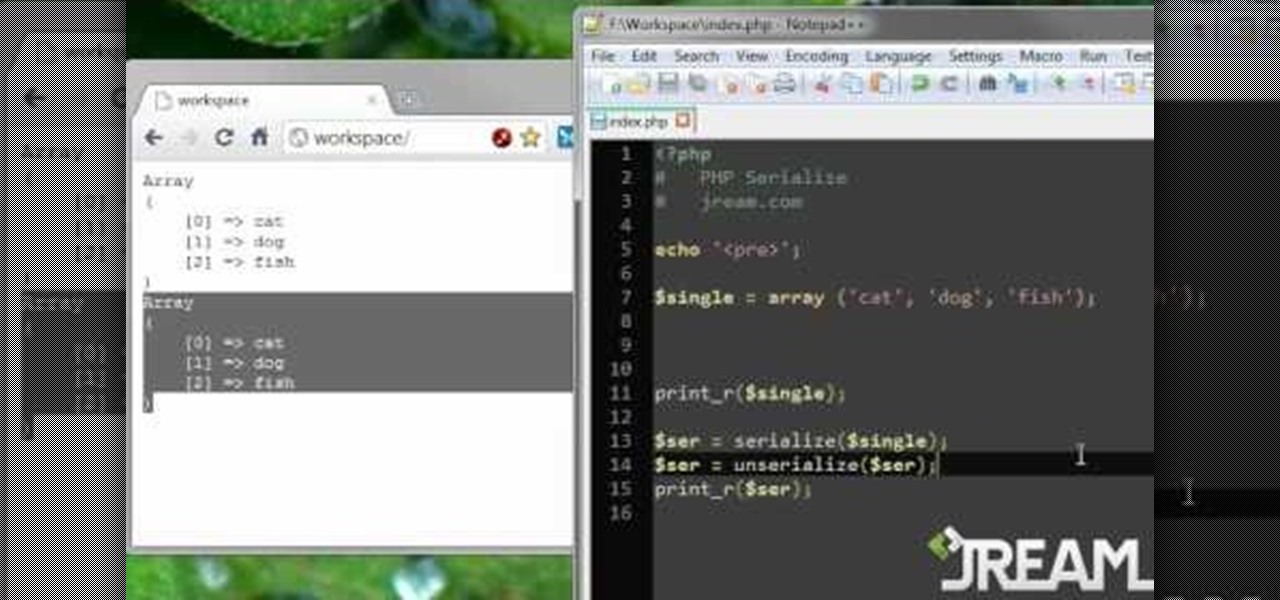
Learn to serialize your data and convert multidimensional arrays into a single string by following along with this informative video from JREAMdesign. Serializing your data essentially compacts it from an expanded array into a string series of values, a very handy PHP feature indeed.

Most of the most important information in the world is stored on computers, and if your part of it gets deleted in some way you're probably in trouble. There are lots of data recovery options out there, and this video will show you how to figure out what sort you need for your hard drive / data storage problem.
You can use your Apple product (iPod, iPhone or iPad) to store your data and then send it to a different computer using a wifi connection. You'll need to download the File Sharing program from the Apple store and make a note of the IP address you want to send your data to.
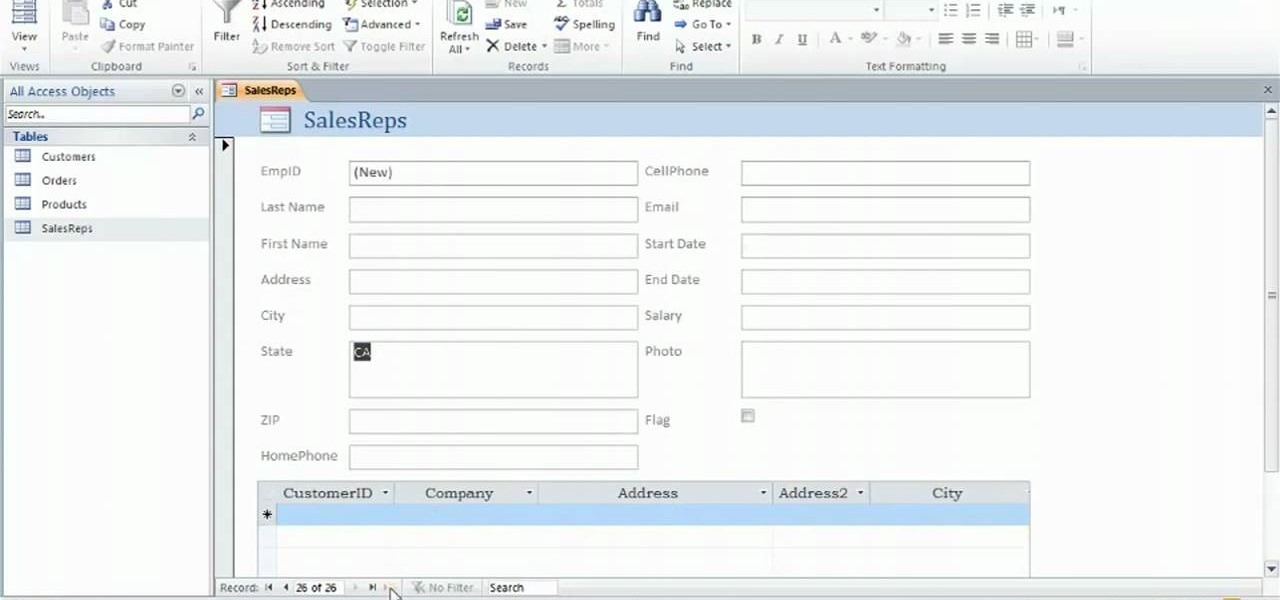
Learn how to create data-entry forms when working in Microsoft Access 2010. Whether you're new to Microsoft's popular database management application or a seasoned MS Office professional just looking to better acquaint yourself with the Access 2010 workflow, you're sure to be well served by this video tutorial. For more information, and to get started using data-entry forms in your own Access projects, watch this free video guide.

If you use Microsoft Excel on a regular basis, odds are you work with numbers. Put those numbers to work. Statistical analysis allows you to find patterns, trends and probabilities within your data. In this MS Excel tutorial from everyone's favorite Excel guru, YouTube's ExcelsFun, the 43rd installment in his "Excel Statistics" series of free video lessons, you'll learn how to use the Excel Data Analysis add-in descriptive statistics tool.

If you use Microsoft Excel on a regular basis, odds are you work with numbers. Put those numbers to work. Statistical analysis allows you to find patterns, trends and probabilities within your data. In this MS Excel tutorial from everyone's favorite Excel guru, YouTube's ExcelsFun, the 29th installment in his "Excel Statistics" series of free video lessons, you'll learn how to create quantitative data cross tabulation using a pivot table (PivotTable).

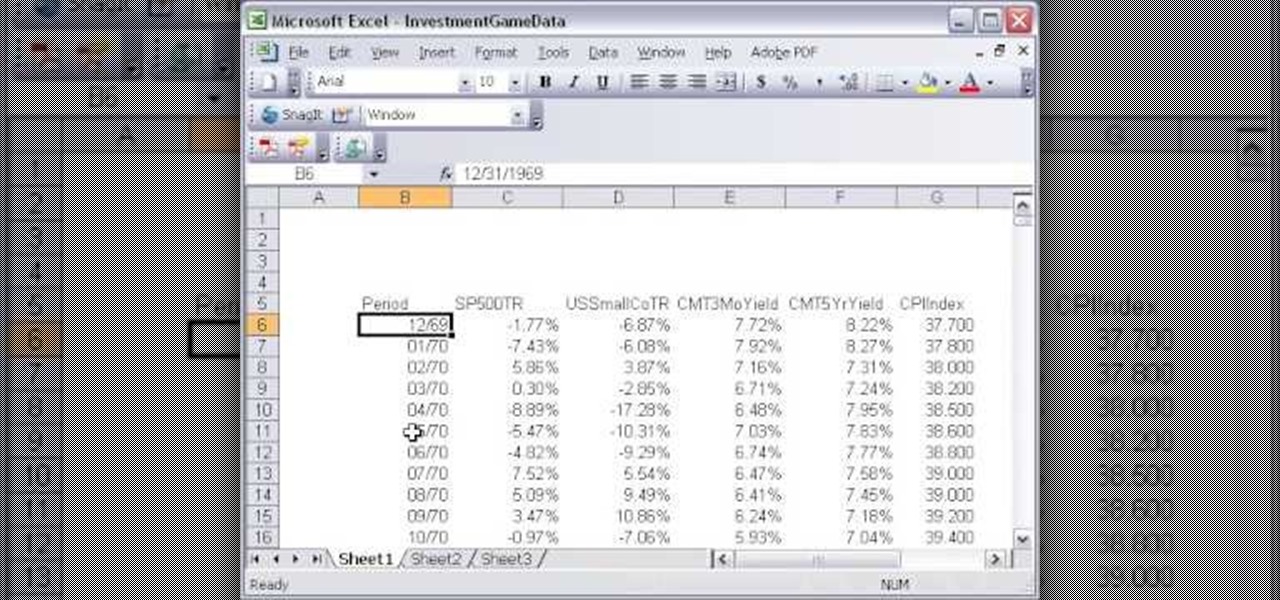
If you use Microsoft Excel on a regular basis, odds are you work with numbers. Put those numbers to work. Statistical analysis allows you to find patterns, trends and probabilities within your data. In this MS Excel tutorial from everyone's favorite Excel guru, YouTube's ExcelsFun, the 11th installment in his "Excel Statistics" series of free video lessons, you'll learn how to work with, and create charts for, cross-sectional and time-series data.

If you use Microsoft Excel on a regular basis, odds are you work with numbers. Put those numbers to work. Statistical analysis allows you to find patterns, trends and probabilities within your data. In this MS Excel tutorial from everyone's favorite Excel guru, YouTube's ExcelsFun, the 13th installment in his "Excel Statistics" series of free video lessons, you'll learn how to install the Excel 2007 Data Analysis add-in.

New to Microsoft Excel? Looking for a tip? How about a tip so mind-blowingly useful as to qualify as a magic trick? You're in luck. In this Excel tutorial from ExcelIsFun, the 574th installment in their series of digital spreadsheet magic tricks, you'll learn how to import data from Microsoft Access as well as how to use the VLOOKUP function to populate data into a printable form.

In this video Jesse Liberty dives deeper into data-binding, demonstrating in detail how to create business classes that represent data retrieved from a web service, and how to bind them to various controls using a combination of Blend and Visual Studio. This is a detailed, easy to follow video, to help you use the program, and all it entails.

A major plus in using Microsoft Excel is its ability to sort large amounts of data. What's the use of Excel, if you don't know how to sort? In this short video clip, learn how to go about sort your data in the order needed.
The Microsoft Office Access 2007 relational database manager enables information workers to quickly track and report information with ease thanks to its interactive design capabilities that do not require deep database knowledge. In this Microsoft Access video tutorial, you'll learn about sorting data using queries. For detailed instructions, and to get started using queries to sort data for yourself, watch this how-to.
Here is a quick video on how to convert Excel spreadsheet data to XML for import into Flash or Flex. Don't spend time typing all that data again, instead create a schema in Excel and convert it to XML.

In this helpful electronics tutorial video, you can learn how to erase data and information from your Apple iPhone. This how-to video makes erasing data from your iPhone easy and is especially helpful for new iPhone owners.
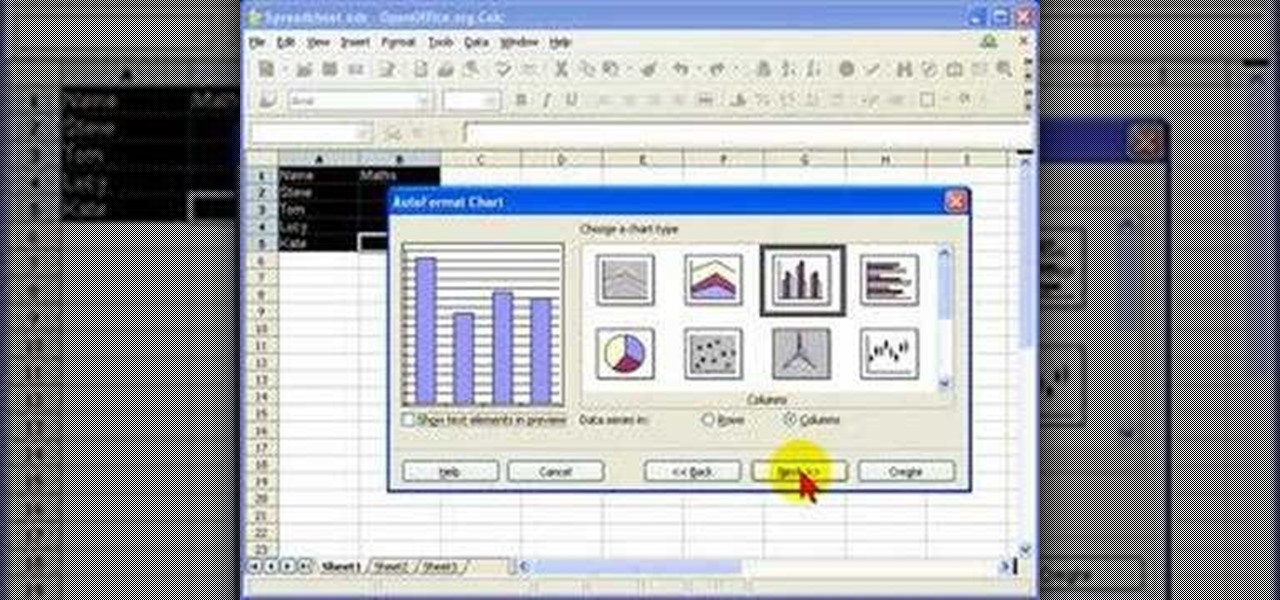
In this screencast tutorial, Steve shows you how to quickly and simply create a bar chart, from the data you have entered into your worksheet in Open Office Calc. If you're looking for a simple and clear way to represent your statistical data, then a simple bar chart is an option you should look at using. So check out this tutorial and start making OpenOffice Calc bar charts today.
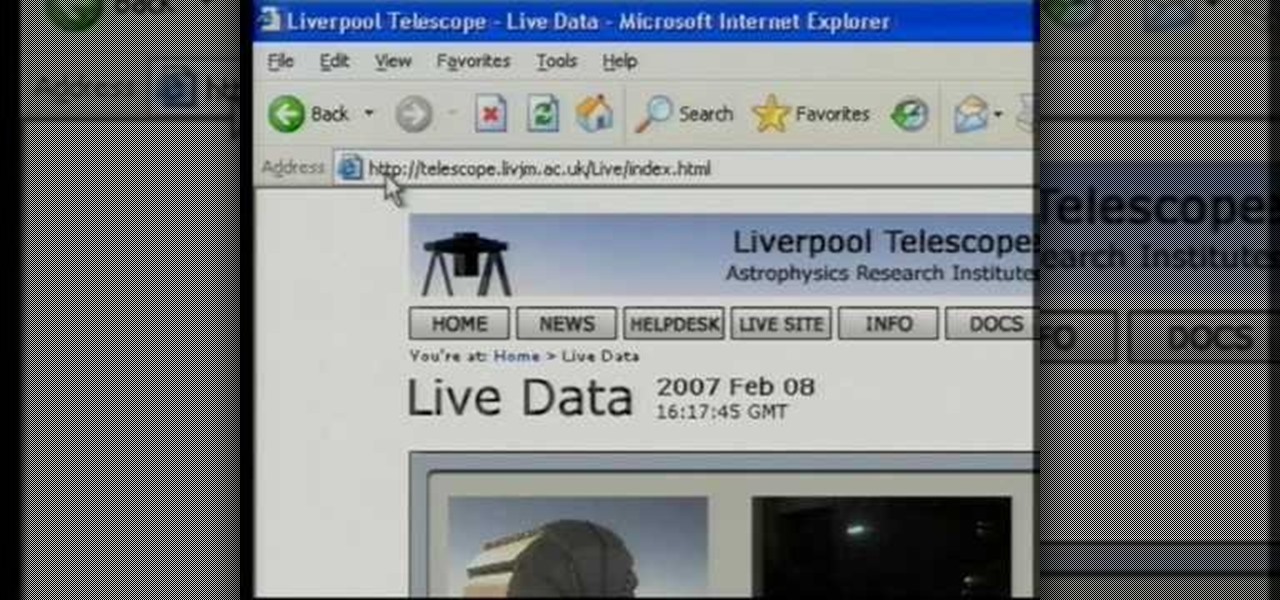
Learn how to Import External Data (i.e data from web pages) dynamically into Excel in Microsoft's Office 2007.
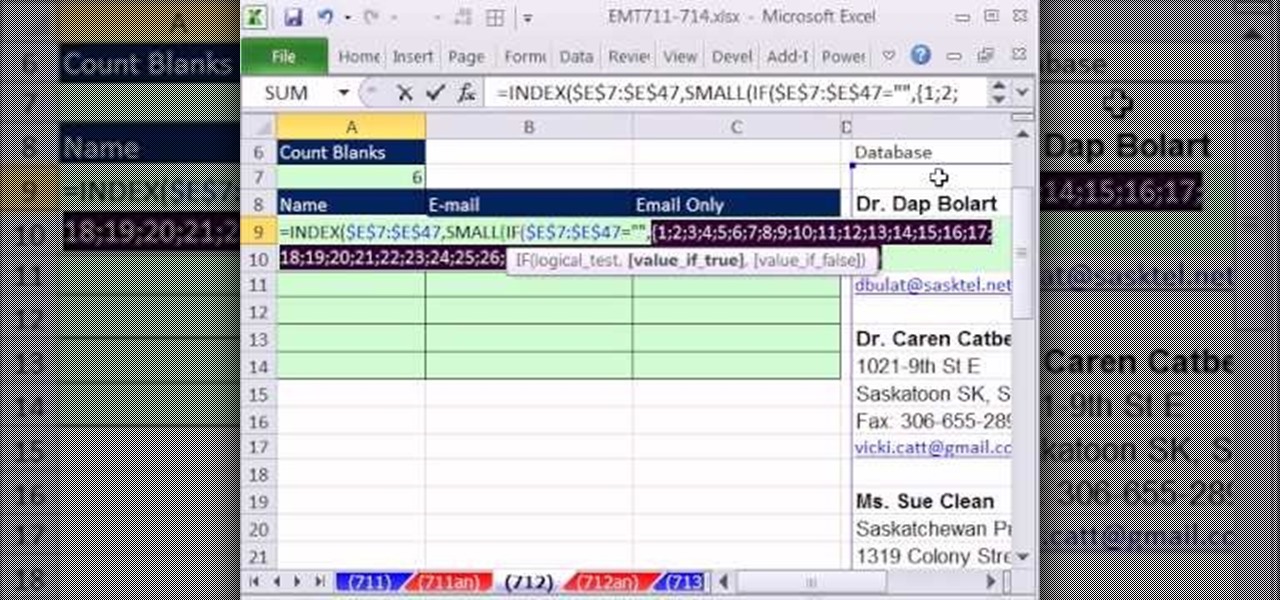
New to Microsoft Excel? Looking for a tip? How about a tip so mind-blowingly useful as to qualify as a magic trick? You're in luck. In this MS Excel tutorial from ExcelIsFun, the 712th installment in their series of digital spreadsheet magic tricks, you'll learn how to take bad data set up in one column and make a proper table of data for a mail merge as well as how to extract name and e-mail data from a list in one column where records are entered inconsistently.
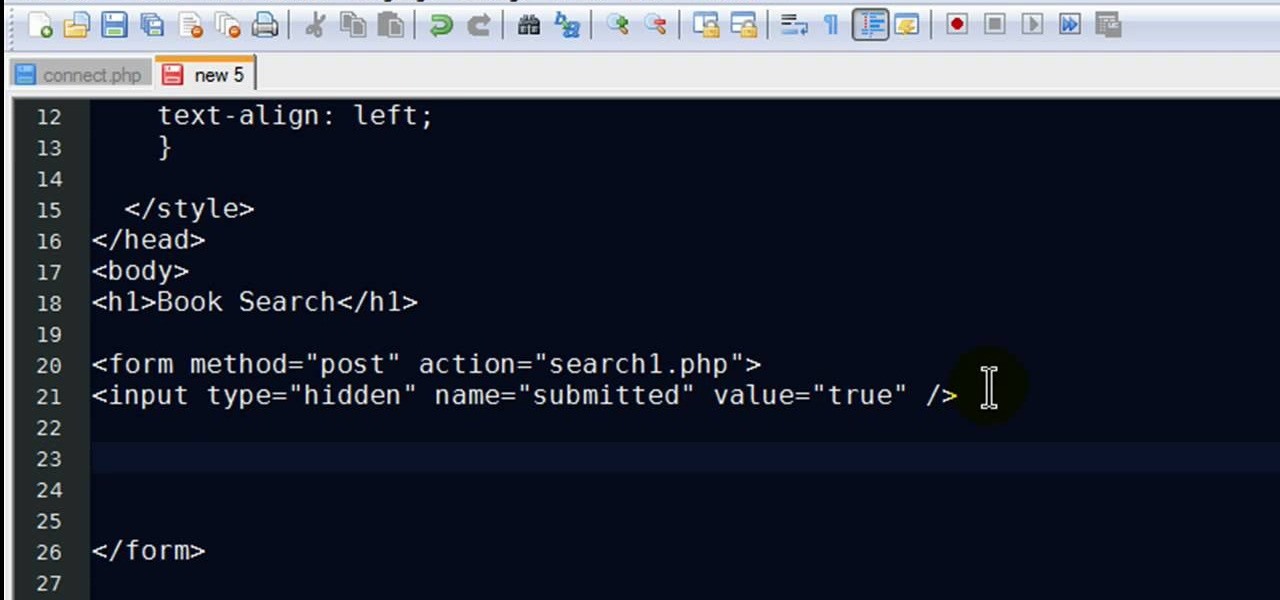
New to PHP? There's no better way to learn a scripting language than to code with it. And this two-part video guide, which demonstrates how to use a web form to retrieve data from a database with PHP, will get you started on your way.
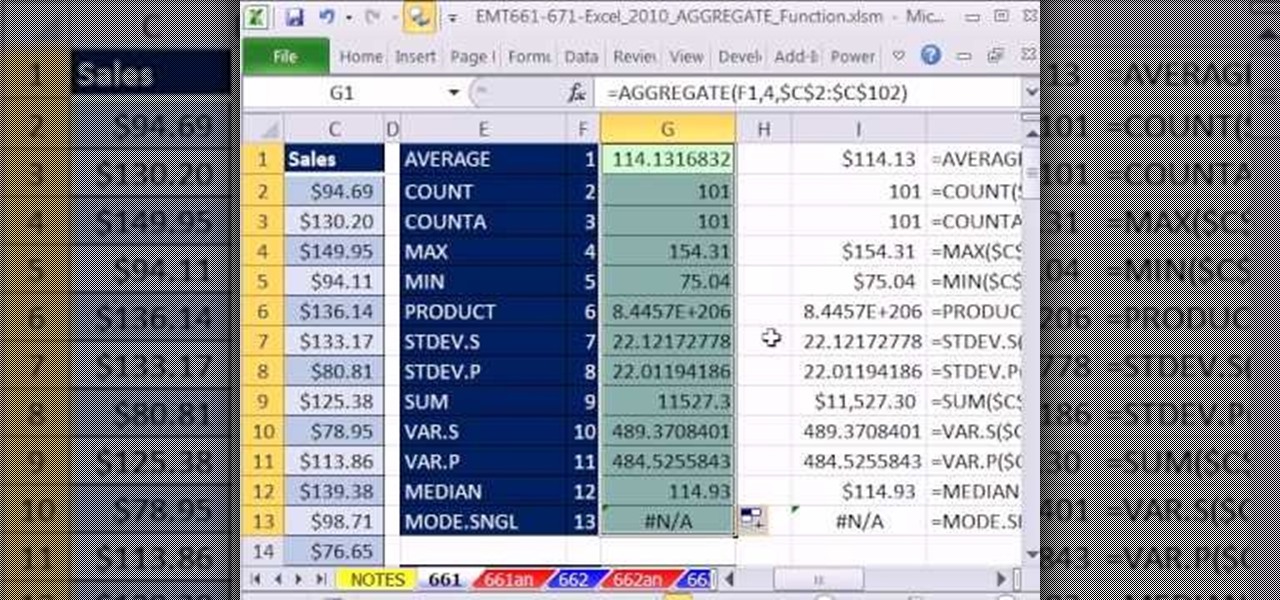
New to Microsoft Excel? Looking for a tip? How about a tip so mind-blowingly useful as to qualify as a magic trick? You're in luck. In this MS Excel tutorial from ExcelIsFun, the 664th installment in their series of digital spreadsheet magic tricks, you'll learn how about how the new Excel 2010 AGGREGATE function that can calculate these 19 different functions depending on what number you put into the 1st argument of the AGGREGATE function. This is an improvement over the SUBTOTAL function wh...

Data analytics is crucial to the operations of every modern business. This trend is going to continue: in three years, 71% of global enterprises predict a rapid increase in data analytics. Experienced professionals that can project manage data initiatives are in high demand.

In today's data-driven world, being well-versed in Big Data and analytics can help land an exciting and high-paying career. Whether you're interested in working for a major tech company or pursuing freelance work in development, you need to have a thorough understanding of the latest and greatest platforms in analytics if you want to succeed.