In this video, we learn how to hack your iPhone 3G. To do this, you will need: iPhone 3G, Firmware 3.0 or 3.1 file, charger cable, and the Redsn0w program. First, connect your phone to the computer and then start up the Redsn0w program on your computer. Turn the phone off, then restart it. The phone will now connect to the program on the phone and it will say "downloading jailbreak data". You will see a pineapple walking around on the screen. After this, restart your phone again and it will b...

In this video tutorial, viewers learn how to create drop down menus in Microsoft Excel. This task is very easy, fast and easy to do. Begin by highlighting a desired cell. Then click on the Data tab and click on Data Validation under Data Tools. When the Data Validates window opens, click on the Error tab and deselect "Show error alert after invalid data is entered". Then click on OK. Now simply type in the data into the selected cell. This video will benefit those viewers who use Microsoft Ex...
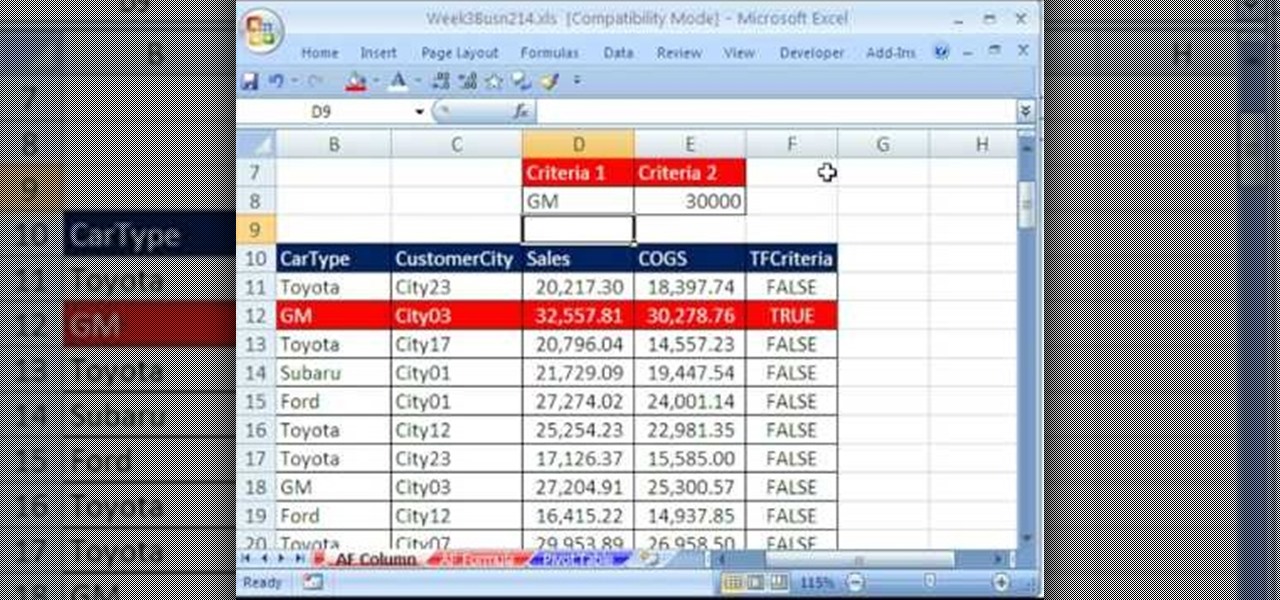
Whether you're interested in learning Microsoft Excel from the bottom up or just looking to pick up a few tips and tricks, you're in the right place. In this tutorial from everyone's favorite digital spreadsheet guru, ExcelIsFun, the 19th installment in his "Highline Excel Class" series of free video Excel lessons, you'll learn about using Advanced Filter to extract data from an Excel List/Table/Database. See these 7 Advanced Filter examples:
Recuva is a freeware data recovery program. Recuva recovers files deleted from your Windows computer, Recycle Bin, digital camera card, or MP3 player. Begin by downloading and installing Recuva. Open up the program and select the type of file you wish to recover. Input the information that is asked and start the scan. It will the provide a list of the files. Simply select the file and click Recover. This video will benefit those viewers who lost or deleted old files and wish to recover them u...

Core Data is a powerful data-management framework introduced with Mac OS X v10.4 Tiger. When you take advantage of Core Data, it slashes the amount of custom code you need to write in order to manage application data. Opening, saving and undo management can all be handled by Core Data, freeing you to concentrate on creating unique features for your application. This video tutorial, which presents a general introduction to using Core Data, will walk you through the process of building a simple...

Even Halo: Reach on the Xbox 360 has hidden collectable items! All in the convenient (for the people hiding them) size of a small data pad! Earlier you got access to the first 9 data pads that you can get on any difficulty. Next, you will get a look on the next 9 data pads that you can only acquire while being on Legendary difficulty!

If you use Microsoft Excel on a regular basis, odds are you work with numbers. Put those numbers to work. Statistical analysis allows you to find patterns, trends and probabilities within your data. In this MS Excel tutorial from everyone's favorite Excel guru, YouTube's ExcelsFun, the 32nd installment in his "Excel Statistics" series of free video lessons, you'll learn how to group when the quantitative data are whole numbers, integers or discrete data and how to group when the quantitative ...
New to Microsoft Excel? Looking for a tip? How about a tip so mind-blowingly useful as to qualify as a magic trick? You're in luck. In this MS Excel tutorial from ExcelIsFun, the 255th installment in their series of digital spreadsheet magic tricks, you'll learn how to create a two-variable data table in Excel for what-if analysis. See the PMT function and learn about the formula equivalent to a data table.
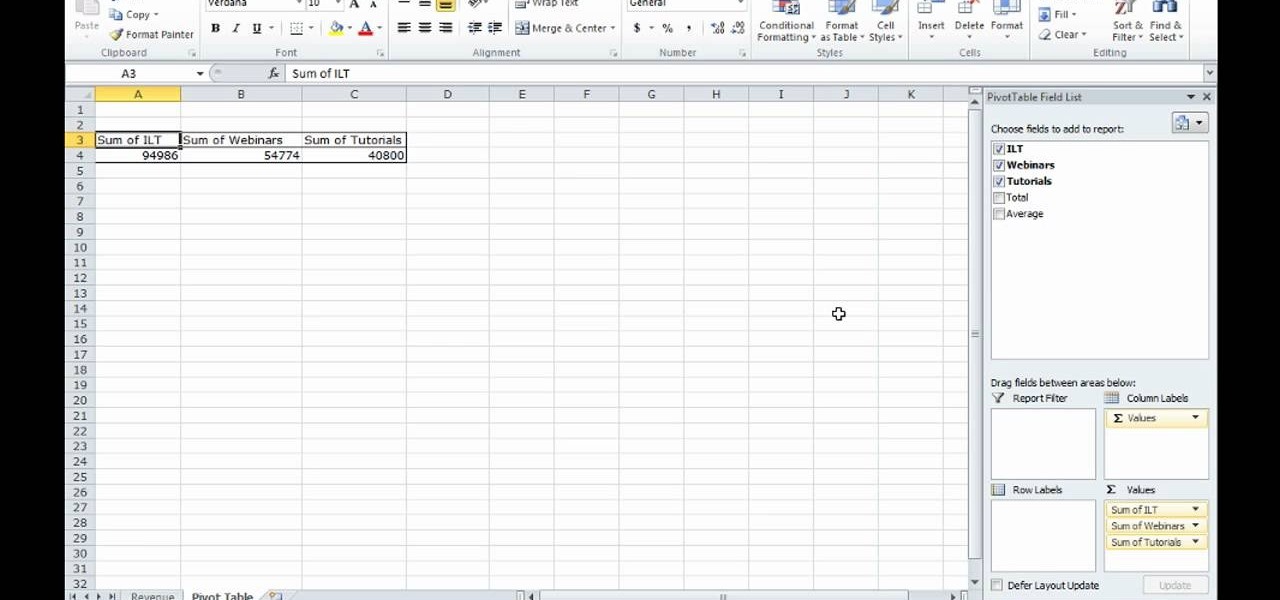
This video shows how to make a quick pivot table data filtering by using Excel 2010's ‘Slicer’ functionality. ‘Slicer’ delivers enhanced visual filtering method to allow you to get the data you need more quickly. When selecting a cell in the pivot table you will find ‘Slicer’ in the filter group of the ‘Insert’ tab. Click on ‘Slicer’ and an 'Insert Slicer' dialogue shows up where you can pick particular data fields from the slider list. Once you click on ‘OK’, the ‘Slicer’ objects with filter...
If you use Microsoft Excel on a regular basis, odds are you work with numbers. Put those numbers to work. Statistical analysis allows you to find patterns, trends and probabilities within your data. In this MS Excel tutorial from everyone's favorite Excel guru, YouTube's ExcelsFun, the 24th installment in his "Excel Statistics" series of free video lessons, you'll learn how to create quantitative data frequency distributions with pivot tables. See how to create the correct unambiguous labels ...
If you use Microsoft Excel on a regular basis, odds are you work with numbers. Put those numbers to work. Statistical analysis allows you to find patterns, trends and probabilities within your data. In this MS Excel tutorial from everyone's favorite Excel guru, YouTube's ExcelsFun, the 12th installment in his "Excel Statistics" series of free video lessons, you'll learn how to use Advanced Filter 'Unique Records Only" to extract a list of unique items from a data base, and then use the COUNTI...
Check out this informative video tutorial from Apple on how to format data values with the format bar in Numbers '09.
Format strings are a handy way for programmers to whip up a string from several variables. They are designed to save the programmer time and allow their code to look much cleaner. Unbeknownst to some programmers, format strings can also be used by an attacker to compromise their entire program. In this guide, we are going to look at just how we can use a format string to exploit a running program.
Data for mapping and other applications is the lifeblood of machine-driven cars, and so far, Tesla has taken a definitive lead in information it has gathered ahead of other driverless players, including Waymo.
Welcome back, my fledgling hackers! With this first article, I am initiating a new series intended to convey to my readers the skills necessary to develop your own exploits.
Free stuff is pretty cool. Free internet is even cooler—and free internet that is actually free is the coolest. If you would rather avoid sitting in a Starbucks and having to listen to hipsters discuss the proper length of cropped jeans, then this should be of interest.
As if you needed another reason to lock down your Facebook profile, the company's sketchy new partnership with data mining firm Datalogix is geared towards giving advertisers more information on what you're doing—even when you're not online. It's just not enough that they can target ads based on your preferences, now they want to know how those ads are influencing your buying habits in the real world.
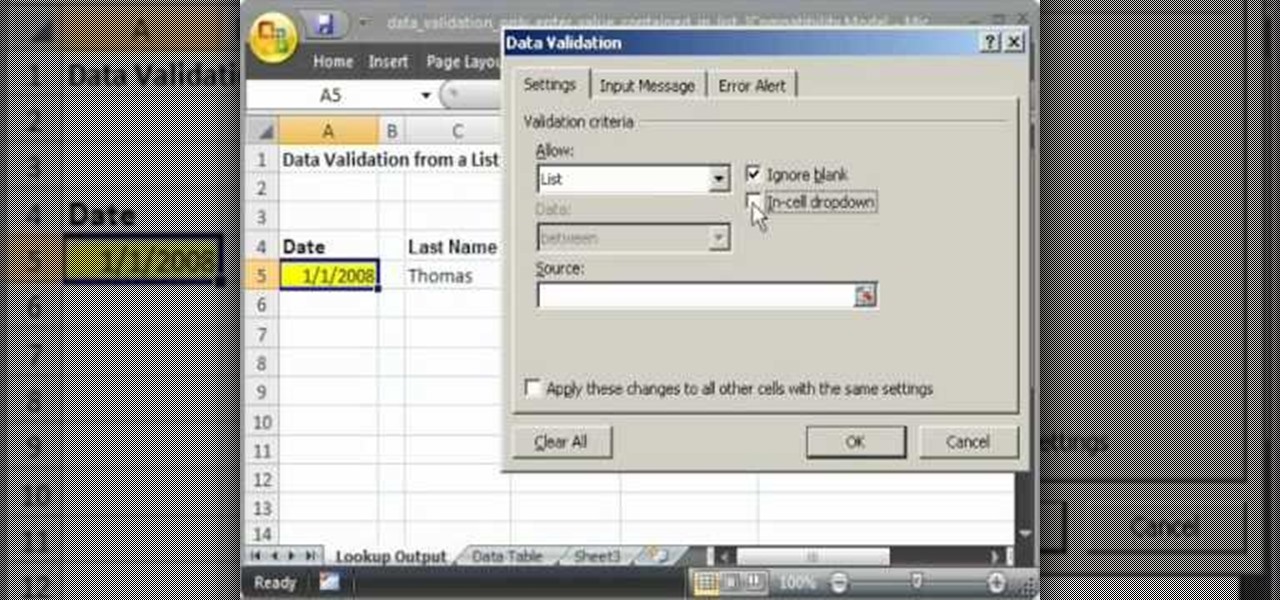
This video shows you how to idiot-proof a data set in Excel pretty much. It demonstrates how to enable data validation in a cell, so that when you type something in it must be in a predetermined list or will not work. Start by typing in your data table in a second tab. His example is a date, then information about certain employees based on that day. To enter the data validation menu, click the cell you want to use and then hit ALT+D+L to bring it up. Go to settings, then under the Allow menu...
Looking to find the standard deviation of your set of values? Standard deviation quantifies how diverse the values of your data set are, and is useful in determining how different your numbers are from each other.
We all have our reasons for erasing personal data from a phone. Whether you just ended a bad relationship whose face you never want to see again (lots of text messages) or just want to restore your privacy on the cell phone, erasing may be your only option.
If you use Microsoft Excel on a regular basis, odds are you work with numbers. Put those numbers to work. Statistical analysis allows you to find patterns, trends and probabilities within your data. In this MS Excel tutorial from everyone's favorite Excel guru, YouTube's ExcelsFun, the 10th installment in his "Excel Statistics" series of free video lessons, you'll learn how about data sets and the nominal, ordinal, interval and ration scales/levels of measurement and see two Pivot Tables that...
In this article, I'll be explaining the basics of how microcontrollers work, physically and virtually. First off, microcontrollers are no simple thing, so don't be discouraged if you find it mind-boggling! The world of microcontrollers is fascinating, engaging, and an awesome hobby; it never gets boring. I'll be focusing more on I/O and analog based microcontrollers, such as those running Arduino, and using Atmel chips as examples (these are most commonly available, and easy to program).
Excel is great, and if you're a Mac user, Excel 2008 for Mac has a lot of new and useful great features you can use to maximize efficiency in your spreadsheets. Excel doesn't have to be the boss anymore, you can! The Microsoft Office for Mac team shows you all the great features in this how-to video.
Data can be troubling, especially if there's a ton of it plaguing your Excel worksheet. But Excel 2008 for Mac makes life a little easier and less confusing thanks to a few worksheet tips and features you can utilize to work with your data in worksheet cells. The Microsoft Office for Mac team shows you just how to work with worksheets in this how-to video.
Not every client or coworker likes to mine through a spreadsheet to find all the important data. So, with Excel 2008 for Mac, you can easily share that data without sending the entire Excel spreadsheet. To do this, all you need to do is to use the "copy as picture" option. The Microsoft Office for Mac team shows you just how to insert a spreadsheet snippet in this how-to video.
Another AR cloud savior has emerged this week in Fantasmo, a startup that wants to turn anyone with a smartphone into a cartographer for spatial maps.
For companies wary of the temperature, PTC just made it easier for them to dip their toes in the waters of augmented reality.
HoloLens developer Michael Peters of In-Vizible has released quite a few videos since receiving his HoloLens last year. Many of his experiments are odd and funny, but some include serious potential approaches to data visualization. In the videos embedded below, you'll specifically see stock market information beautifully rendered in different ways to help understand the data.
Hey guys, in this tutorial, we are going to learn about the heap segment and how to use it for storing data in our programs. We will also go into the details of its use in conjunction with the char pointer and struct data types.
NOTICE: Ciuffy will be answering questions related to my articles on my behalf as I am very busy. Hope You Have Fun !!!
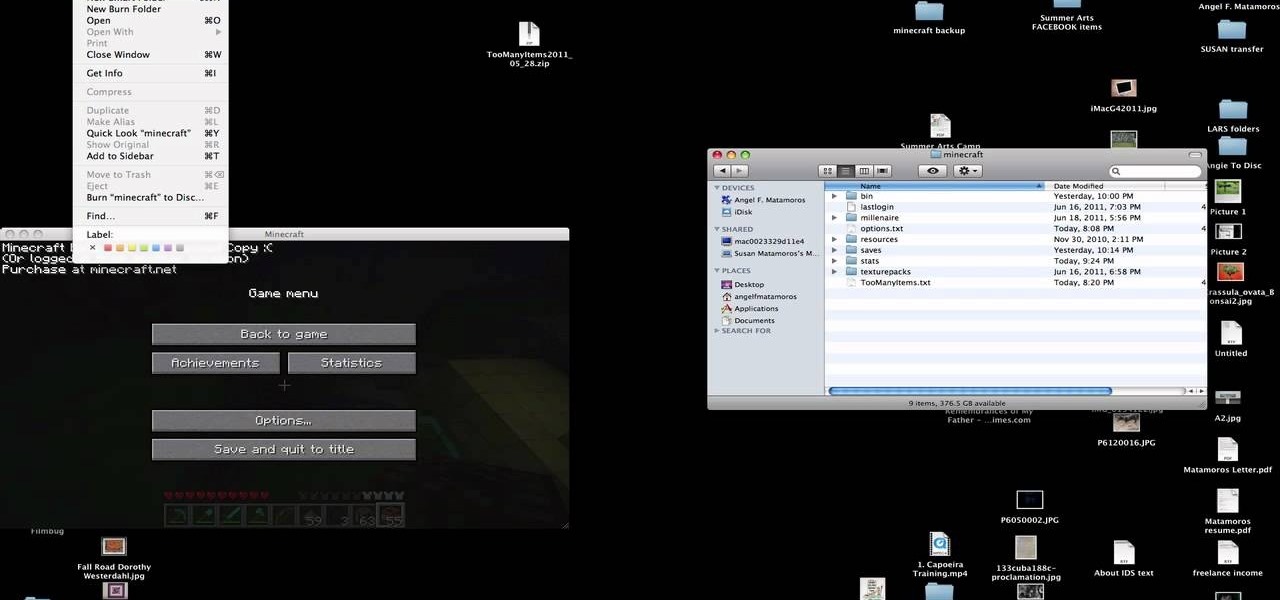
You have worked long and hard creating an entire world of Minecraft data. Make sure you have all of that saved data backed up. Watch this video to learn how to backup your Minecraft data. You will be glad that you did.
Thirty dollars a month may be a little steep for an unlimited data plan for iPad users. To cut down on your data usage, you can download the Offline Pages app to browse articles or blogs offline. InstaPaper is another account you can use as well, and both will cut down on your data usage per month.
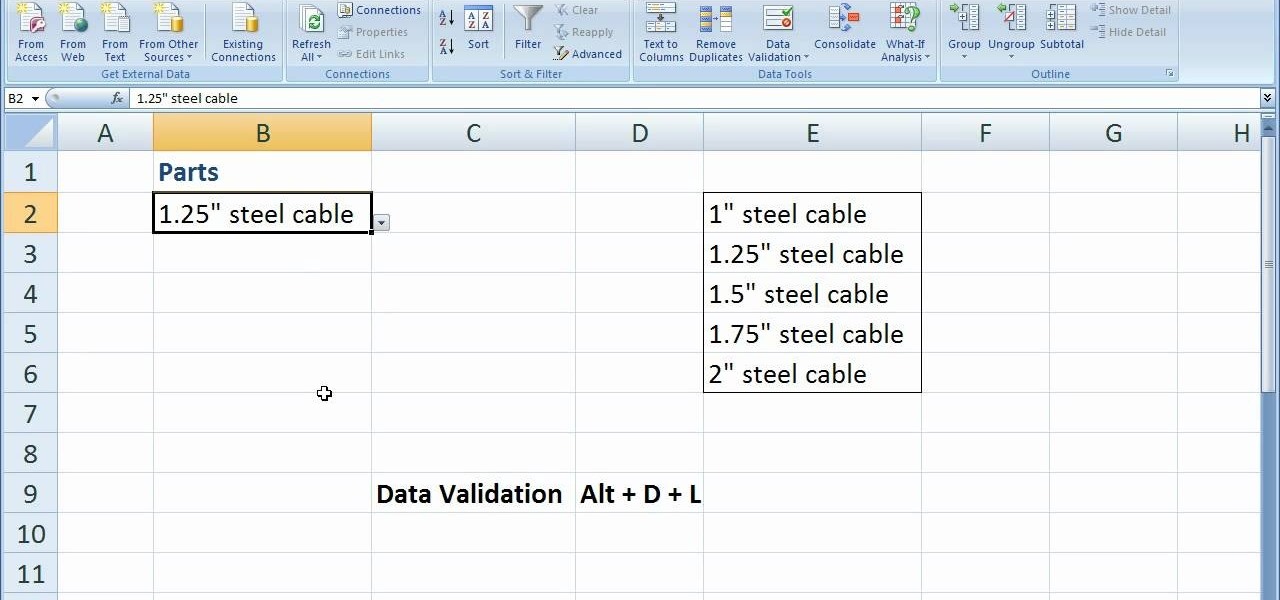
In this software video tutorial you will learn how to create drop down menus in Excel using Data Validation. This example will show you how to display a list of parts in a drop down menu. Create the list of parts somewhere in your worksheet. Then in the cell underneath the one where you want to display the parts, go to the data validation window and enter the data. For this select the cell and then press 'Alt + D + L' to bring up the data validation box. Here you click on 'settings' and selec...
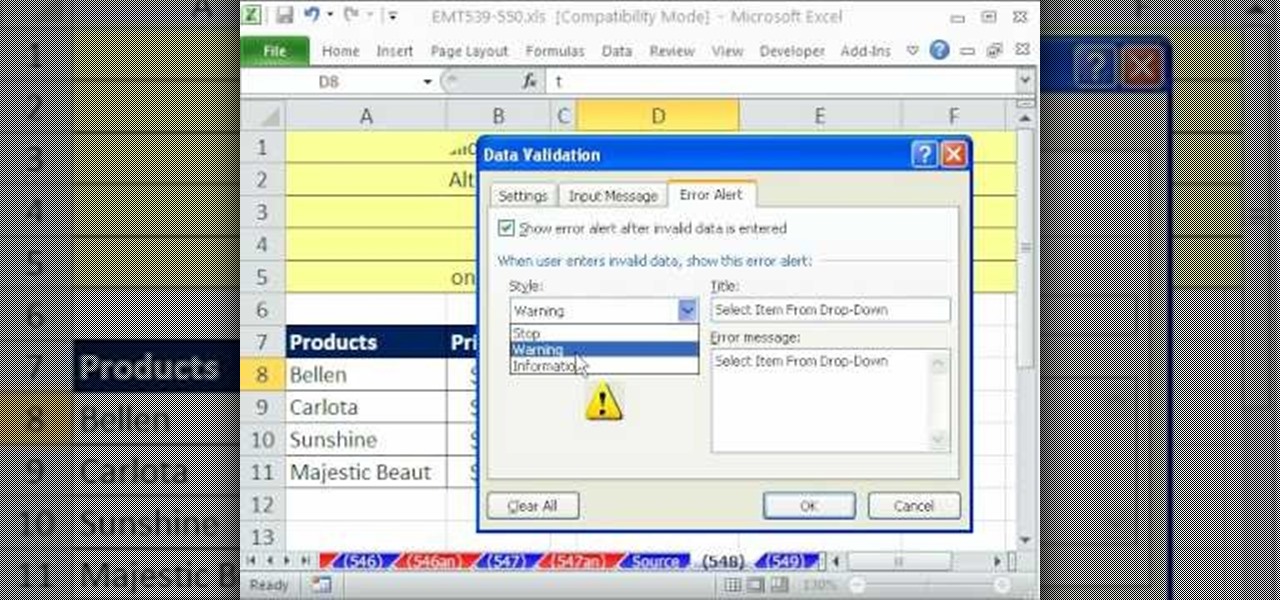
If you want to manage what sort of data is entered into your Excel spreadsheet, data validation will help you to accomplish just that. In this Excel tutorial from ExcelIsFun, the 549th installment in their series of Excel magic tricks, you'll learn how to use data validation to full effect in your Microsoft Office projects.
This lynda.com video tutorial shows how to use container fields with FileMaker Pro 10. When you want to create fields in FileMaker database you have the choice on what kind of fields you want to make. Many general fields are self explanatory like text, date etc., but there is a special kind of field called the container field. FileMaker Pro container field is a versatile data type in that it can store any kind of binary data. Container fields can be used to hold binary data in four broad clas...
A histogram is a summary graph showing a count of data points that fall in various ranges. Histograms are used in statistics and other forms of mathematics. In this video, learn how to create your own histogram using data analysis on the computer. This tutorial will show you how to create a frequency distribution, a cumulative frequency distribution, a histogram chart and an ogive chart with the data analysis add-in.
See how simple it is to create data-driven web sites using ASP.NET 2.0, Visual Web Developer 2005 Express Edition, and SQL Server 2005 Express Edition. Watch this video tutorial to learn how to create a database, add its data, and display that data on a web page.
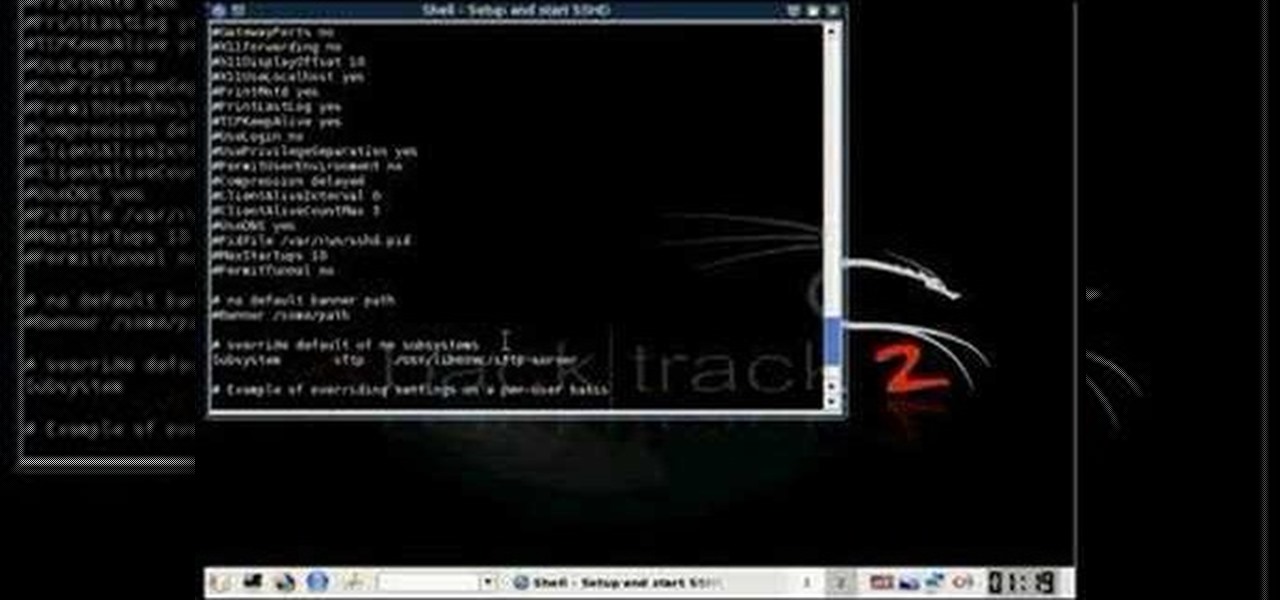
This new episode of Full Disclosure shows you how to use a SSH Tunnel to secure your data when you are on an untrusted LAN (ex. Coffee Shop, School's network, or Defcon). Furthermore, you can use the SSH Tunnel to bypass the LAN's internet filters. The SSH tunnel protocol works by encapsulates your data into an encrypted payload and transmitting it to the SSH Server which is setup on a trusted LAN.
In Halo: Reach for the Xbox 360, there is so much to do! The campaign, the multiplayer, the achievements! But One tough one to get is all 19 hidden data pads. Luckily for you, the first nine can be acquired on any difficulty, and in this video you will learn the locations of all nine of the initial data pads on levels such as Winter Contingency and Pillar of Autumn!
If you use Microsoft Excel on a regular basis, odds are you work with numbers. Put those numbers to work. Statistical analysis allows you to find patterns, trends and probabilities within your data. In this MS Excel tutorial from everyone's favorite Excel guru, YouTube's ExcelsFun, the 27th installment in his "Excel Statistics" series of free video lessons, you'll learn how to create a quantitative data dot plot chart using the REPT and COUNTIF functions.