Bohemian hair, fashion, and beauty have been super hot in Hollywood for the past year or so, and the trend is showing no signs of slowing down. While many hip young designers offer bohemian bangles and earrings at trendy L.A. boutiques, avoid denting your wallet with their overpriced goods by making some bohemian earrings yourself!

With winter in full swing, it's time to bring the scarves out of the closet. The trend this year is the tube scarf or infinity scarf, and here is how you can take a scarf you already have and update it to this style.

"Scene" bangs is just a fancy way of saying cool-looking, hipster bangs. You can't rock the hipster trend the way it was meant to be rocked if you only have the skinny jeans, loose organic cotton top, and bangles, right?

Anyone in the world of makeup knows who Pat McGrath is. The world renowned makeup artist recently did the makeup for a catwalk for designer Roberto Caballi, and instead of taking the usual black smokey eyes look, she went for a new trend this season— BROWN! In this tutorial, you'll learn how to create a bold and beautiful brown smokey eyes look, great for the autumn and winter months.

Dolls may freak the rest of us out, but for a lot of girls in Japan looking like a doll - scarily large, beady eyes, perfect ringlets, and porcelain skin - is its own beauty and style trend.

Braids seem to be the latest Hollywood trend. Very rarely do you see boho stars like Nicole Richie, Blake Lively, Mary-Kate Olsen or Mischa Barton without at least one twisted strand in their hair.

Feeling a tad bored with your look? Get some fashion help from Emmy-nominated costume designer, Cate Adair, on how to dress like a young, hot Hollywood celebrity. Looking like a Hollywood celebrity involves taking fashion risks, such as mixing designer clothing with vintage pieces, wearing over-the-top accessories and bringing back old trends. Find ways to dress like a hot young star with tips found in this how-to video.
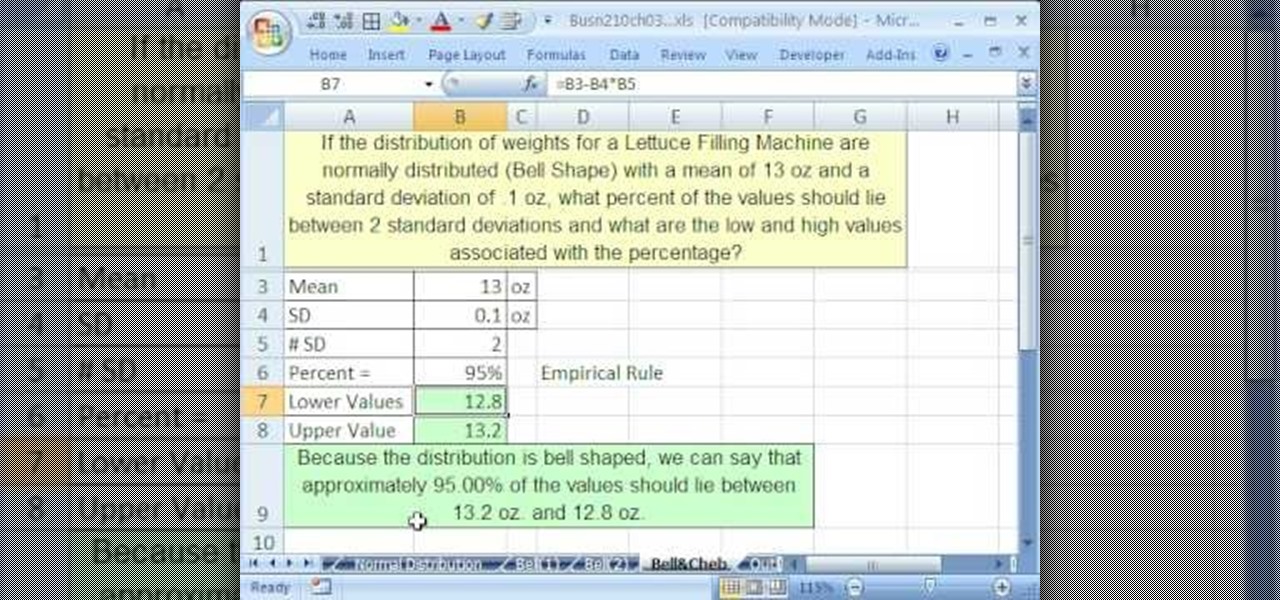
If you use Microsoft Excel on a regular basis, odds are you work with numbers. Put those numbers to work. Statistical analysis allows you to find patterns, trends and probabilities within your data. In this MS Excel tutorial from everyone's favorite Excel guru, YouTube's ExcelsFun, the 48th installment in his "Excel Statistics" series of free video lessons, you'll see comparison of Chebyshev's Theorem and the Empirical Rule (bell curve) and learn when to apply which.
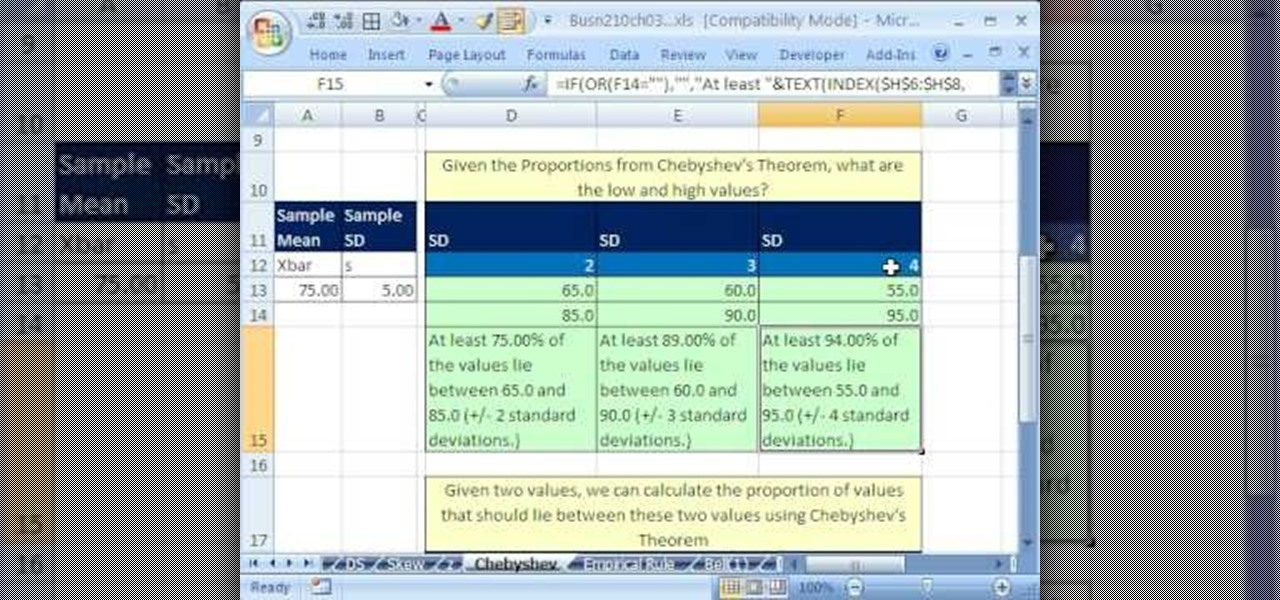
If you use Microsoft Excel on a regular basis, odds are you work with numbers. Put those numbers to work. Statistical analysis allows you to find patterns, trends and probabilities within your data. In this MS Excel tutorial from everyone's favorite Excel guru, YouTube's ExcelsFun, the 46th installment in his "Excel Statistics" series of free video lessons, you'll learn about Chebyshev's Theorem and how to apply it in three different ways.
If you use Microsoft Excel on a regular basis, odds are you work with numbers. Put those numbers to work. Statistical analysis allows you to find patterns, trends and probabilities within your data. In this MS Excel tutorial from everyone's favorite Excel guru, YouTube's ExcelsFun, the 43rd installment in his "Excel Statistics" series of free video lessons, you'll learn how to use the Excel Data Analysis add-in descriptive statistics tool.
If you use Microsoft Excel on a regular basis, odds are you work with numbers. Put those numbers to work. Statistical analysis allows you to find patterns, trends and probabilities within your data. In this MS Excel tutorial from everyone's favorite Excel guru, YouTube's ExcelsFun, the 42nd installment in his "Excel Statistics" series of free video lessons, you'll learn how to calculate the coefficient of variation.
If you use Microsoft Excel on a regular basis, odds are you work with numbers. Put those numbers to work. Statistical analysis allows you to find patterns, trends and probabilities within your data. In this MS Excel tutorial from everyone's favorite Excel guru, YouTube's ExcelsFun, the 30th installment in his "Excel Statistics" series of free video lessons, you'll learn how to create a scatter diagram for 2 quantitative variables.
If you use Microsoft Excel on a regular basis, odds are you work with numbers. Put those numbers to work. Statistical analysis allows you to find patterns, trends and probabilities within your data. In this MS Excel tutorial from everyone's favorite Excel guru, YouTube's ExcelsFun, the 51st installment in his "Excel Statistics" series of free video lessons, you'll learn how to understand, work with and find simple probabilities in Microsoft Office Excel.
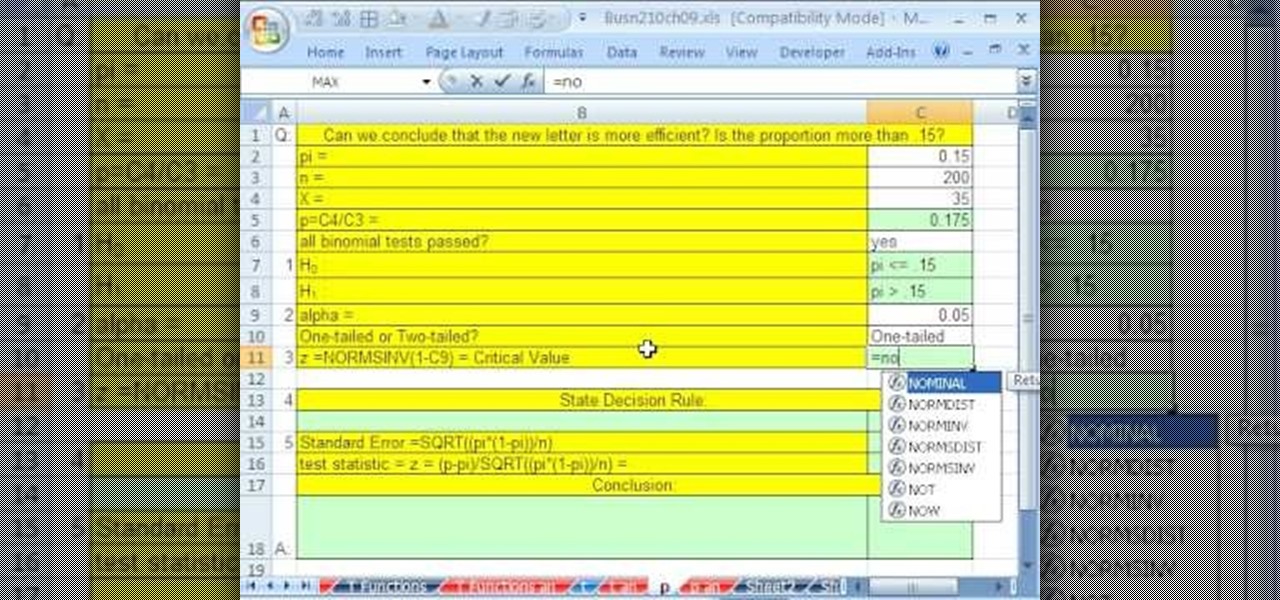
If you use Microsoft Excel on a regular basis, odds are you work with numbers. Put those numbers to work. Statistical analysis allows you to find patterns, trends and probabilities within your data. In this MS Excel tutorial from everyone's favorite Excel guru, YouTube's ExcelsFun, the 93rd installment in his "Excel Statistics" series of free video lessons, you'll learn how to use the NORMSINV and NORMSDIST functions to complete a hypothesis test about a population proportion.
If you use Microsoft Excel on a regular basis, odds are you work with numbers. Put those numbers to work. Statistical analysis allows you to find patterns, trends and probabilities within your data. In this MS Excel tutorial from everyone's favorite Excel guru, YouTube's ExcelsFun, the 83rd installment in his "Excel Statistics" series of free video lessons, you'll learn how to construct confidence intervals when the sigma (population standard deviation) in NOT known using the TINV function.
If you use Microsoft Excel on a regular basis, odds are you work with numbers. Put those numbers to work. Statistical analysis allows you to find patterns, trends and probabilities within your data. In this MS Excel tutorial from everyone's favorite Excel guru, YouTube's ExcelsFun, the 29th installment in his "Excel Statistics" series of free video lessons, you'll learn how to create quantitative data cross tabulation using a pivot table (PivotTable).
If you use Microsoft Excel on a regular basis, odds are you work with numbers. Put those numbers to work. Statistical analysis allows you to find patterns, trends and probabilities within your data. In this MS Excel tutorial from everyone's favorite Excel guru, YouTube's ExcelsFun, the 11th installment in his "Excel Statistics" series of free video lessons, you'll learn how to work with, and create charts for, cross-sectional and time-series data.
If you use Microsoft Excel on a regular basis, odds are you work with numbers. Put those numbers to work. Statistical analysis allows you to find patterns, trends and probabilities within your data. In this MS Excel tutorial from everyone's favorite Excel guru, YouTube's ExcelsFun, the 13th installment in his "Excel Statistics" series of free video lessons, you'll learn how to install the Excel 2007 Data Analysis add-in.
Eddy Currents are little circles of electricity created when metals are moved by magnets or even when magnets are moved by metals. To understand this practically take a regular piece of cardboard and drop it in between a horse shoe magnet. It drops normally with out being effected by the magnet. This is because the cardboard does not conduct electricity. Therefore it does not cause any eddy currents. But instead if you use an aluminum piece in the same way, it falls very slowly, because alumi...
The manicure look in this how-to video walks a line between toughness and polishing, mixing the trend of all black manicures and the classic French tip. All you need is black nail polish and a steady of hand. Learn how to do a french manicure with black tips by watching this video nail care tutorial.
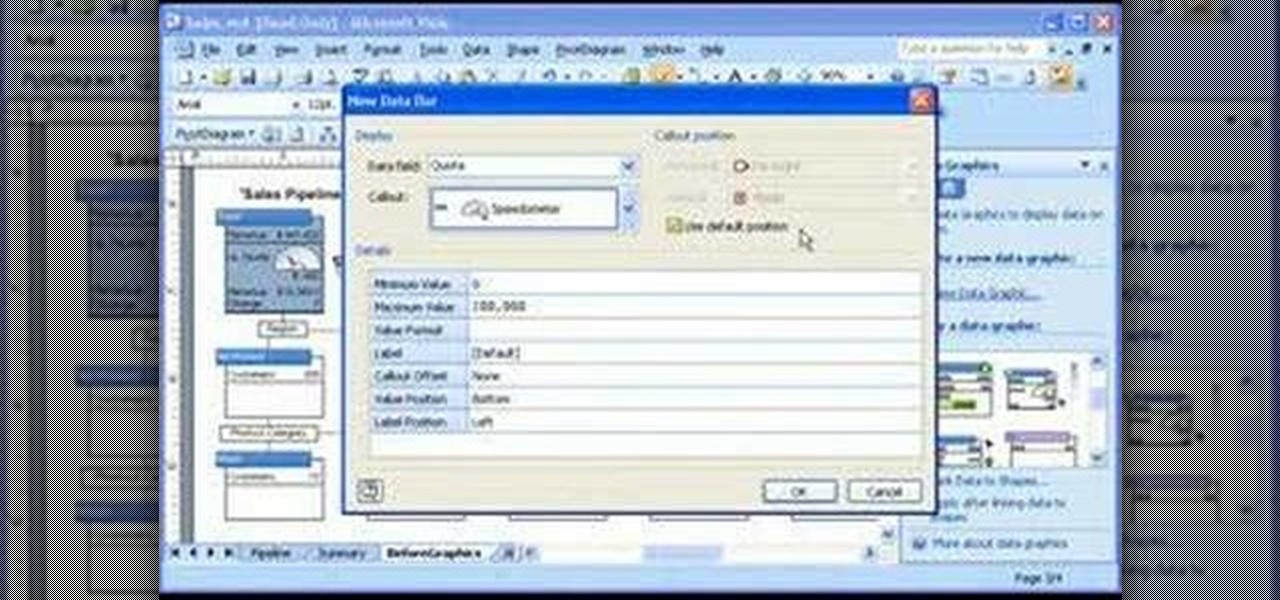
Take a look at this instructional video and learn how to customize progress meters, icons, color coding, and other graphical elements to emphasize sales trends, product performance, critical deadlines, or whatever information is contained in the data behind your diagram.
Over the course of the past century or so, media consumption has gone from a few readers enjoying their local print publication to billions of users viewing countless hours of video across the globe each day. This was a gradual evolution at first, but recent advancements in mobile connectivity have sent us into a climb the likes of which we have never seen before.
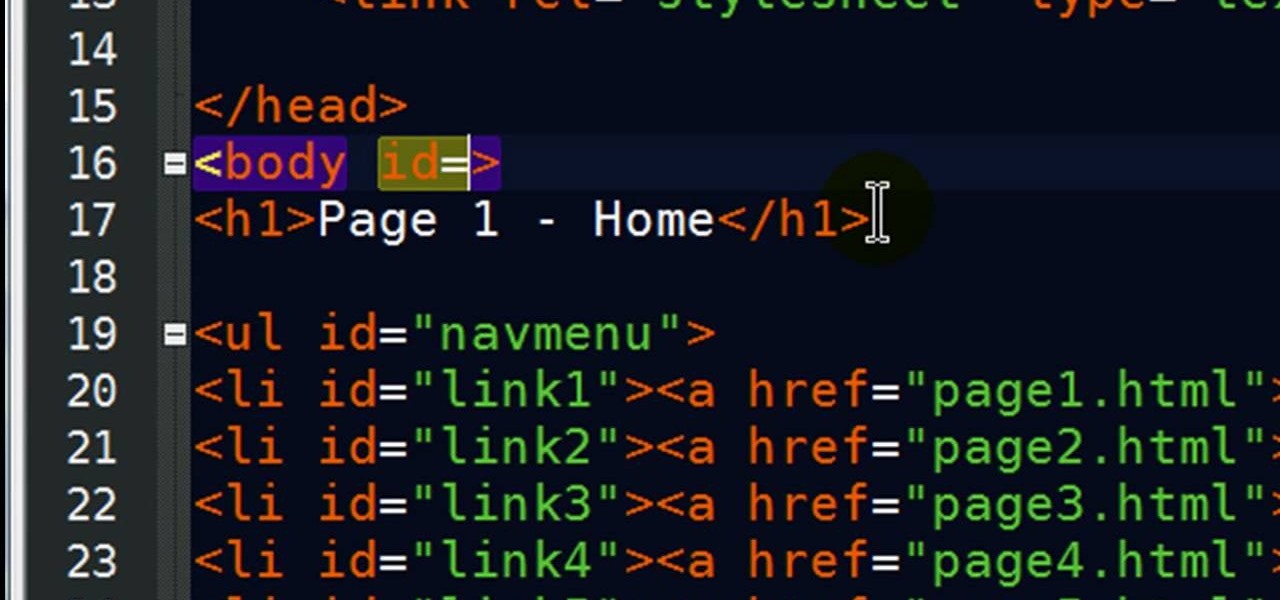
In this clip, you'll learn how to create a vertical nav menu with a current page indicator using HTML and CSS (cascading style sheets). For more information, including a complete demonstration, and detailed, step-by-step instructions, as well as to get started creating your own dynamic navigation menus, take a look.
There's nothing quite like getting lost in the TikTok void. While you'll likely never run into the same video twice, the same can't be said for popular sounds and fads. Some trends get so viral, it feels like you hear the same song or track every other TikTok. Just know this: you don't have to put up with any trend you're sick of.
The past year brought about a number of trends in the smartphone space. More immersive displays, better processors, and portrait mode for cameras come to mind as big steps forward. One of the most polarizing trends that continued in 2017 is the removal of the 3.5 mm headphone jack from flagship phones. The number of manufacturers that have completely dispensed with wired audio is staggering, so let's run down the full list!
Typing out thirty hashtags on Instagram is always such an annoying process. Figuring out the best hashtags to use to get more likes is also tricky. You can't just keep copying and pasting the same hashtags on every post — that's like attacking the same tribe every time. You got to diversify, which takes a lot of conscious effort to be on top of the current best hashtags to use.
Excel is great, and if you're a Mac user, Excel 2008 for Mac has a lot of new and useful great features you can use to maximize efficiency in your spreadsheets. Excel doesn't have to be the boss anymore, you can! The Microsoft Office for Mac team shows you all the great features in this how-to video.
A riptide can be terrifying. But if you keep your cool and know what to do, you'll stay safe. You Will Need
This is a recording of a class lecture on Voltage Sources. The first part describes how mechanical friction can generate voltages.
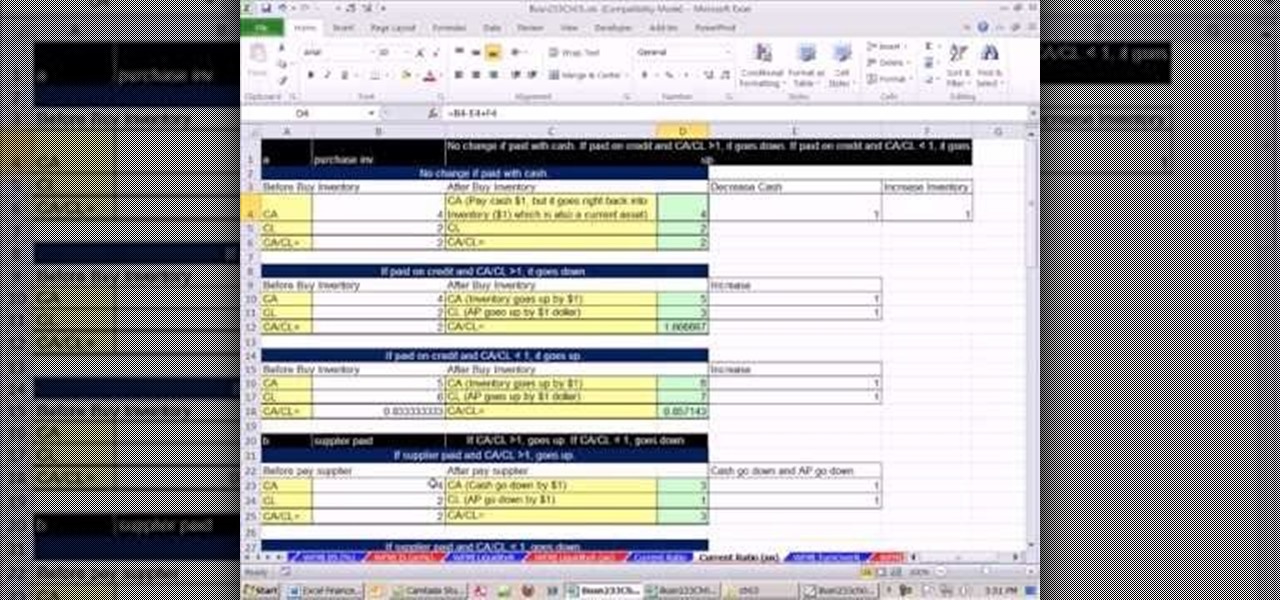
As you might guess, one of the domains in which Microsoft Excel really excels is finance math. Brush up on the stuff for your next or current job with this how-to. In this tutorial from everyone's favorite digital spreadsheet guru, YouTube's ExcelIsFun, the 16th installment in his "Excel Finance Class" series of free video lessons, you'll learn how to calculate liquidity ratios including current ratio, times interest earned and cash Ratio. Also see how current ratio changes when certain trans...
It looks like the Huawei P20 Pro won't be the only phone with a triple camera for much longer. Rumors indicate the upcoming LG V40 ThinQ will share the same number of cameras. And just like with dual cameras, LG is showing that there is more than one way to arrange them.
The rumor that the iPhone 8 will ship with 3D camera system is not a new one, but a new analysis by Morgan Stanley's Charlie Chan lends credibility to the speculation. Now, it appears more likely than ever that Apple's next iPhone will ship with 3D capabilities, increasing potential for AR and VR integration in the future.
Want to be on top of the trends this winter season? Circle scarfs are in now, and they are super easy to make! All you need is two yards of your favorite fabric, then sew it into a tube to create your own scarf.
When it comes to Gossip Girl Blair Waldorf's wardrobe, big hair bows come only second to hairbands for hair accessories. But you don't need to purchase a bunch of hairbands with big bows on top of them to stay on top of the trend.
With feminine florals being one of the hottest spring and summer trends, it's often recommended by the fashion elite - including Tim Gunn - that more masculine elements be included in your outfits to balance out floral girliness.
If you use Microsoft Excel on a regular basis, odds are you work with numbers. Put those numbers to work. Statistical analysis allows you to find patterns, trends and probabilities within your data. In this MS Excel tutorial from everyone's favorite Excel guru, YouTube's ExcelsFun, the 92nd installment in his "Excel Statistics" series of free video lessons, you'll learn how to use the TINV and TDIST functions to test a hypothesis.
If you use Microsoft Excel on a regular basis, odds are you work with numbers. Put those numbers to work. Statistical analysis allows you to find patterns, trends and probabilities within your data. In this MS Excel tutorial from everyone's favorite Excel guru, YouTube's ExcelsFun, the 85th installment in his "Excel Statistics" series of free video lessons, you'll learn how to construct confidence intervals for proportions using NORMSINV function and other formulas.
A new fashion trend on the rise: In-the-embroidery hoop purses! Add flair and fun with these embroidery project designs. Just follow this instructional video, and you can make fun gifts.
Watch as MSN's Glam Squad member Stefani Greenfield, co-founder of Scoop NYC, teaches viewers how to liven up their work wardrobes with new black and white trends.
Yes, they slurped cosmos by the gallon on Sex & the City, launching this pretty-in-pink drink into the super-trend stratosphere. But those ladies had the right idea: this delicious cocktail lives up to the hype.