New to Microsoft Excel 2010? Looking for a few good tips and tricks? Look no further. In this free video tutorial from everyone's favorite MS Excel guru, YouTube's ExcelIsFun, the 5th installment in his series of Excel 2010 video tutorials, you'll learn how to apply conditional formatting to cell data bars.

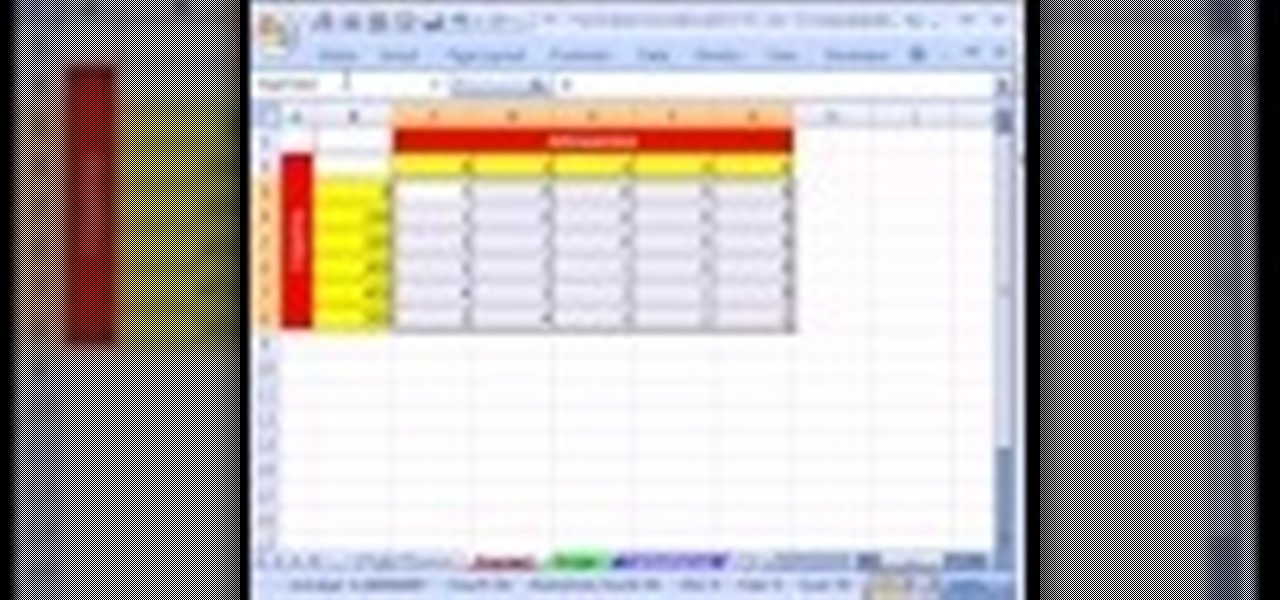
New to Microsoft Excel? Looking for a tip? How about a tip so mind-blowingly useful as to qualify as a magic trick? You're in luck. In this MS Excel tutorial from ExcelIsFun and Mr. Excel, the 4th installment in their joint series of digital spreadsheet magic tricks, you'll learn how to create charts to compare data values.
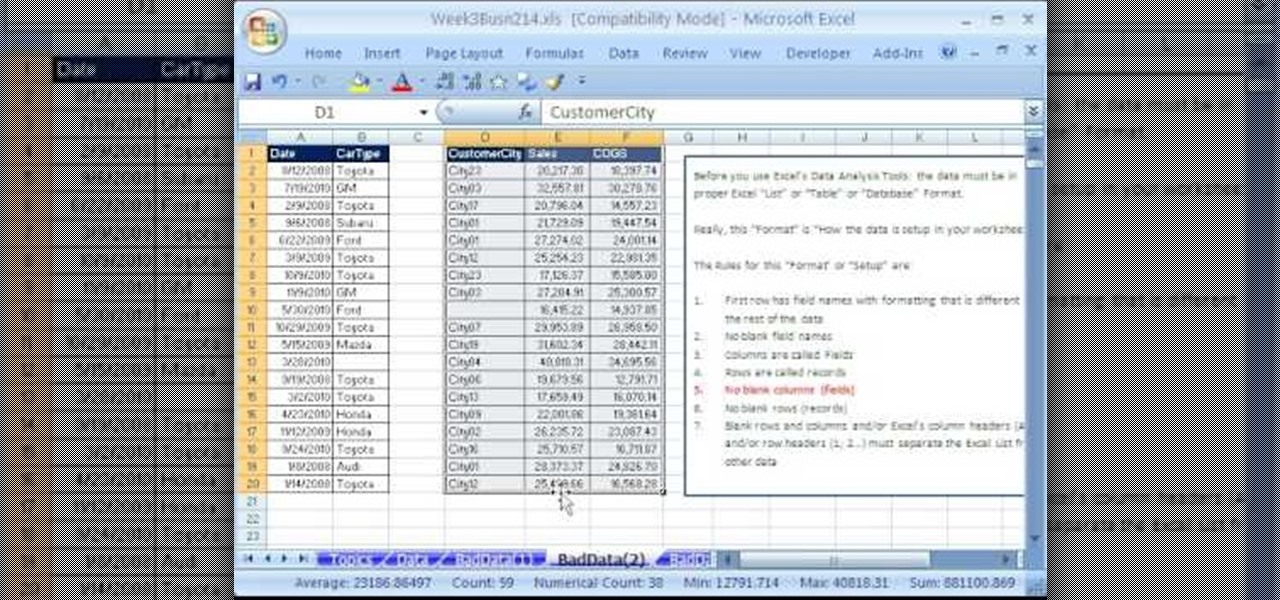
Whether you're interested in learning Microsoft Excel from the bottom up or just looking to pick up a few tips and tricks, you're in the right place. In this tutorial from everyone's favorite digital spreadsheet guru, ExcelIsFun, the 14th installment in his "Highline Excel Class" series of free video Excel lessons, you'll learn how to set up data in Excel so sorting, filtering, subtotals and PivotTables (Pivot Tables) can be done easily.
Whether you're interested in learning Microsoft Excel from the bottom up or just looking to pick up a few tips and tricks, you're in the right place. In this tutorial from everyone's favorite digital spreadsheet guru, ExcelIsFun, the 11th installment in his "Highline Excel Class" series of free video Excel lessons, you'll learn how to transform bad data into useful data using formulas and text functions such as TRIM, PROPER, SUBSTITUTE, REPLACE, FIND and LEFT. Also see how to use the ampersan...

If you use Microsoft Excel on a regular basis, odds are you work with numbers. Put those numbers to work. Statistical analysis allows you to find patterns, trends and probabilities within your data. In this MS Excel tutorial from everyone's favorite Excel guru, YouTube's ExcelsFun, the 44th installment in his "Excel Statistics" series of free video lessons, you'll learn how to use the SKEW function to calculate the skew in a distribution of data.
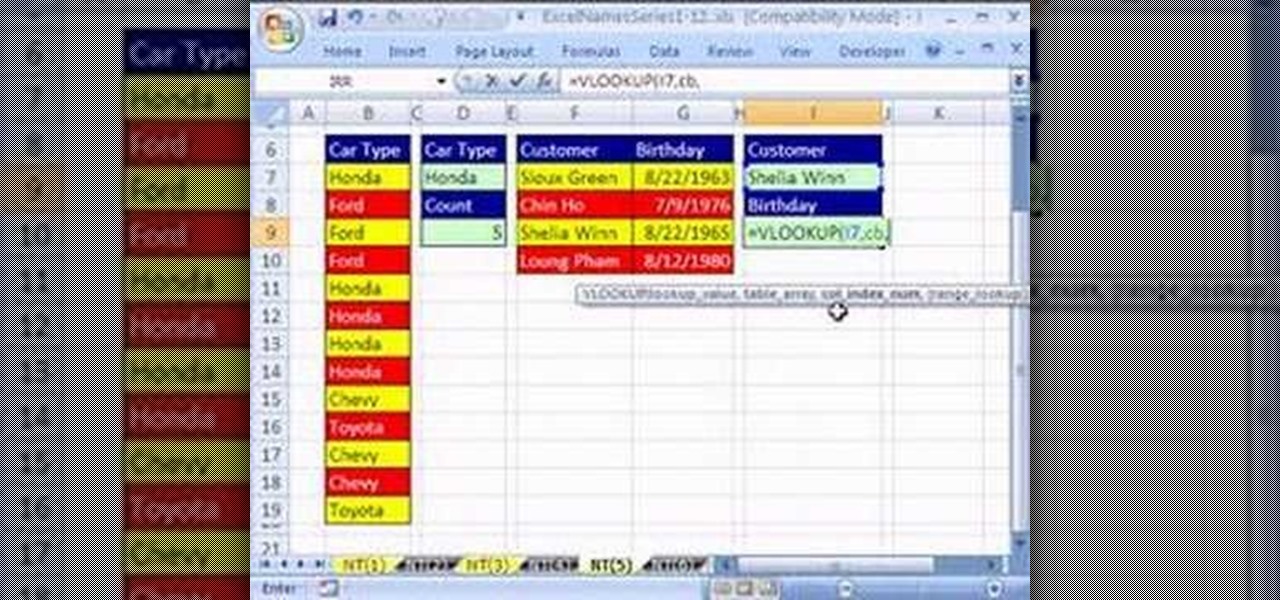
Looking for a primer on how to create and work with names in Microsoft Office Excel? You've come to the right place. In this free video tutorial from everyone's favorite MS Excel guru, YouTube's ExcelIsFun, the 5th installment in his series of Excel name tricks, you'll learn to use names with pivot tables, data validation & the VLOOKUP & COUNTIF functions and formulas.

If you use Microsoft Excel on a regular basis, odds are you work with numbers. Put those numbers to work. Statistical analysis allows you to find patterns, trends and probabilities within your data. In this MS Excel tutorial from everyone's favorite Excel guru, YouTube's ExcelsFun, the 28th installment in his "Excel Statistics" series of free video lessons, you'll learn how to create quantitative data stem & leaf charts using the REPT and COUNTIF functions.
If you use Microsoft Excel on a regular basis, odds are you work with numbers. Put those numbers to work. Statistical analysis allows you to find patterns, trends and probabilities within your data. In this MS Excel tutorial from everyone's favorite Excel guru, YouTube's ExcelsFun, the 13th installment in his "Excel Statistics" series of free video lessons, you'll learn how to create a column chart from a frequency distribution for categorical data.
Love Microsoft Excel? This clip contains a tip that just might induce you to. With this free video tutorial from ExcelIsFun, the 77th installment of his "YouTubers Love Excel" or YTLE series of free video MS Excel lessons, you'll learn how to do a complicated payroll formula when tax data must be retrieved from multiple tables. See how to use the INDEX, INDIRECT AND MATCH functions in one big formula to retrieve tax data from multiple tables on multiple sheets. Learn to love digital spreadshe...
From Ramanujan to calculus co-creator Gottfried Leibniz, many of the world's best and brightest mathematical minds have belonged to autodidacts. And, thanks to the Internet, it's easier than ever to follow in their footsteps. With this installment from Internet pedagogical superstar Salman Khan's series of free math tutorials, you'll learn how to visualize statistical data with a hand-drawn stem-and-leaf chart.
New to Microsoft Excel? Looking for a tip? How about a tip so mind-blowingly useful as to qualify as a magic trick? You're in luck. In this MS Excel tutorial from ExcelIsFun, the 536th installment in their series of digital spreadsheet magic tricks, you'll learn how to list all modes in a given multimodal data set using Excel 2010's MODE.MULT function.
New to Microsoft Excel? Looking for a tip? How about a tip so mind-blowingly useful as to qualify as a magic trick? You're in luck. In this MS Excel tutorial from ExcelIsFun, the 375th installment in their series of digital spreadsheet magic tricks, you'll learn how to copy non-contiguous columns of data and then paste all the columns at once.
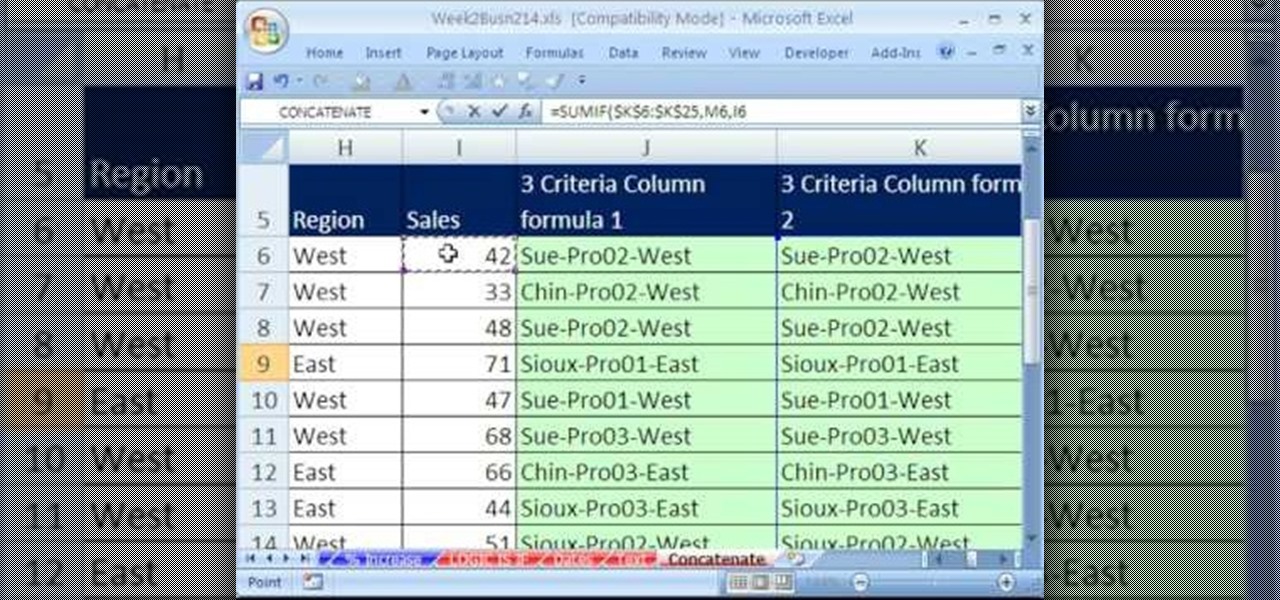
New to Microsoft Excel? Looking for a tip? How about a tip so mind-blowingly useful as to qualify as a magic trick? You're in luck. In this MS Excel tutorial from ExcelIsFun, the 213th installment in their series of digital spreadsheet magic tricks, you'll learn how to create a non-array formula to extract data dynamically using two different methods.
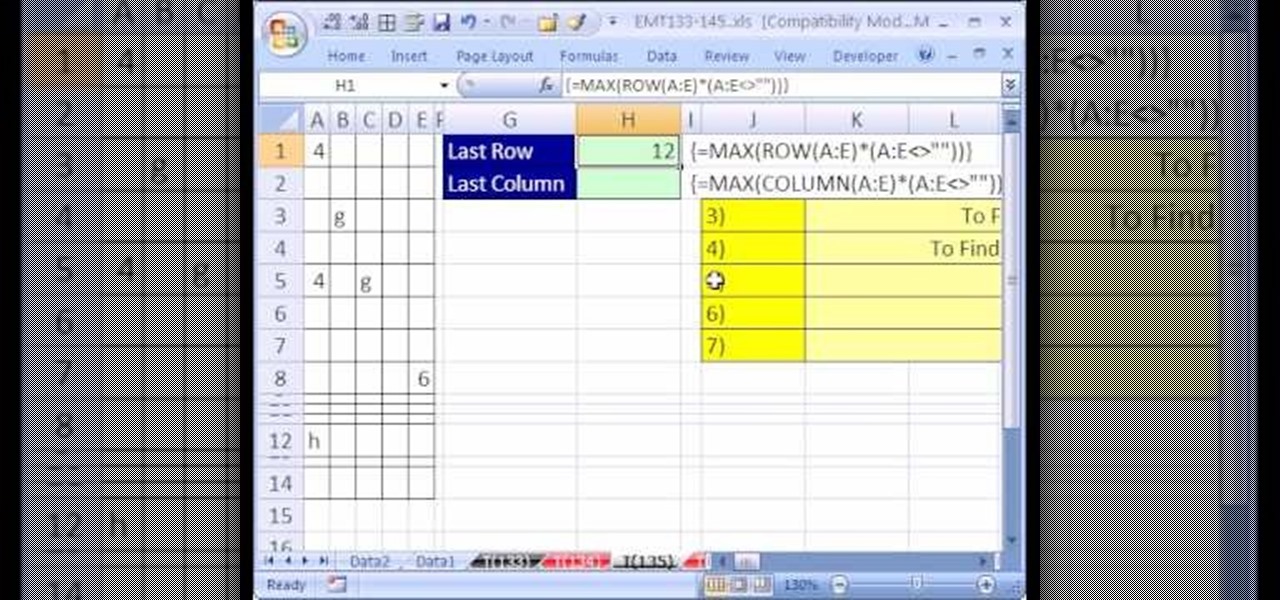
New to Microsoft Excel? Looking for a tip? How about a tip so mind-blowingly useful as to qualify as a magic trick? You're in luck. In this MS Excel tutorial from ExcelIsFun, the 135th installment in their series of digital spreadsheet magic tricks, you'll learn how to create a dynamic range when there are blanks in the data set. Learn also how to use an array formula to find the Last row or column used in a data set.
New to Microsoft Excel? Looking for a tip? How about a tip so mind-blowingly useful as to qualify as a magic trick? You're in luck. In this MS Excel tutorial from ExcelIsFun, the 97th installment in their series of digital spreadsheet magic tricks, you'll learn how to use the AVEDEV function to measure the spread (variation) in a data set. Also see the STDEV function and learn how to measure whether a mean represents its data points fairly.
Selling your old iPhone to make way for the latest generation? Before you get all Ebay happy, make sure to take a quick look at this video, which will demonstrate how to completely erase all data from your iPhone - including your contacts from the SIM card. Your friends will thank you for it.
From Ramanujan to calculus co-creator Gottfried Leibniz, many of the world's best and brightest mathematical minds have belonged to autodidacts. And, thanks to the Internet, it's easier than ever to follow in their footsteps (or just study for that next big test). With this installment from Internet pedagogical superstar Salman Khan's series of free statistics tutorials, you'll learn how to use visualize data by graphing it in a box-and-whisker diagram.
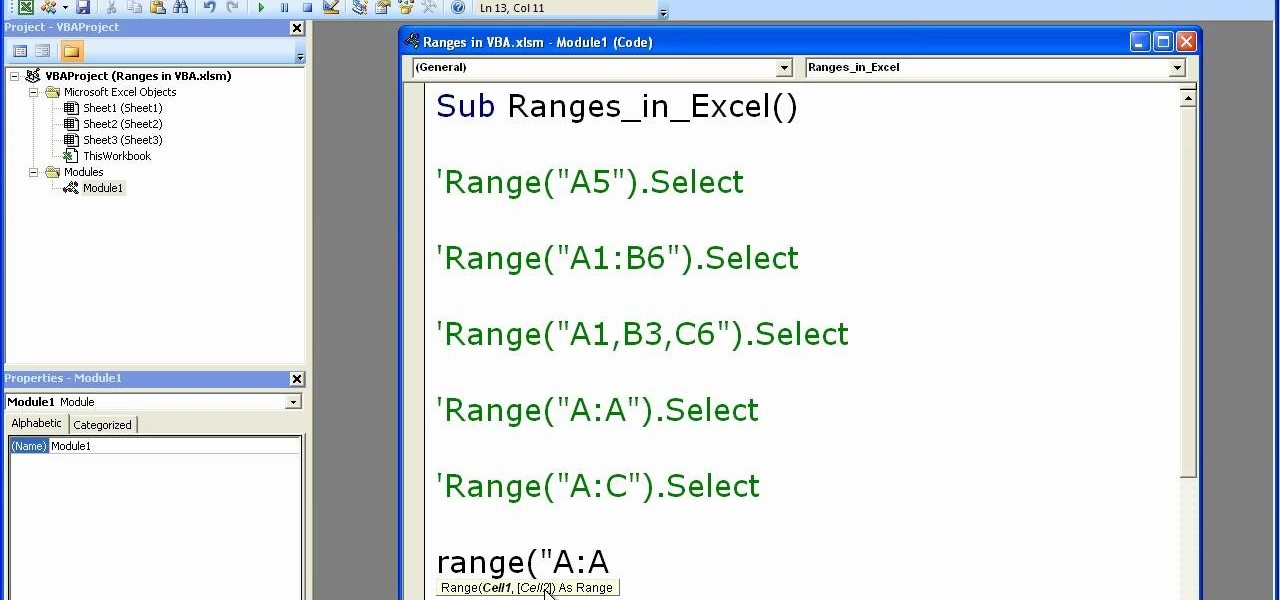
Microsoft excel is a powerful tool used to work with numbers and data by filling them down in rows and columns of a table. Excels also supports macros, which are small scripts to automate certain functions. In Microsoft Excel you can select entire rows and columns using the range property. You can also use macros to select individual rows and columns as well as multiple variations of rows, columns, and individual cells all at once. In Excel a horizontal line of data is called as row and a ver...
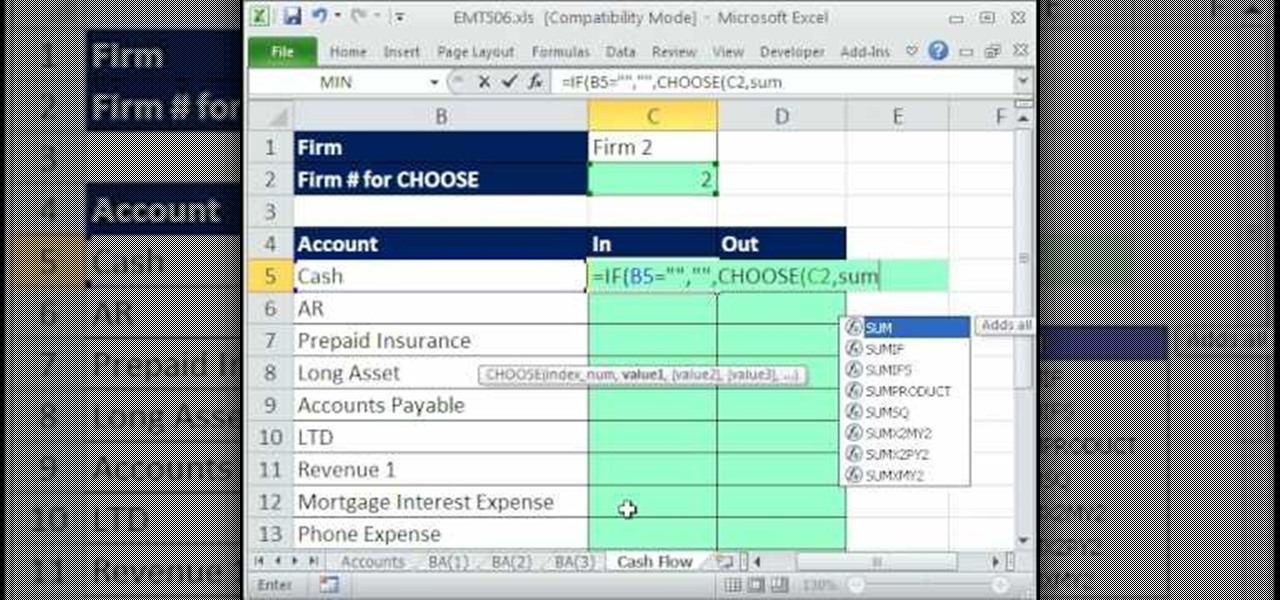
New to Excel? Looking for a tip? How about a tip so mind-blowingly advanced as to qualify as a magic trick? You're in luck. In this Excel tutorial from ExcelIsFun, the 506th installment in their series of digital spreadsheet magic tricks, you'll learn how to summarize data from multiple sheets. For example, you'll see how take checkbook register data from multiple banks accounts and summarize it based on account names.
TrueCrypt is a free application that lets you encrypt designated programs on your Ubuntu system to prevent unwanted access. Provided you select a strong password, intruders will not be able to open your personal files and documents. This instructional video walks you through the process of installing TrueCrypt on your Ubuntu operated machine and demonstrates an example on how to create an encrypted volume within a select partition.
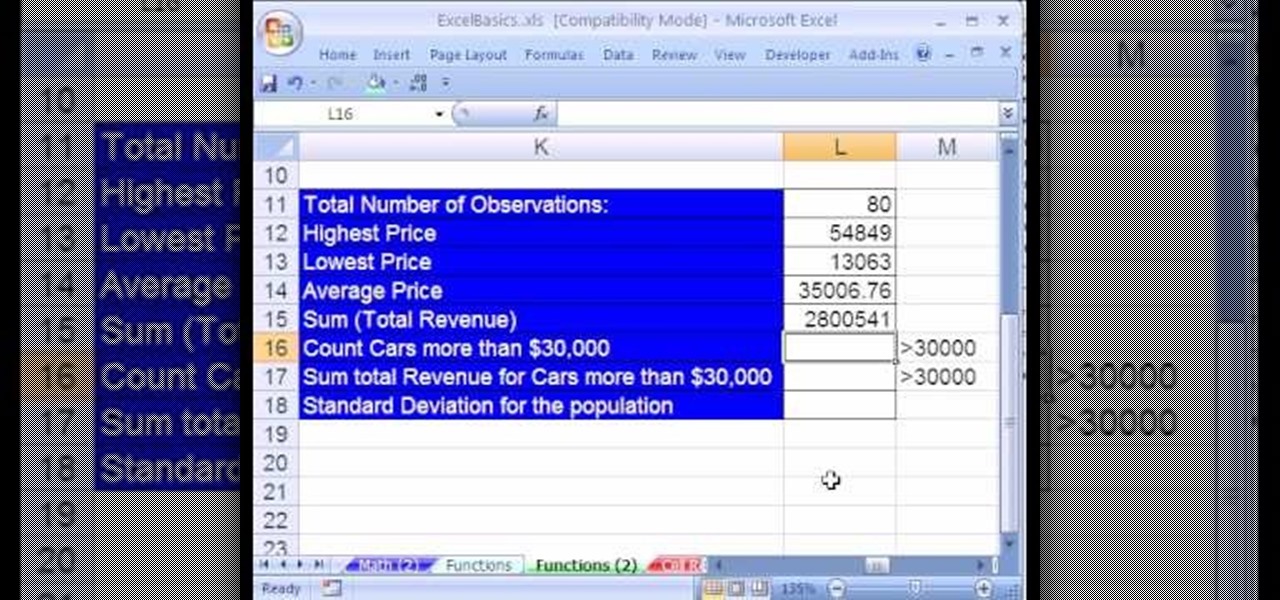
Create a table with sales data with this video.
Devolped by the same team of engineers responsible for LightWave 3D, modo, lowercase, delivers the next evolution of 3D modeling, painting and rendering in a single integrated and accelerated package for the Mac and PC. And now, modo is a true end-to-end solution that includes true 3D sculpting tools, animation and network rendering! More than just features, modo is a truly elegant integration of technology, raw horsepower and refined workflow. With such a wealth of inbuilt features, however,...
You may have lost your files but you needn't loose hope, too. In this episode of Lab Rats TV, Andy and Sean show you how to recover your deleted data (and your marriage!) using oranges. For detailed instructions on recovering your own lost data, take a look at this tech how-to.
Have sensitive data that you want to make sure you securely delete? Or maybe you're getting an external drive ready to recycle or to give to a colleague. In this video tutorial, you'll find instructions for securely emptying your trash and also securely delete the contents of an external hard drive. For more, and to learn how to remove data from your Mac computer securely, watch this video tutorial from Apple.
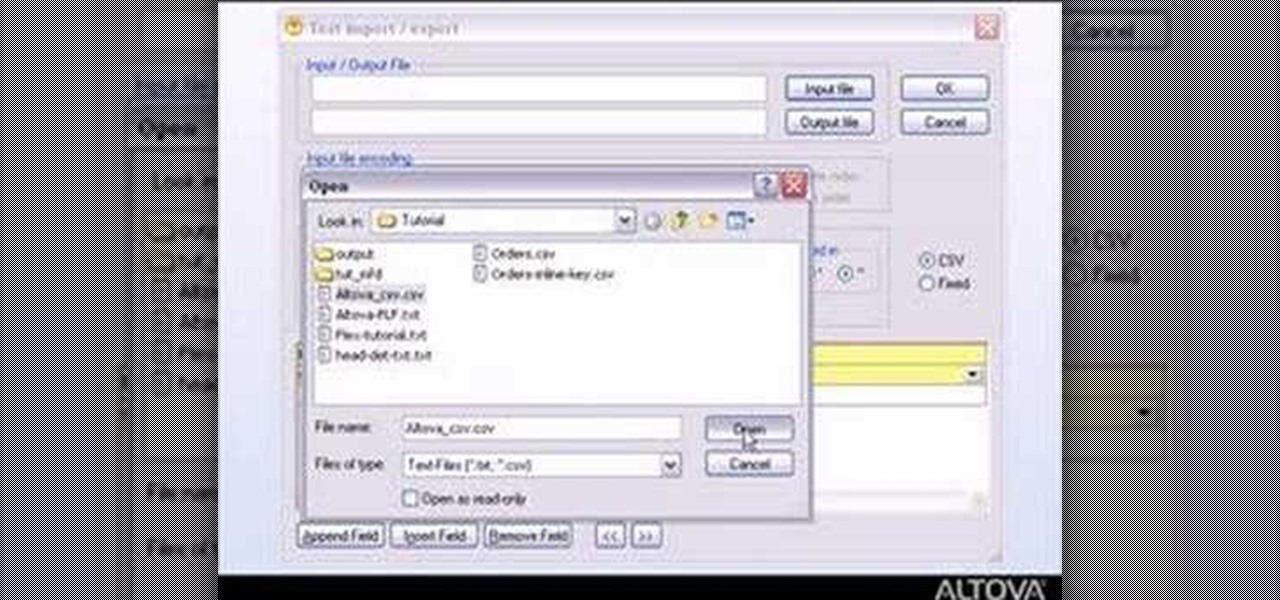
MapForce supports flat files as the source and/or target of any mapping involving XML, database, EDI, web services or other flat file data. In this how-to, you'll find instructions for mapping data from arbitrary text files (such as log files, CSV, fixed-width, and other legacy data sources) to databases and XML files.
MapForce includes support for the two most popular EDI formats, UN/EDIFACT and ANSI X12. In this how-to video, you'll learn how to use MapForce to map and convert data between EDI messages (X12 and UN/EDIFACT) and XML, databases, or text files. Learn to map EDI data with this how-to.
If you're new to DreamCoder for MySQL, one of the first things you may want to know how to do is export data from a remote MySQL database. Happily, this tutorial will walk you, step by step, through the process. To get started exporting MySQL data with DreamCoder, take a look!
In this Linux tutorial, you'll learn how to write data to, and retrieve data from, optical discs like CD-ROMs and DVDs as well as how to write .iso disk image files. Get started burning your own media under the Linux Mint desktop distrubtion with this how-to.
See how to use CSS and JavaScript to visually design style sheets for publishing XML and database data in Altova StyleVision, a visual style sheet designer for rendering XML and relational data in multiple formats. In this video, you'll learn more about how StylevVision interfaces with CSS and JavaScript.
Your iPhone tracks how many steps you take, how far you walk, and how many stairs you climb each day. That may seem a bit frightening, but it's all for a good reason: the Health app stores this data so you can view your progress in one place. But interestingly, opening the Health app isn't the easiest way to view this info.
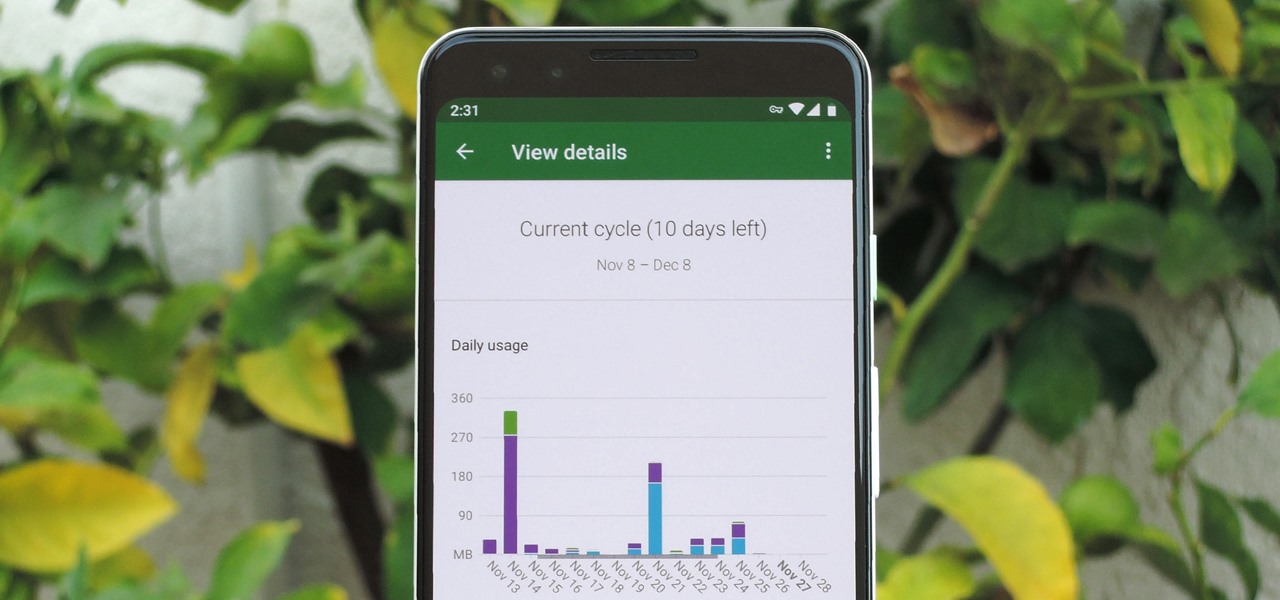
In case you hadn't heard, Google is now a legit cell service provider. Google Fi has its pluses and minuses, but the biggest upside is in the pricing. Depending on how much data you typically use, there's a good chance you could save a lot of money without sacrificing coverage by switching to Fi.
Personal data is a hot topic right now, and for good reason. Never before has the public been so on edge about how companies use their information. Services like Facebook and Google now allow you to download all of the data each has on file. Soon, you'll be able to see exactly the same for Apple as well.
So much information exists online that it's easy to get lost in data while researching. Understanding the bigger picture can take a lot of time and energy, but narrowing the question to one that's easy to answer is the first step of any investigation. That's why analysts use open-source intelligence (OSINT) tools like Maltego — to help refine raw data into a complete understanding of a situation.
Thanks to their partnership with Tidal, over 30 million Sprint customers can access Hi-Fi audio on the go. And the Jay-Z-owned music service isn't limited to just Sprint customers — for $19.99/month, anyone can listen to lossless audio from their favorite artists. But streaming uncompressed audio files uses a lot more data than standard quality, so how do you use Tidal without hitting your data cap?
When you're on the go, Plex makes sure your media always stays with you. Just install the server app for Mac or PC and enable remote access, then you can stream movies and TV shows from your computer to your phone over the internet.
It seems almost every carrier now has an unlimited data plan, and free Wi-Fi is now available in more places than ever before. If you want to be connected, it has never been easier — but that still doesn't mean that everyone can stream as much as they please.
If you're an Android user, Google probably has almost your entire digital life stored on its servers. Family pictures are backed up on Google Photos, your e-book library resides with Google Play Books, videos are on YouTube, chat logs in Gmail and Hangouts, starred places and location history in Google Maps, and so much more.
Data visualization has many applications in virtual and mixed reality, since a third dimension literally adds important depth to the represented information. A new app called HoloFlight is a good example of this, combining flight-tracking data and the Microsoft HoloLens to surround you with a look at every plane in the sky.
Our future technology has a lot of amazing possibilities, and few have more promise than augmented and mixed reality headsets. But these advancements come with several concerns over privacy, and if we don't understand them, we may lose control of our own data without even knowing.
I'm lucky enough to have internet access on my laptop practically everywhere I go because of my mobile hotspot plan. All I have to do is enable the personal hotspot feature from my iPhone and I can surf the web on any Wi-Fi enabled device. But of course, there's a catch.