How to Criar Action: Cortar Pattern Swatch
Dicas de como criar ations para illustrator. Neste video: Criando action para cortar pattern e clippingMask.


Dicas de como criar ations para illustrator. Neste video: Criando action para cortar pattern e clippingMask.

NextReality will be giving readers a rundown of the augmented and mixed reality news briefs from the preceding week that we didn't cover already. This way, you'll never miss anything of importance in the NextReality landscape, and will always know what's going on with new augmented and mixed reality tech and applications. The first one starts right now, and you can enjoy future ones every Tuesday going forward, so stay tuned.

This tutorial on the companion Tech Ease for Mac site shows you how to use Inspiredata to collect, organize, and visualize data using several types of diagrams supported by the program. The movies were recorded on a Mac, but Inspiredata is a cross-platform program so the steps shown should work on the Windows version of the program as well. Inspiredata works like a database system that allows you to add notes and more.
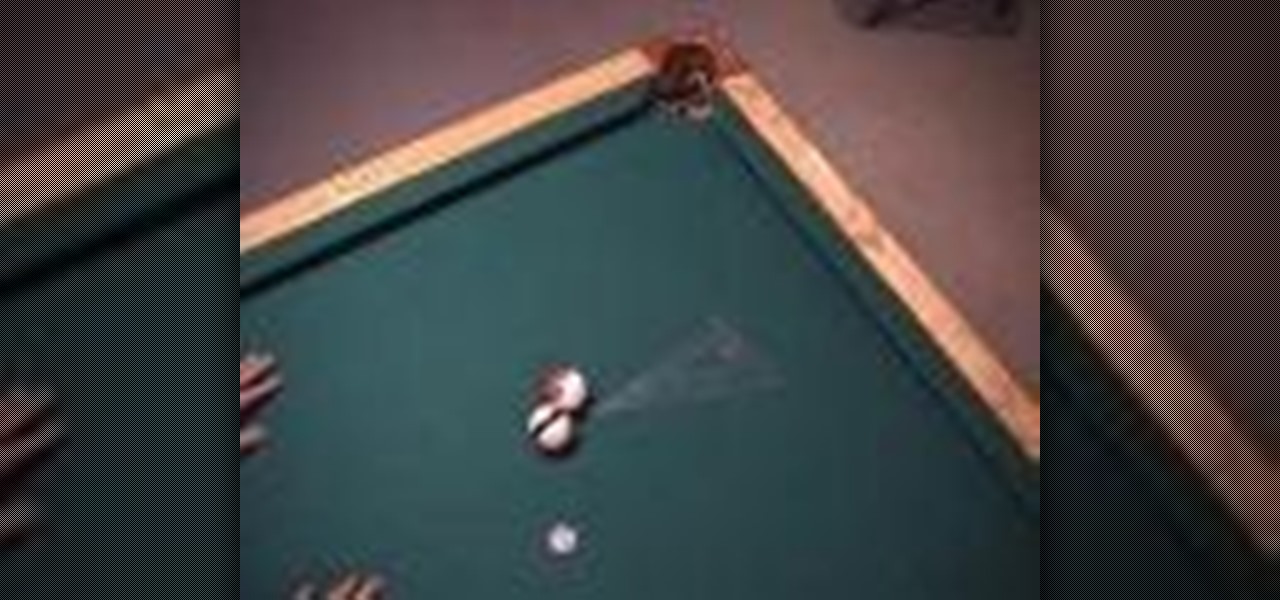
Similar to the 90 degree rule, the 30 degree rule is demonstrated in this video. Your two forefingers in a V-shape are the best tools to use for visualizing this angle.
Interested in chakras? Boost the seven energy centers from the base of your spine to the top of your head for optimum health and vitality. Learn how to awaken chakras with help from this video.

Hypnotizing yourself may seem like a magic trick, but is actually a great way to manage your stress or change a habit.
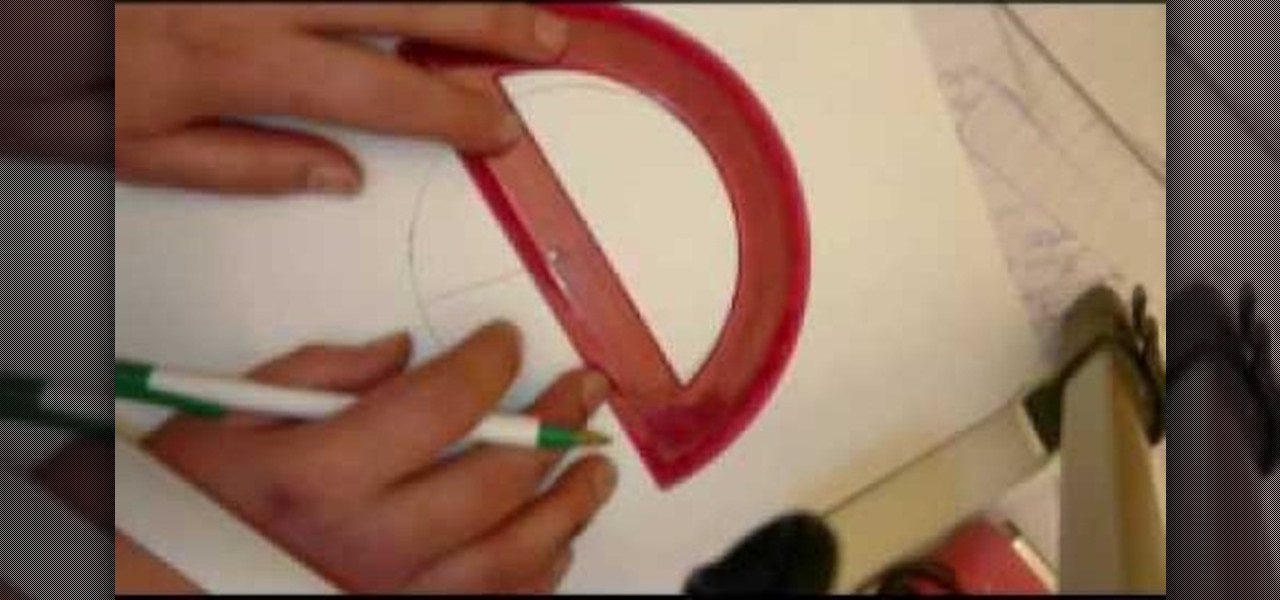
If you have a circular or semicircular protractor like the one used in this video, making a pie chart is as easy as – well — pie. This will teach you how to use your protractor to measure out each individual slice in your pie chart. Learn how to visualize statistical data through hand-drawn pie charts with this free video math lesson.
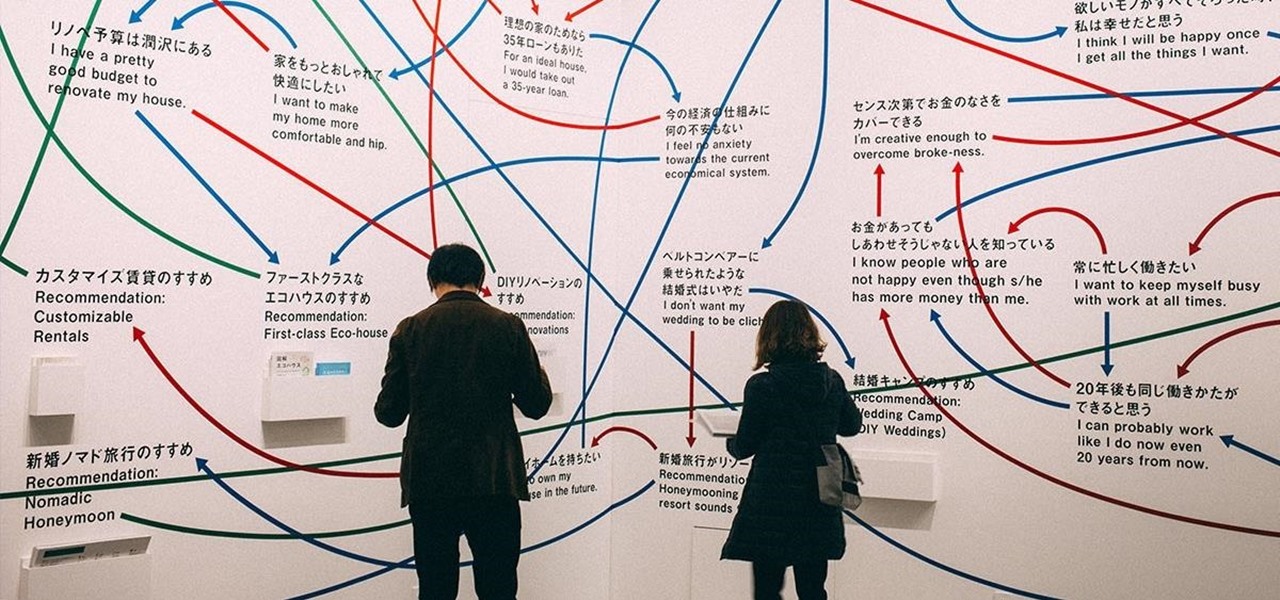
Do you ever feel as if your mind is running away from you? What if you could map out all of those thoughts into a coherent map that helps you make sense of your reality? Well, now you can.

This video is about how to use visualization to get a girlfriend. First, you have to wake up visualizing her. This will help you believe that you are capable of finding a girlfriend. Then you make a "My Girl" list. On this list, write down the qualities you would like to see in your future girlfriend. Next you imagine the qualities that your future girlfriend expects of a man. Slowly develop yourself into this guy. After your mind adapts itself to thinking these thoughts, you will find your i...

Although all signs points to Microsoft releasing a new HoloLens in the coming days, the company is nevertheless looking to distribute its augmented reality apps to other operating systems.

We've already taught you how to clench your fist to make healthier food choices, and how to make sure you eat healthily at a restaurant, but it turns out there are even more mind hacks we can use in our never-ending quest to control our appetites.
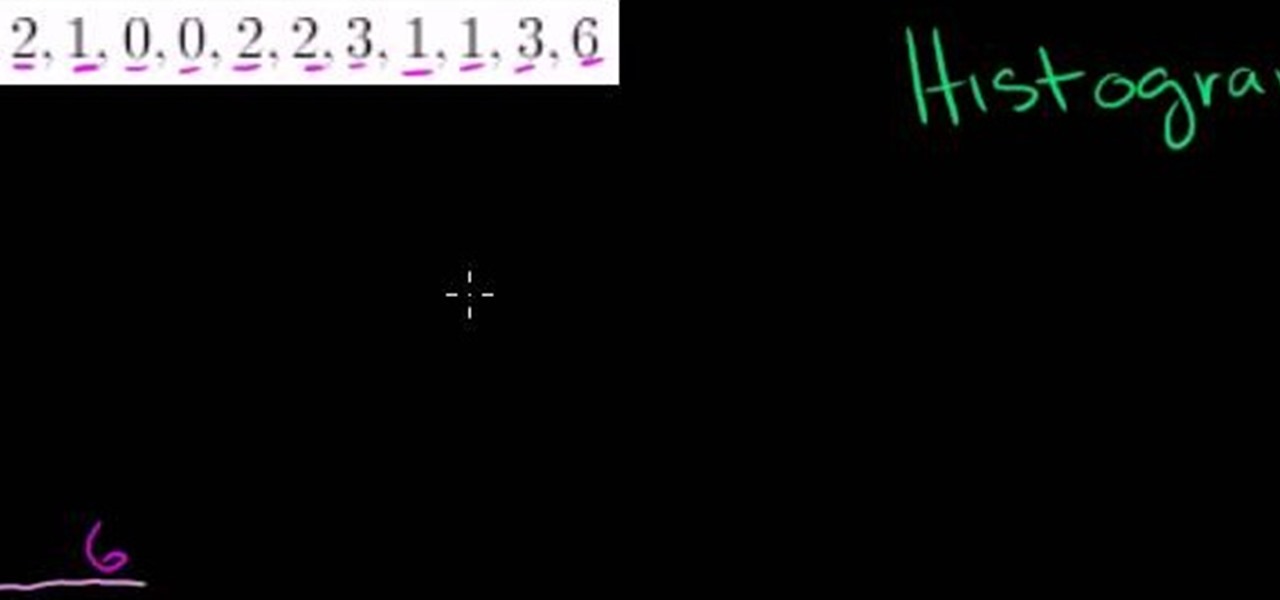
From Ramanujan to calculus co-creator Gottfried Leibniz, many of the world's best and brightest mathematical minds have belonged to autodidacts. And, thanks to the Internet, it's easier than ever to follow in their footsteps (or just study for that next big test). With this installment from Internet pedagogical superstar Salman Khan's series of free math tutorials, you'll learn how to create a simple histogram chart.
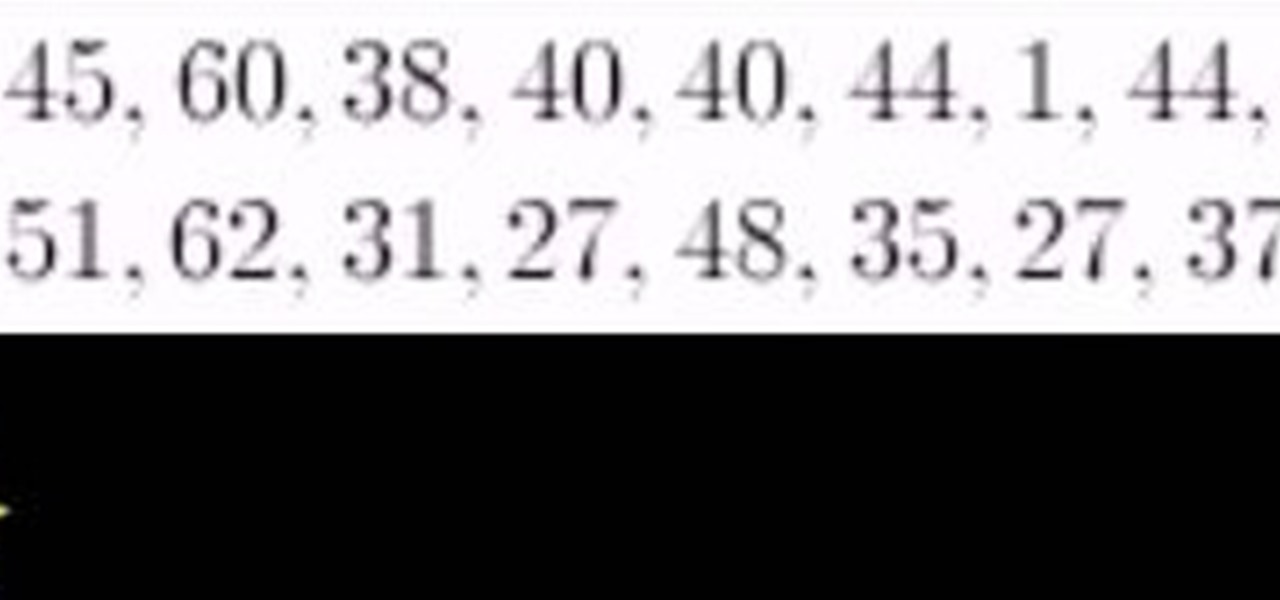
From Ramanujan to calculus co-creator Gottfried Leibniz, many of the world's best and brightest mathematical minds have belonged to autodidacts. And, thanks to the Internet, it's easier than ever to follow in their footsteps. With this installment from Internet pedagogical superstar Salman Khan's series of free math tutorials, you'll learn how to visualize statistical data with a hand-drawn stem-and-leaf chart.
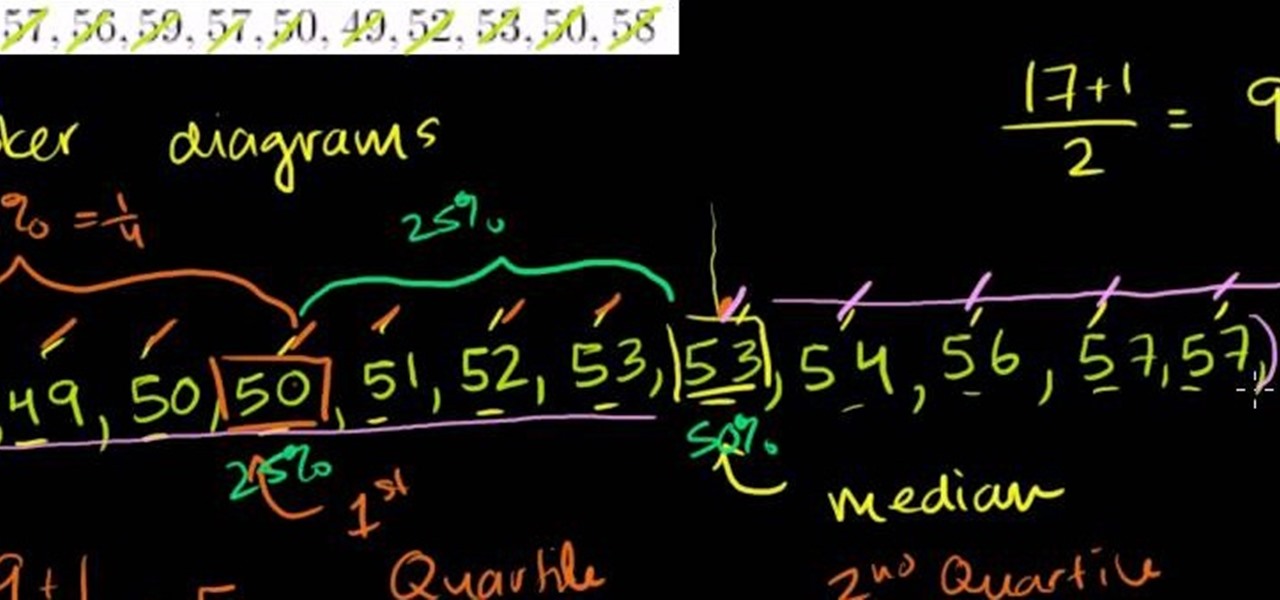
From Ramanujan to calculus co-creator Gottfried Leibniz, many of the world's best and brightest mathematical minds have belonged to autodidacts. And, thanks to the Internet, it's easier than ever to follow in their footsteps (or just study for that next big test). With this installment from Internet pedagogical superstar Salman Khan's series of free statistics tutorials, you'll learn how to use visualize data by graphing it in a box-and-whisker diagram.
Mike Tadros demonstrates some useful techniques for incorporating the Space Navigator by 3D Connexion into your Google SketchUp workflow. Create smooth animations, pre-visualize motion graphics sequences, and even create a Star Wars flight simulation. All possible with the Space Navigator for SketchUp 6.

In this video tutorial, we learn how to use the Graph Your Inbox! extension for the Google Chrome web browser to visualize Gmail usage over time. For all of the details, and to get started using Graph Your Inbox! yourself, watch this home-computing how-to from Tekzilla.
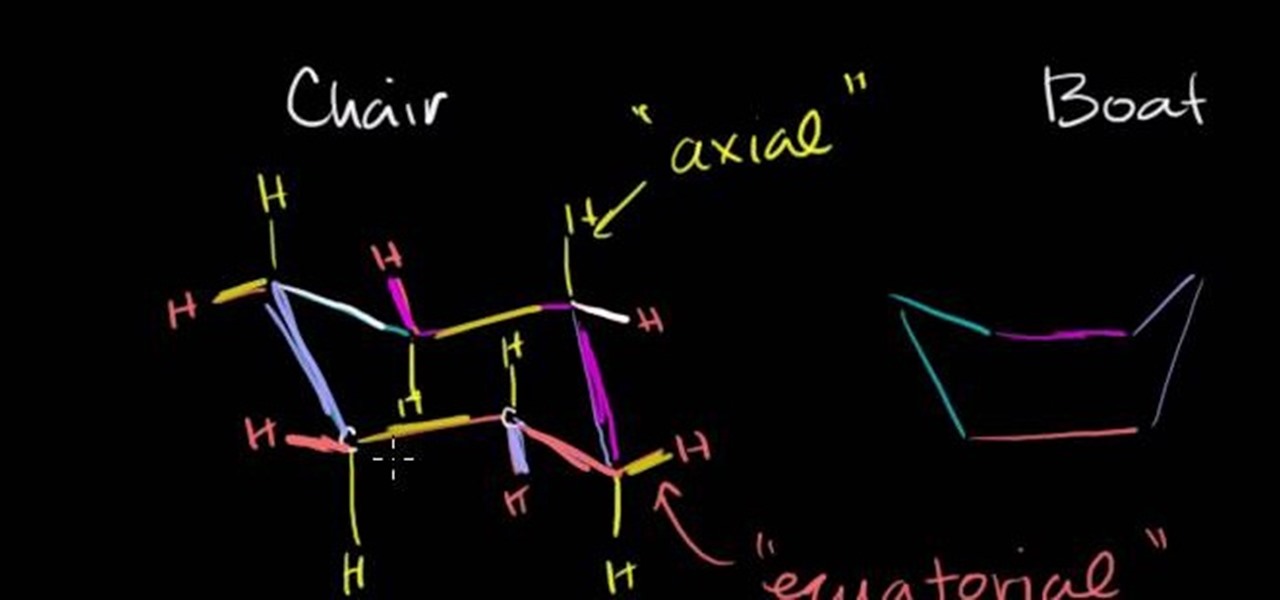
In this free video science lesson from Internet pedagogical superstar Salman Khan, you'll learn how to represent and interpret cyclohexane molecules in organic chemistry. Whether you need help studying for that next big test or could just use a hand finishing your homework, you're sure to be well served by this video lesson. For more information, including detailed, step-by-step instructions, take a look.

Interested in turning the comings and goings of your cursor into modern art? It's easy! So easy, in fact, that this home-computing how-to from the folks at TekZilla can present a complete overview of the process in just two minutes. For more information, including step-by-step instructions, take a look.

Starting a film? A storyboard is a great way to visualize a motion picture or animation through a series of illustrations or images displayed in sequence. Learn how to go about creating a storyboard in pre-production with help from this free video from EOS Lighting.
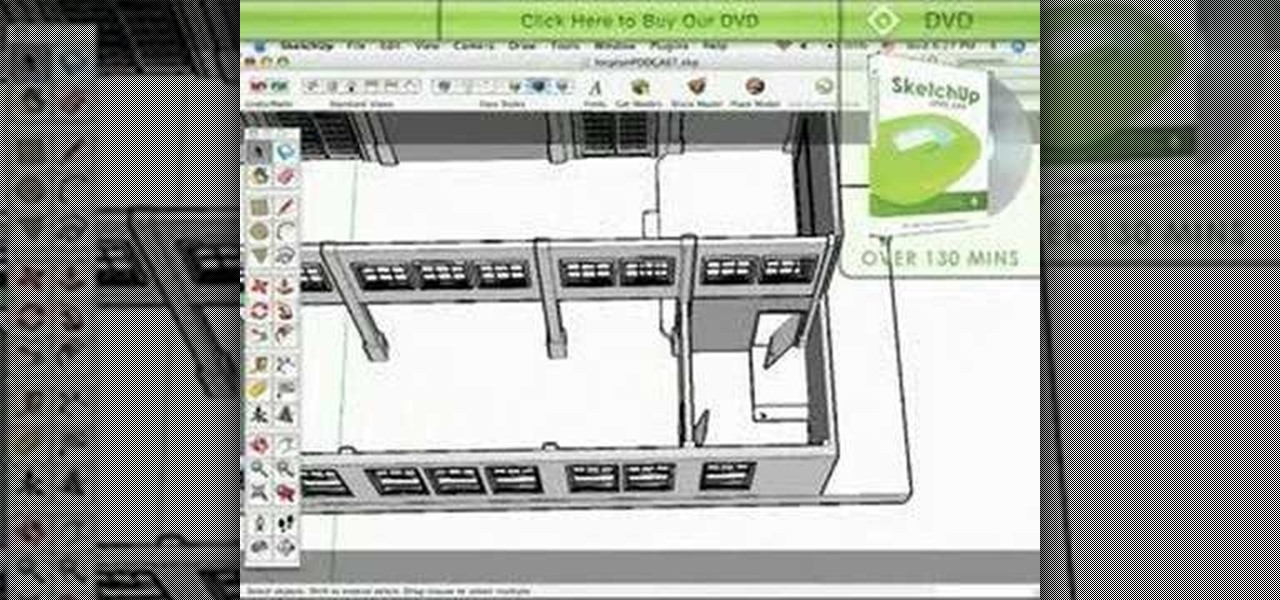
Alex Oliver demonstrates how Art Directors and Cinematographers can use the Film & Stage plugin in SketchUp to explore the use of different camera lenses and aspect ratios on location or on a production set. The Film and Stage plug-in is a great way for film makers and directors to pre-visualize shots and scenes in SketchUp, a software you may only have thought useful for architecture and product pre-visualization. Learn how to plan shots and do animatics in this SketchUp tutorial.
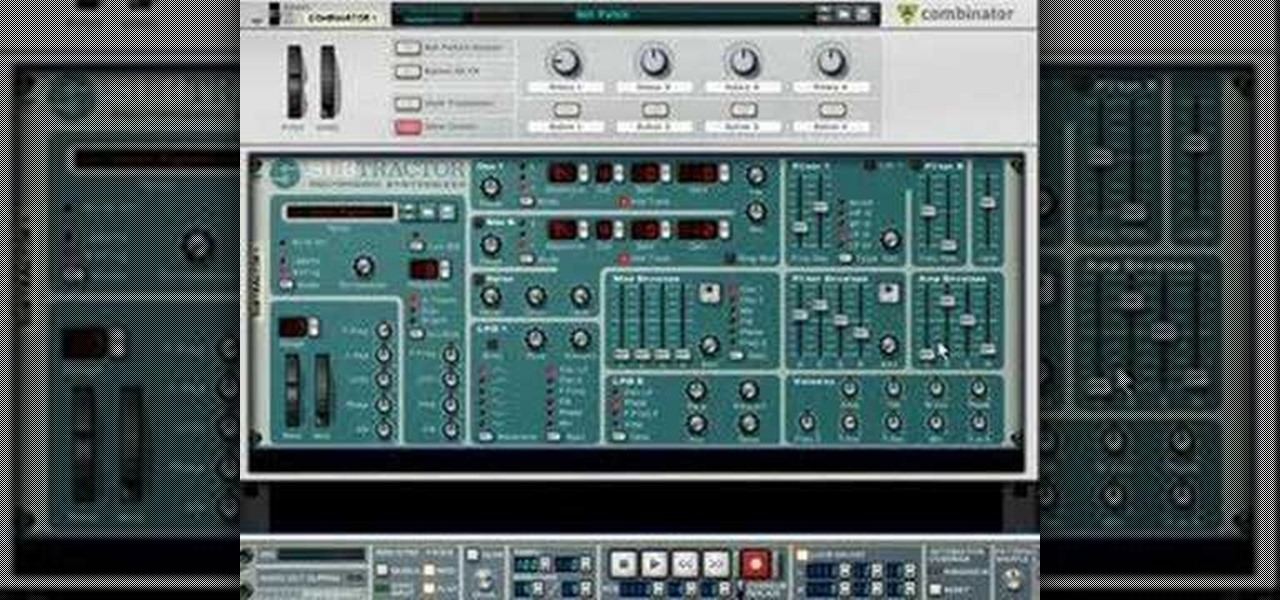
In this music production software tutorial you will learn a quick Reason trick - how to actually "See" the effect of your filter or mod envelopes in real time. This visualization trick works with any Reason instrument. Set it up and watch it move each time you press a key inf a filter or mod envelope effect.
In this video, US Memory Champion Chester Santos teaches you how to expand and improve your memory by using a few simple techniques. Word visualizing allows you to create associations which help to remember individual words. Memory can be increased in a fun and easy way by taking advantage of Santos' cool and unique method of associative thinking. You will hopefully never forget your shopping list again!
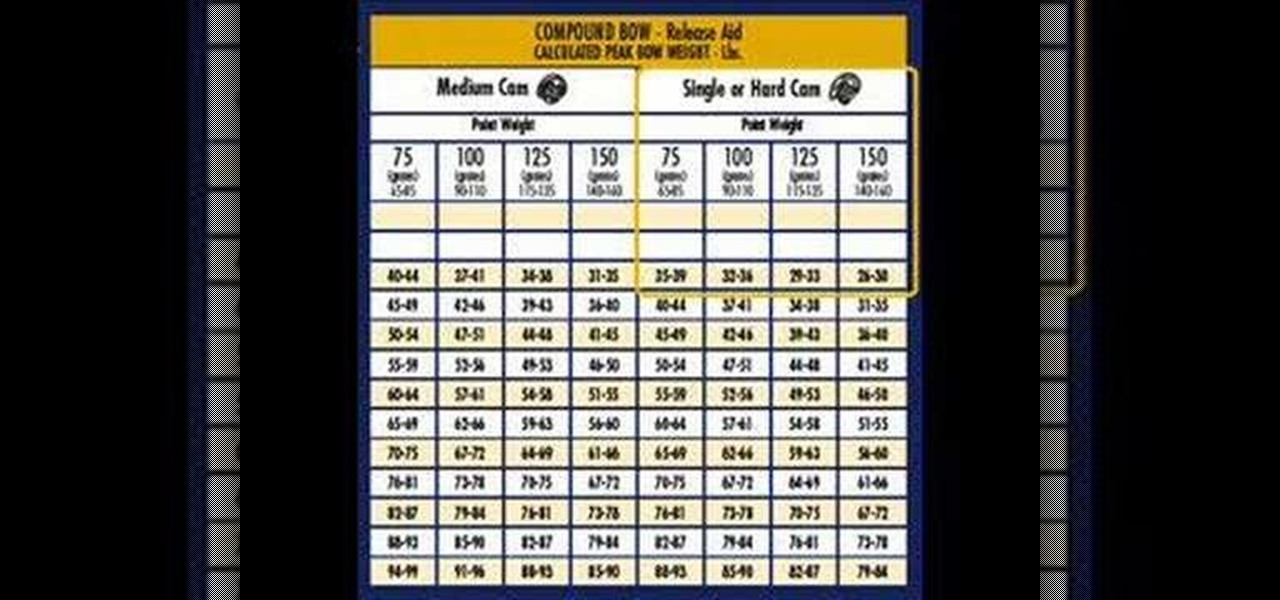
This is a short archery video that attempts to explain why arrow application charts are so complicated. The first three minutes or so present a model of a shaft to help visualize the independent factors that drive each section of the chart.
Oscilloscopes visualize electronic signals. This information can be useful for tests, debugging, and reverse engineering. If you work with electronic circuitry, being able to use an oscilloscope is a must have skill. Here Bre Pettis and Make Magazine hook you up with great tips.
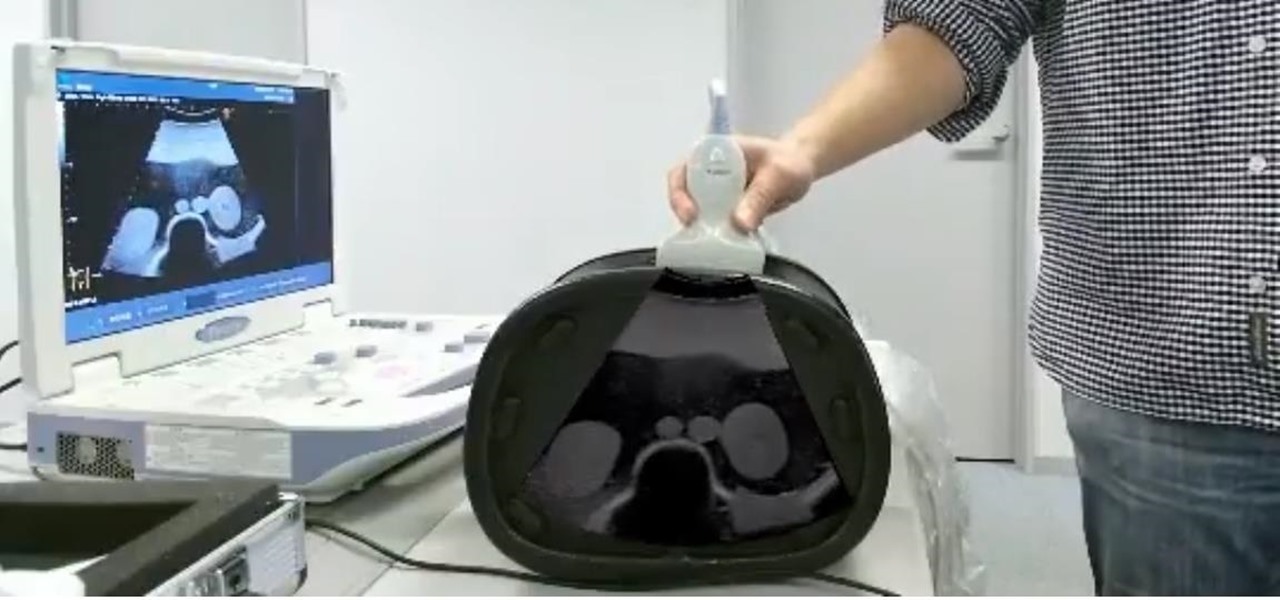
Seeing your baby for the first time via ultrasound is an exciting moment for new parents, but a new augmented reality twist on the experience could make the experience even more powerful.
The new Pyro FX in Houdini 10 are very impressive with improved workflow. The Pyro FX are great for creating 3D fire and smoke effects. And in this video tutorial series, you will learn the Pyro FX workflow in-depth and the parameters used to create fire and smoke effects. You will also see how volumetric data is created and recorded, and how to visualize it.
Awakening the sixth chakra – known as the third eye – also awakens your sixth sense, and unlocks psychic potential. In this tutorial, learn how to harness your spirituality and get in touch with your third eye.
Are you much for science? Cytoplasm. Nucleus. Endoplasmic reticulum. Organelle. These words might sound alien, but breaking down the parts of a cell and their functions will help you remember. This is one of the best ways for cell identification, and it's perfect for science class studying.
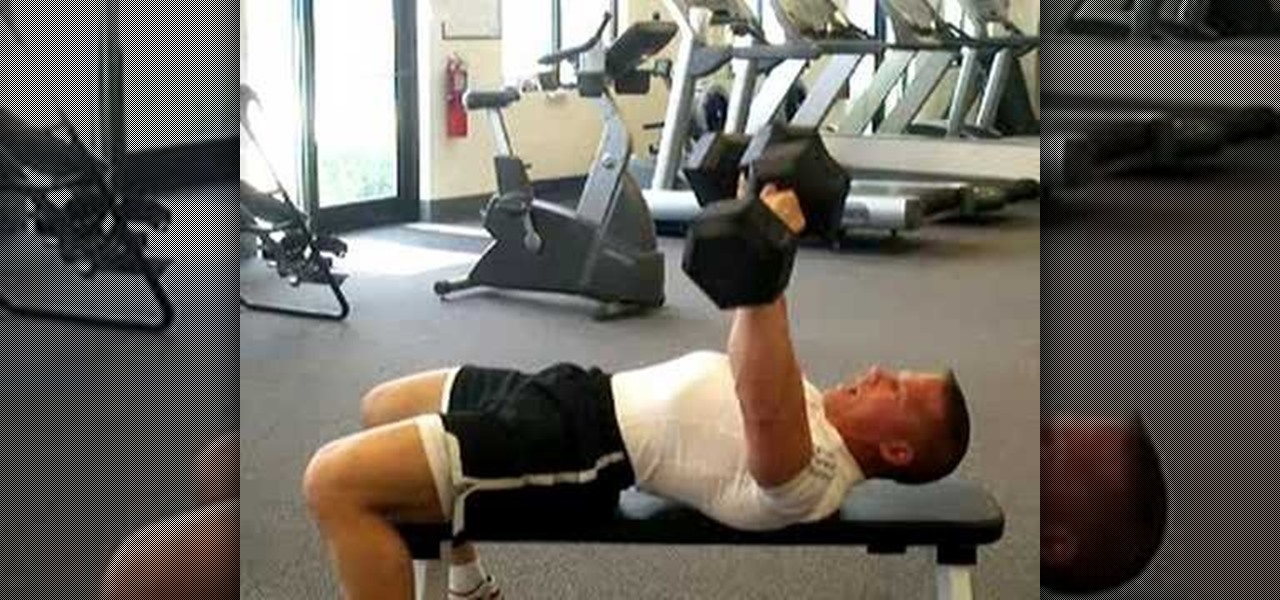
If you're tired of getting sand kicked in your face at the beach because of your tiny chest muscles then the dumbell press exercise is for you. This professional tutorial demonstrates the simple workout that can build up your pectoral muscles in a healthy manner. The dumbell bench press is an awesome functional, athletic movement for you athletes. You will work the target muscle better by visualizing the target muscle. Go slow (a 3-1-3 tempo), and visualize that you are squeezing water out of...
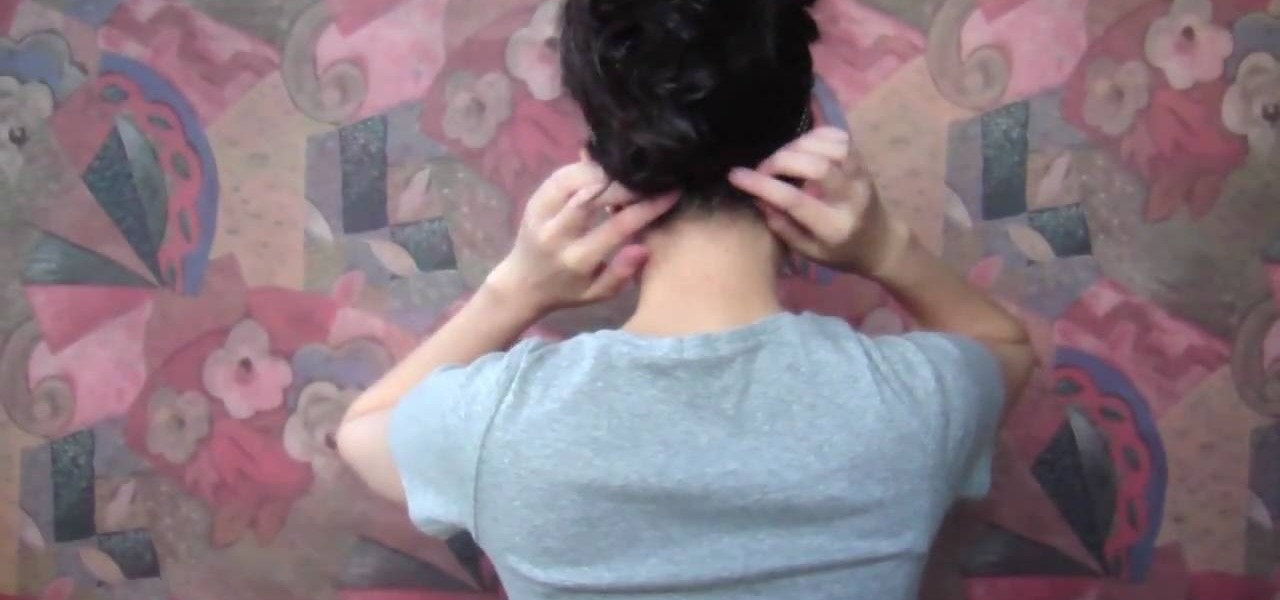
This hair tutorial is called a wispy bird's nest after its, well, wispy quality and organized jumble of hair strands that forms into a cohesive whole.
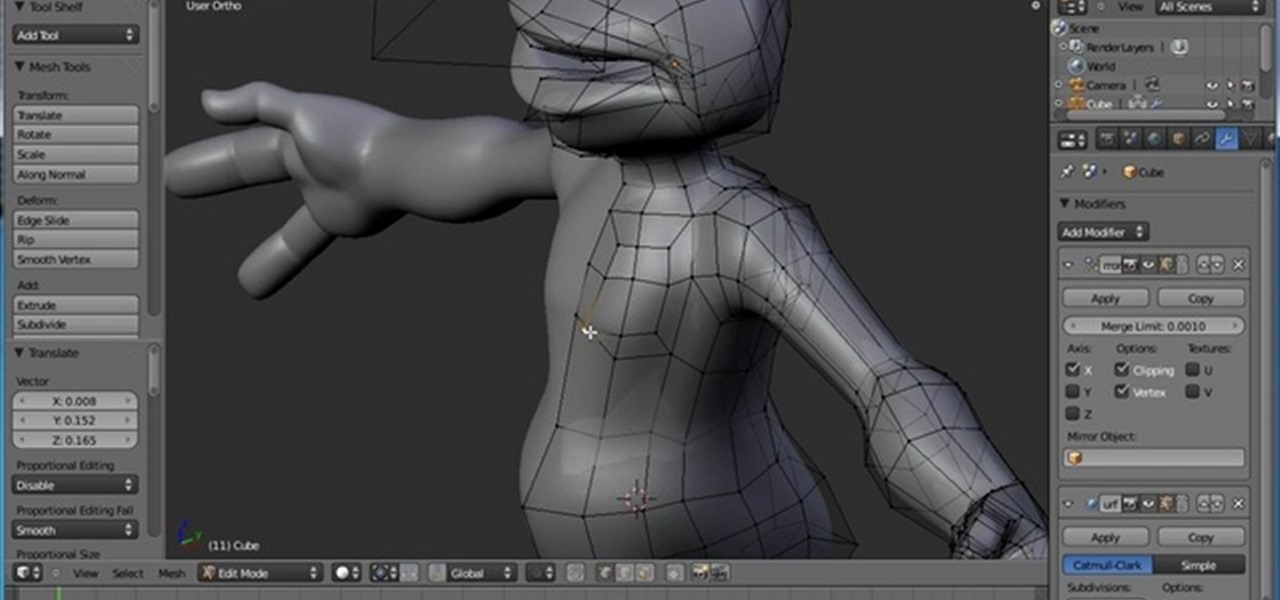
This clip demonstrates how to use the box-modeling technique to create a full character. The box-modeling technique is a good way to quickly visualize the shape of your character, rather than a creating the detail from the beginning. Whether you're new to the Blender Foundation's popular open-source 3D computer graphics application or are a seasoned digital artist merely on the lookout for new tips and tricks, you're sure to be well served by this free video software tutorial from the folks a...
One of the problems with the default history viewer built into Firefox is the unappealing and hard-to-find interface. If you're looking for a better way to organize your browser history, check out History Tree.
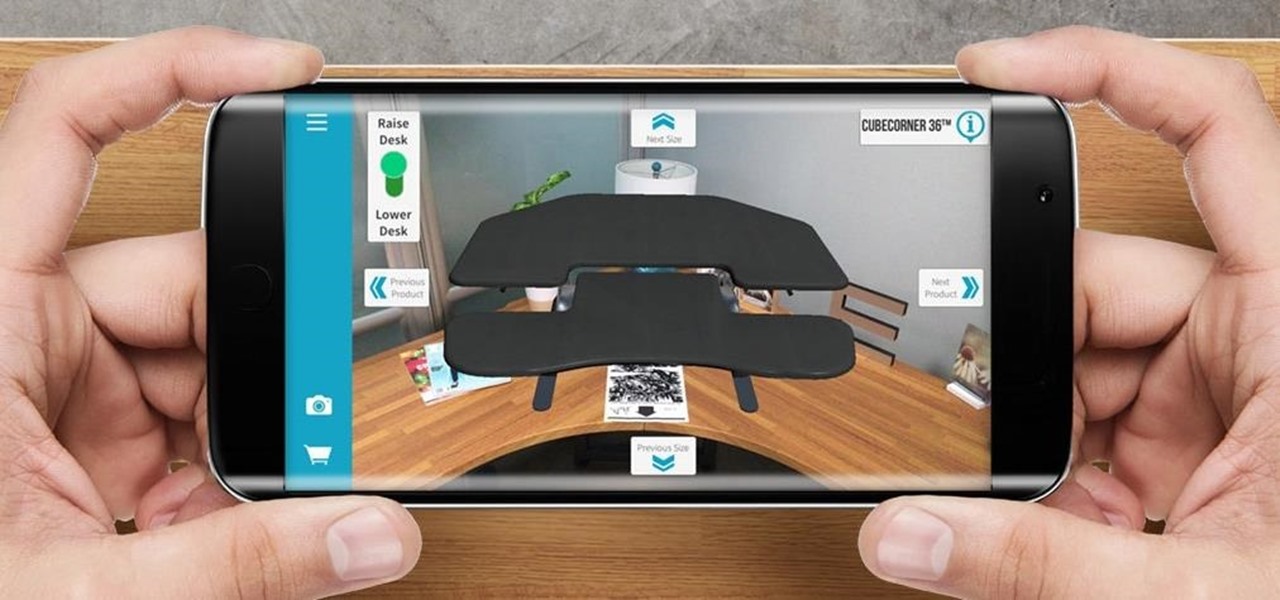
The standing desk movement has gained momentum over the past few years as research has pointed to the detrimental health effects of sitting at a desk all day.
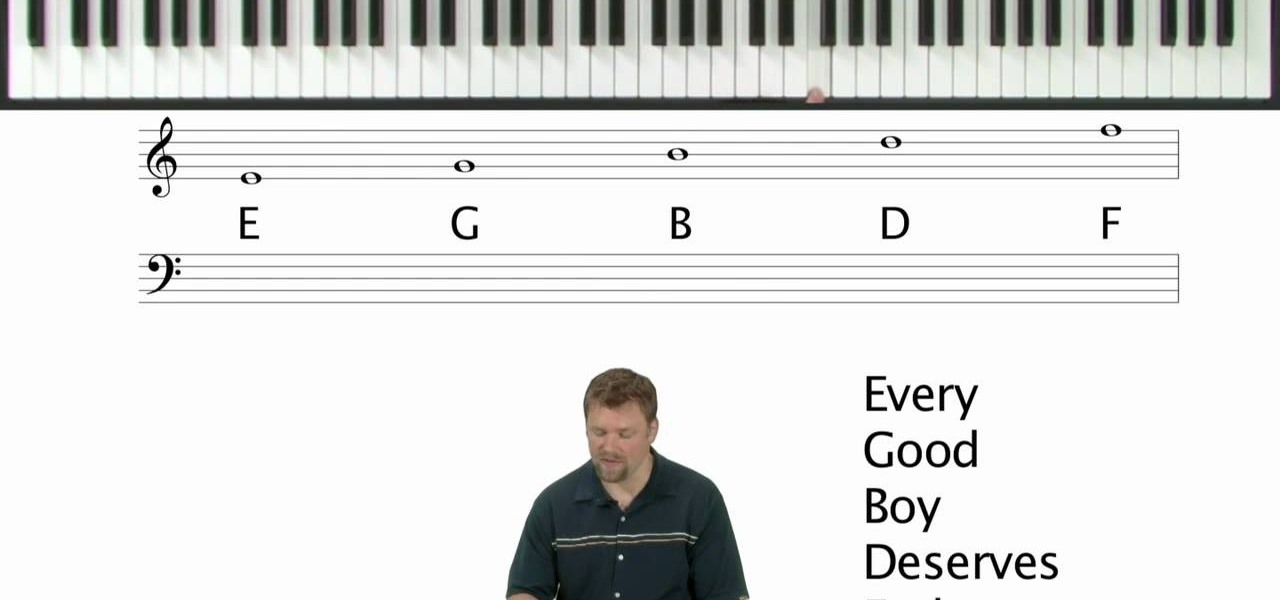
In this tutorial, we learn how to start reading sheet music for the piano. To be able to read the notes, you need to visualize what you are doing on the piano. A good starting point is the middle C on the keyboard. For a piano, you have horizontal lines in two sets on the sheet of paper. These lines are called "staffs" and the vertical lines are the "bar lines". The sections are called "measures". The top of those staffs is all the notes above the middle c. The bottom is all the notes below m...

Khanacademy teaches us how to handle simple inequalities (less than or more than). In an equation, we usually have one solution. In problems involving inequalities, there is a whole set of answers. For instance, x minus five is less than 35. The answer for x is a whole series of numbers that when five is taken away from it, is less than 35. This equation is handled like any other equation involving an equal sign. We add five on both sides of the equation and the answer for x is any number tha...

Get your straight bar and the weight that you are use to. Get the technique down before you add a bunch of weight. With the straight bar in front of you bend over and grab the bar with your hands. A narrow grab, much closer then you are use to. As you raise the bar up to your chin, visualize that you are bending the bar. The movement is as if you were scooping water up to your mouth. As your hands come up think of the pinky side of the hand coming up to your nose. Also as you do this squeeze ...

This video solves the problem of getting the right crate for your puppy. You should visualize the size of your puppy after six months and get a crate of that size. If you have a mature dog, get a crate in which the dog can move and turn around easily. The presenter recommends a plastic crate. It is designed well. The door can be opened in both directions. The top can be removed easily and there are holes for the air to come inside. The wire cage is not recommended. Its door is fixed and the c...
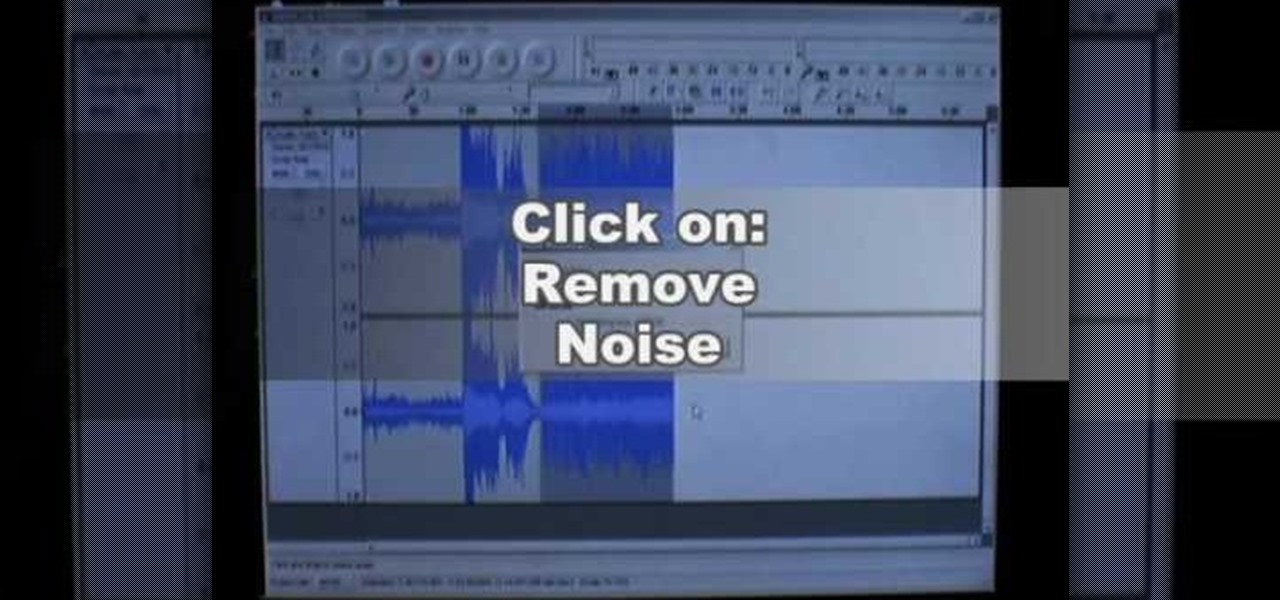
The video is about the process required to remove vinyl record noise. You should have audacity programmed software installed in your computer. First clean the records as best as possible. The noise between the songs are first visualized, then go to the selection tool and press noise removal. The portion depicting the noise is enlarged to view clearly their removal. The portion between the songs is chosen and noise removal is selected and pressed. You can put in your pre-recorded songs in this...
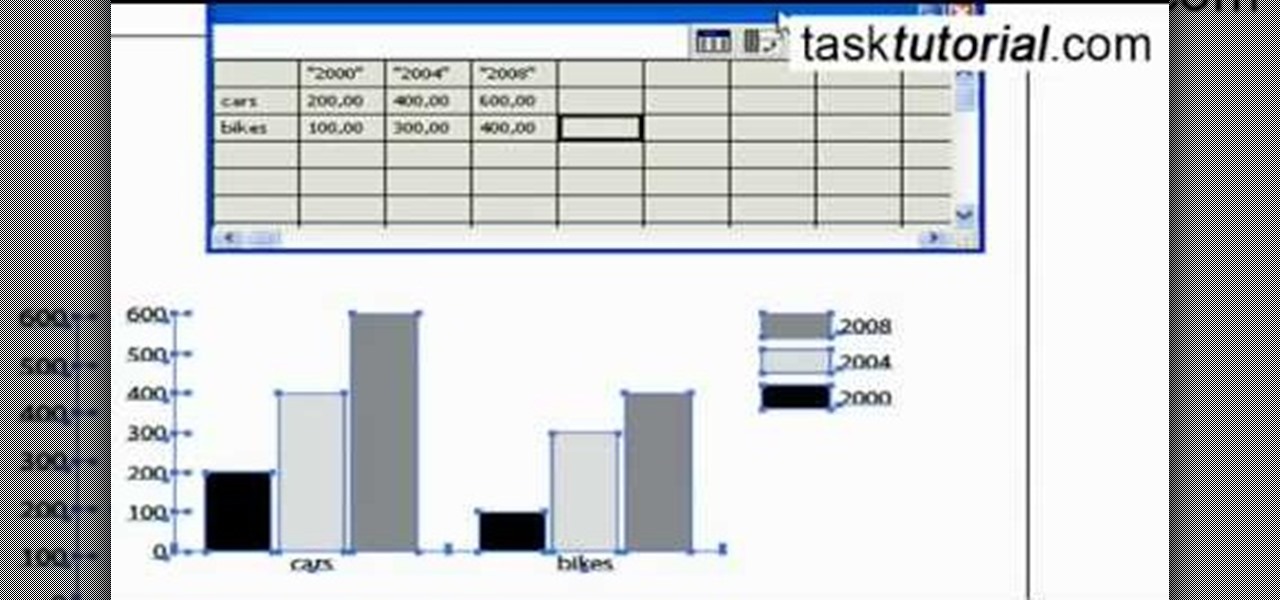
You will learn to create graphs in Illustrator. The best way to visualize data is a graph, and there are several different graph choices in this program. He chooses a column graph to show how he creates his graphs. Holding the left mouse button and dragging, he creates a rectangle which will be our graph. This brings up an input screen beside the rectangle for the graph; he puts information into the screen which shows up on the graph when he is finished.

If you've ever made graphs and charts, you know it can be a struggle to represent a large amount of data. It's something that just doesn't work very well on a flat surface. In virtual and mixed reality, however, the data can exist all around you.