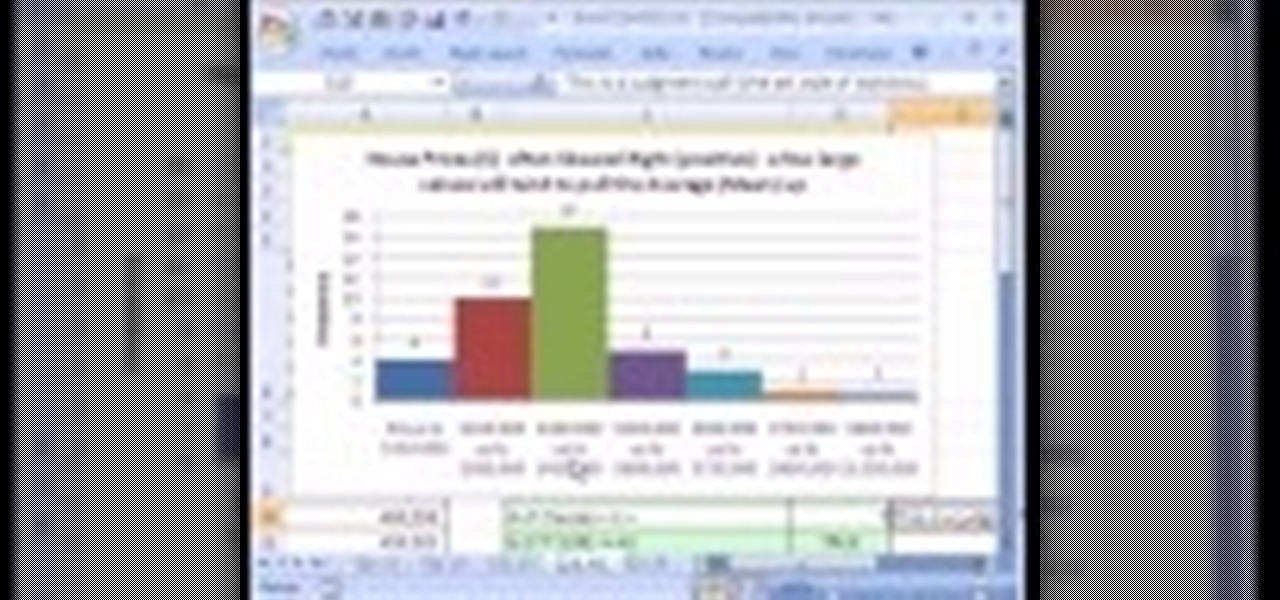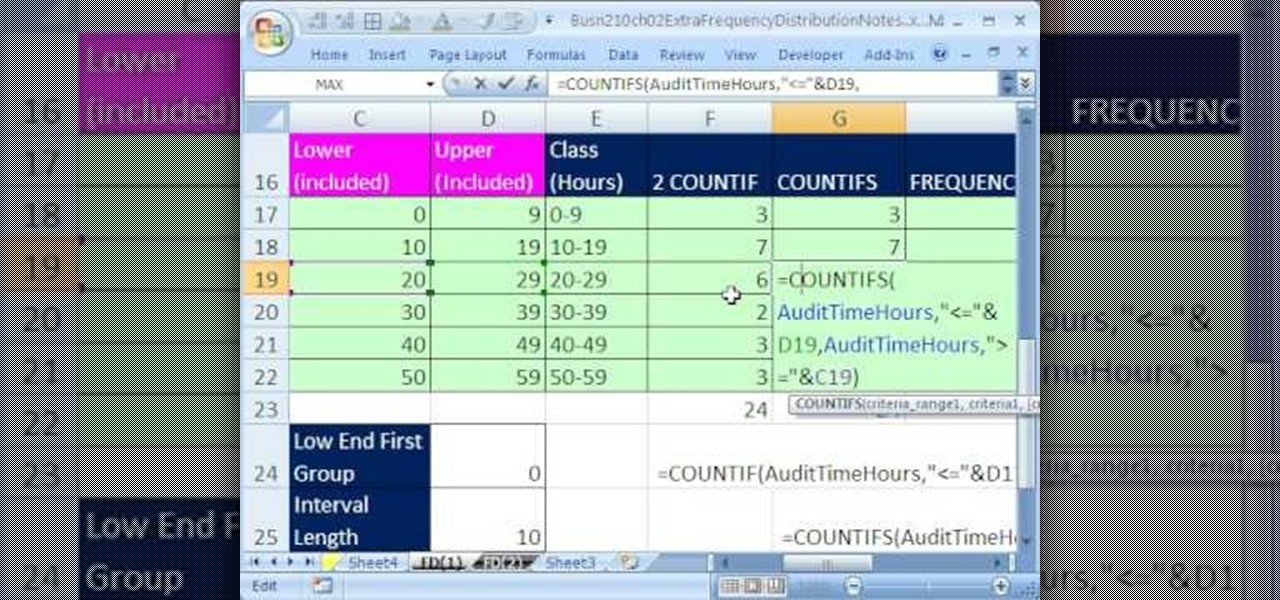
If you use Microsoft Excel on a regular basis, odds are you work with numbers. Put those numbers to work. Statistical analysis allows you to find patterns, trends and probabilities within your data. In this MS Excel tutorial from everyone's favorite Excel guru, YouTube's ExcelsFun, the 32nd installment in his "Excel Statistics" series of free video lessons, you'll learn how to group when the quantitative data are whole numbers, integers or discrete data and how to group when the quantitative ...
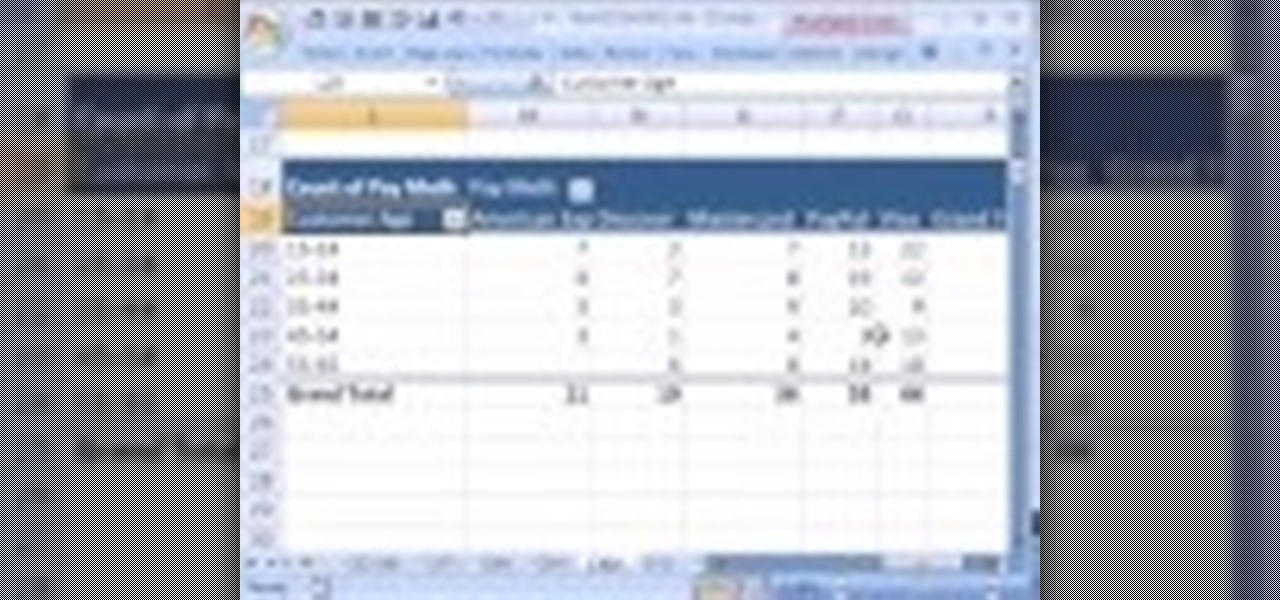
If you use Microsoft Excel on a regular basis, odds are you work with numbers. Put those numbers to work. Statistical analysis allows you to find patterns, trends and probabilities within your data. In this MS Excel tutorial from everyone's favorite Excel guru, YouTube's ExcelsFun, the 29th installment in his "Excel Statistics" series of free video lessons, you'll learn how to create quantitative data cross tabulation using a pivot table (PivotTable).
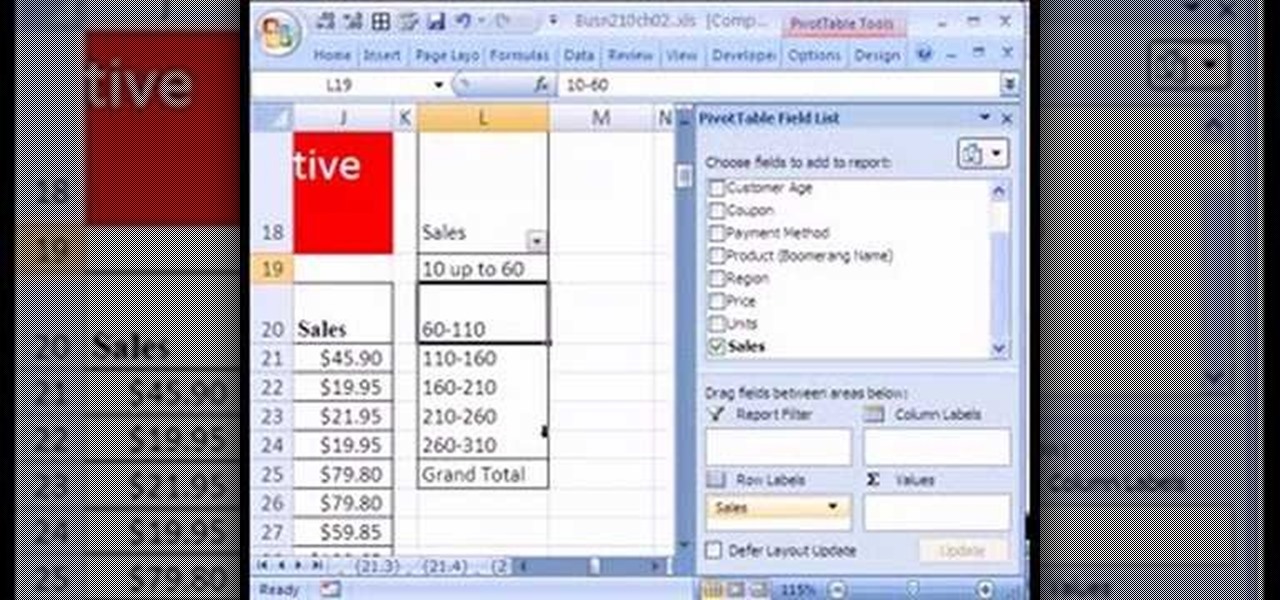
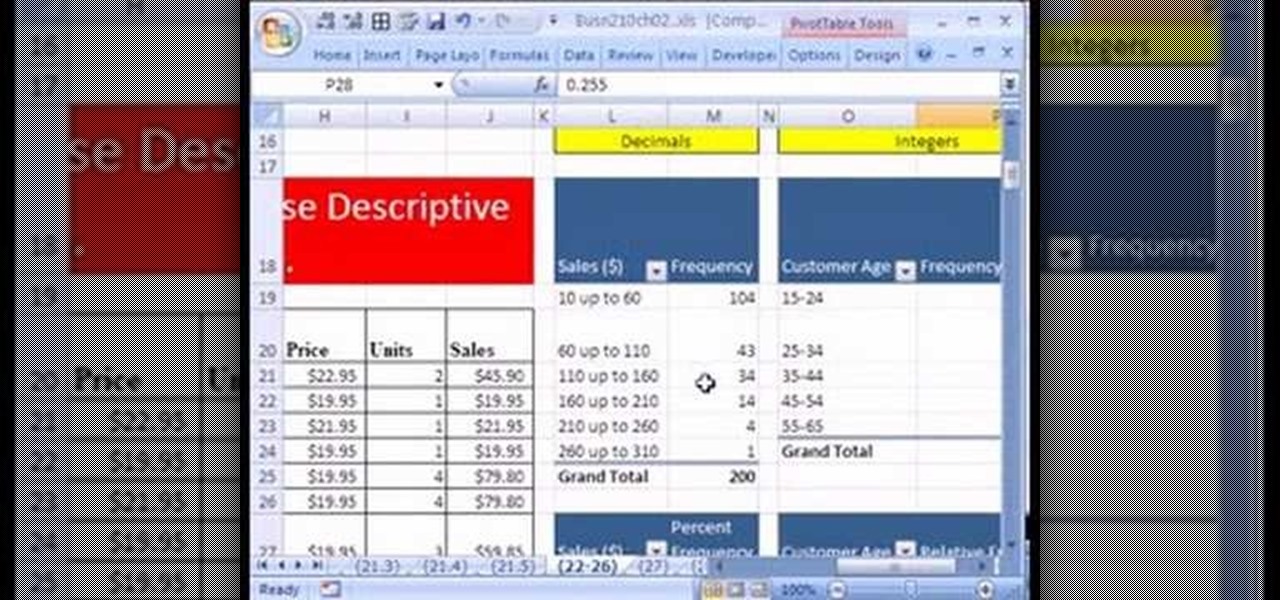
If you use Microsoft Excel on a regular basis, odds are you work with numbers. Put those numbers to work. Statistical analysis allows you to find patterns, trends and probabilities within your data. In this MS Excel tutorial from everyone's favorite Excel guru, YouTube's ExcelsFun, the 24th installment in his "Excel Statistics" series of free video lessons, you'll learn how to create quantitative data frequency distributions with pivot tables. See how to create the correct unambiguous labels ...

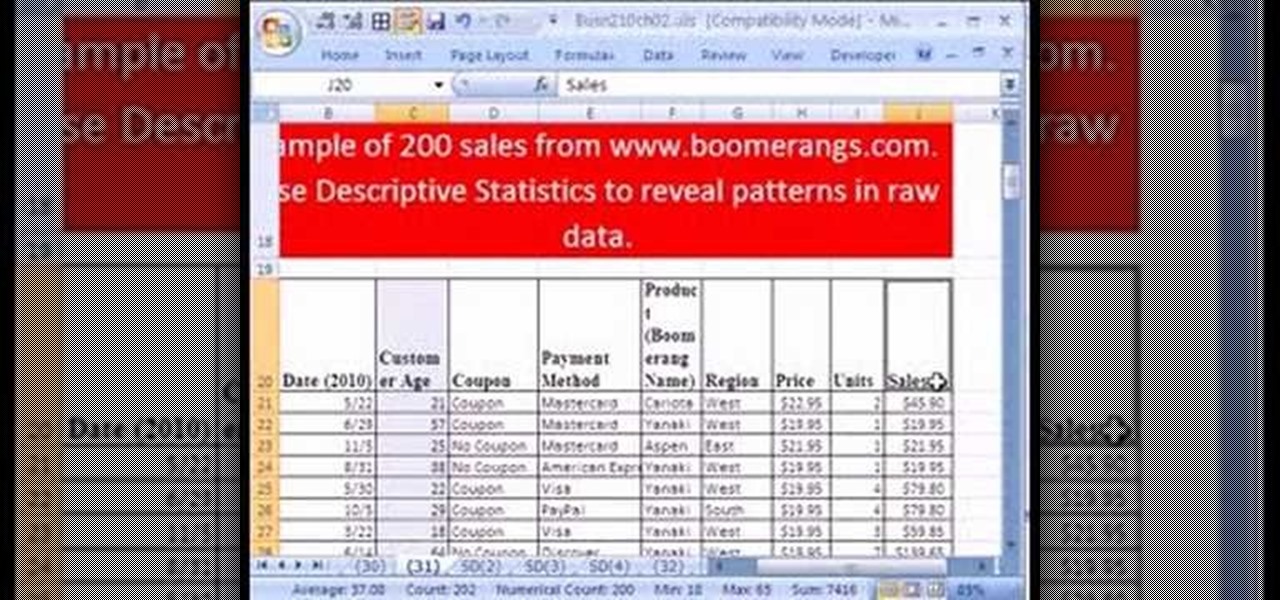
If you use Microsoft Excel on a regular basis, odds are you work with numbers. Put those numbers to work. Statistical analysis allows you to find patterns, trends and probabilities within your data. In this MS Excel tutorial from everyone's favorite Excel guru, YouTube's ExcelsFun, the 20th installment in his "Excel Statistics" series of free video lessons, you'll learn how to take raw quantitative (numerical) data and figure out how to group it into classes so that you can have categories an...

If you use Microsoft Excel on a regular basis, odds are you work with numbers. Put those numbers to work. Statistical analysis allows you to find patterns, trends and probabilities within your data. In this MS Excel tutorial from everyone's favorite Excel guru, YouTube's ExcelsFun, the 27th installment in his "Excel Statistics" series of free video lessons, you'll learn how to create a quantitative data dot plot chart using the REPT and COUNTIF functions.
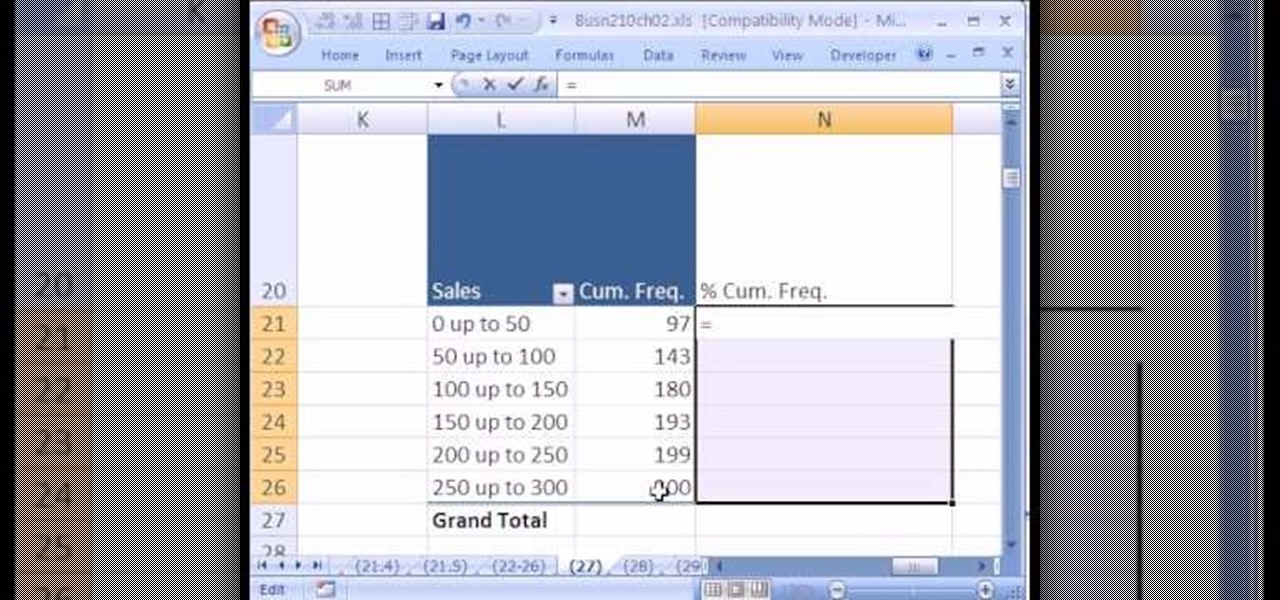
If you use Microsoft Excel on a regular basis, odds are you work with numbers. Put those numbers to work. Statistical analysis allows you to find patterns, trends and probabilities within your data. In this MS Excel tutorial from everyone's favorite Excel guru, YouTube's ExcelsFun, the 26th installment in his "Excel Statistics" series of free video lessons, you'll learn how to create quantitative data cumulative frequency distributions with pivot tables.

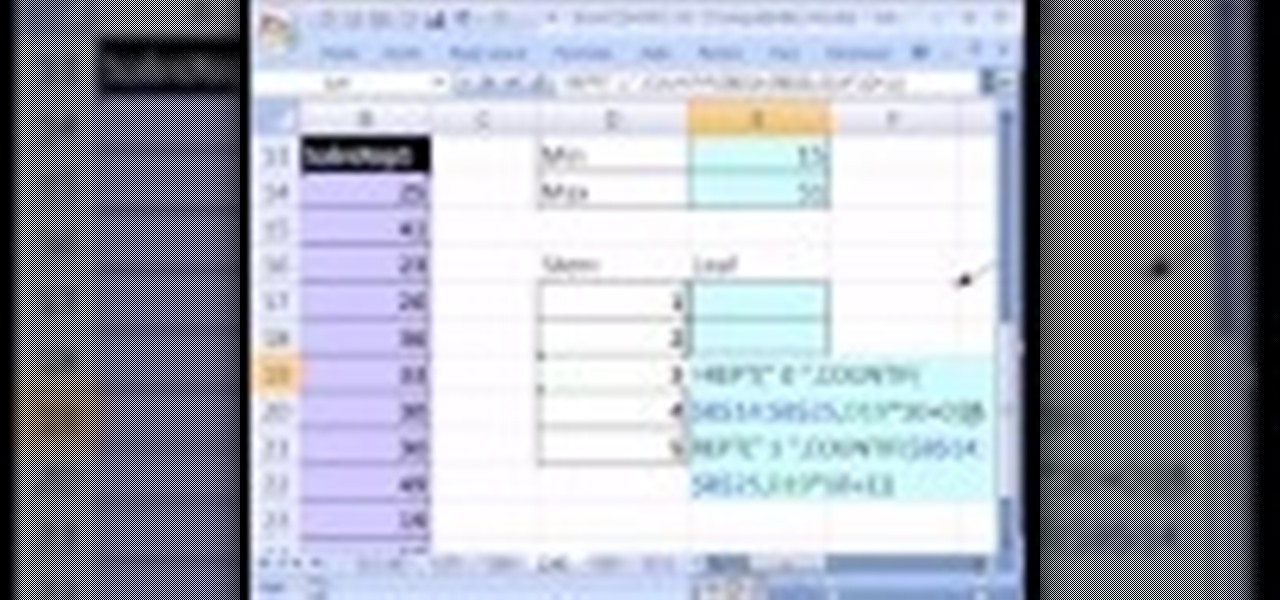
If you use Microsoft Excel on a regular basis, odds are you work with numbers. Put those numbers to work. Statistical analysis allows you to find patterns, trends and probabilities within your data. In this MS Excel tutorial from everyone's favorite Excel guru, YouTube's ExcelsFun, the 28th installment in his "Excel Statistics" series of free video lessons, you'll learn how to create quantitative data stem & leaf charts using the REPT and COUNTIF functions.

If you use Microsoft Excel on a regular basis, odds are you work with numbers. Put those numbers to work. Statistical analysis allows you to find patterns, trends and probabilities within your data. In this MS Excel tutorial from everyone's favorite Excel guru, YouTube's ExcelsFun, the 30th installment in his "Excel Statistics" series of free video lessons, you'll learn how to create a scatter diagram for 2 quantitative variables.

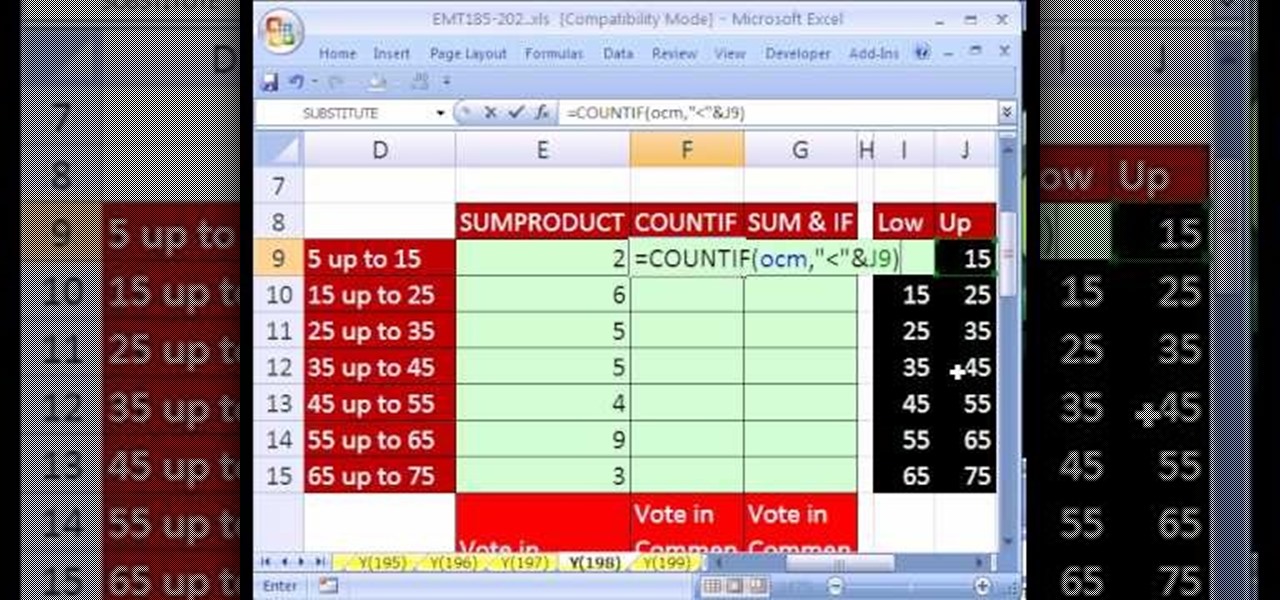
New to Microsoft Excel? Looking for a tip? How about a tip so mind-blowingly useful as to qualify as a magic trick? You're in luck. In this MS Excel tutorial from ExcelIsFun, the 198th installment in their series of digital spreadsheet magic tricks, you'll learn three different methods for counting quantitative data in categories that include a lower limit but not an upper limit.

Focus groups strike fear into the hearts of even the most season marketer, and with good reason. In a world where everything is subject to change based on public opinion, from movie endings, to popcorn flavors, to logo colors, focus groups can make or break a new idea, but it doesn't have to be that way. A focus group is just a way to gather opinions in a vigorous way and can be very useful. Watch this video tutorial to use a focus group to develop and test a new brand name or corporate ident...

If you use Microsoft Excel on a regular basis, odds are you work with numbers. Put those numbers to work. Statistical analysis allows you to find patterns, trends and probabilities within your data. In this MS Excel tutorial from everyone's favorite Excel guru, YouTube's ExcelsFun, the 25th installment in his "Excel Statistics" series of free video lessons, you'll learn how to create quantitative data percent & relative frequency distributions with pivot tables. Also see how to create a histo...

If you use Microsoft Excel on a regular basis, odds are you work with numbers. Put those numbers to work. Statistical analysis allows you to find patterns, trends and probabilities within your data. In this MS Excel tutorial from everyone's favorite Excel guru, YouTube's ExcelsFun, the 23rd installment in his "Excel Statistics" series of free video lessons, you'll learn how to work with skew in histograms for quantitative Data. Learn how to skew left (negative) and skew right (positive) with ...

If you want to know how to calculate percent error easily, you should watch this video. Error is the amount of deviation from accurate values. Error calculation is not possible, unless you make a quantitative measurement of the various quantities involved in your experiment. Measurement can help us in calculating errors and knowing how right we are in our theoretical models. In calculating percent error, We need to get the experimental value and the value which you are aiming at, which is the...

Alien invaders are a constant threat, so it is important that filmmakers continue their long tradition of making educational films like Independence Day to ensure that we know what to do when the invasion comes. If you want to make aliens films yourself, watch this video for tips on using compositing to replace the sky and make an awesome UFO / flying saucer.

Reading people's minds is something that most inquisitive and sensitive people have wished that they could do at some point. Well, what if you could? This video will show you a great multipurpose bar trick that will allow you to appear to read the mind or body of people in a variety of situations. It's really remarkable how easy this is and how well it works.

If you believe there is a person out there who is threatening your life or has even made a threat against you already, you might want to file a restraining order against that person. This video will teach you the criteria you need for a restraining order and how to go about getting one.

This video details how to survive a knife threat from behind. When threatened from behind with a knife, do not attempt to move the body first, this will result in the attacker maintaining the capability to thrust the knife into the body. When threatened, place arms out and low in a submissive position, this is to be followed by moving the left arm backward in a sweeping motion to push aside the arm which is holding the knife. Once the arm is moved, turn the body and bring the elbow up into an...

The search is on to find antibiotics that will work against superbugs — bacteria that are rapidly becoming resistant to many drugs in our antibiotic arsenal.

This is a Google Tech Talk from March, 26 2008. Timothee Cour - Research Scientist lectures. Movies and TV are a rich source of highly diverse and complex video of people, objects, actions and locales "in the wild". Harvesting automatically labeled sequences of actions from video would enable creation of large-scale and highly-varied datasets. To enable such collection, we focus on the task of recovering scene structure in movies and TV series for object/person tracking and action retrieval. ...

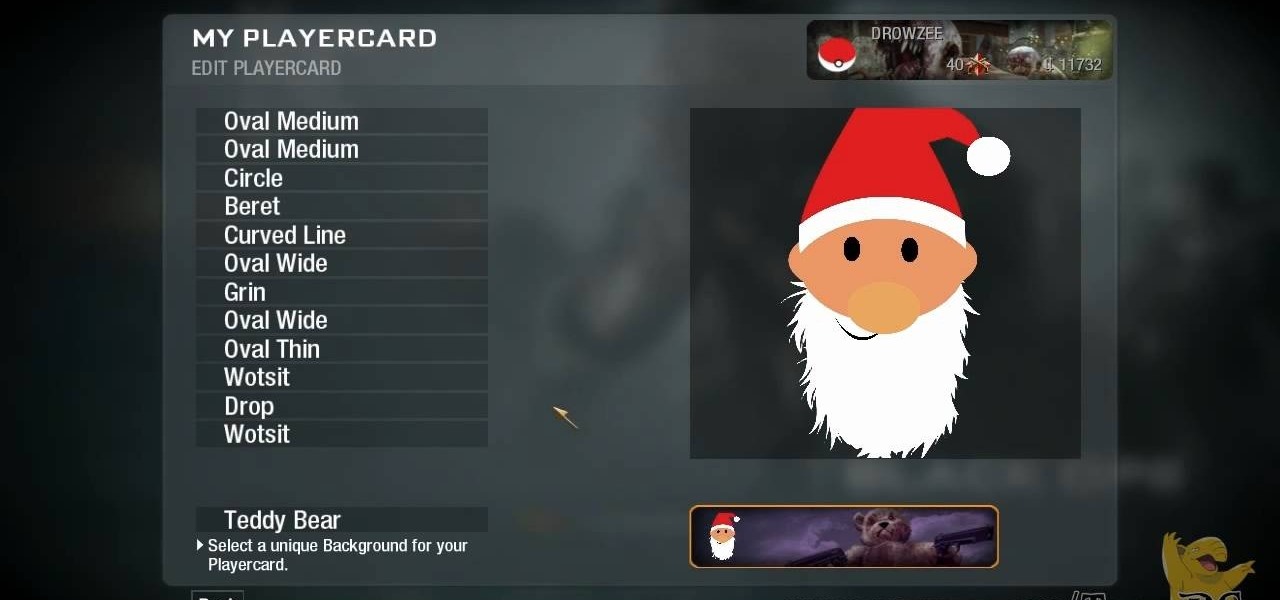
Santa Claus, hero to us all, and for those under threat from Creep Critters, a powerful shotgun-wielding savior. If you feel Santa symbolizes your Black Ops persona, watch this video to learn how to make him your custom playercard / emblem.

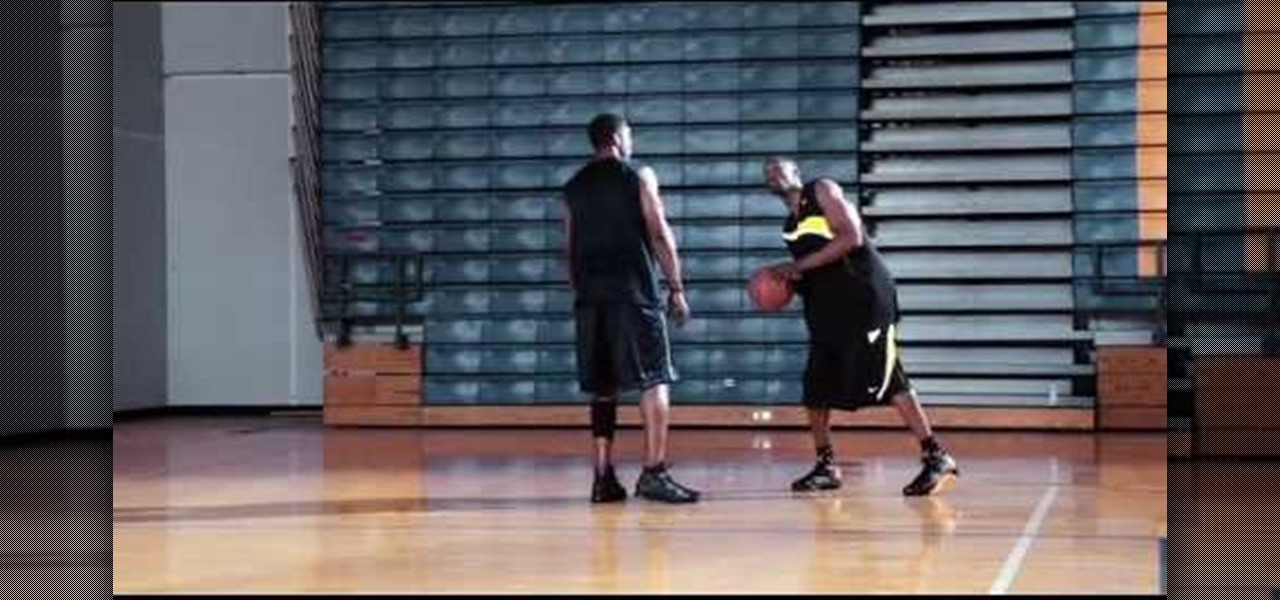
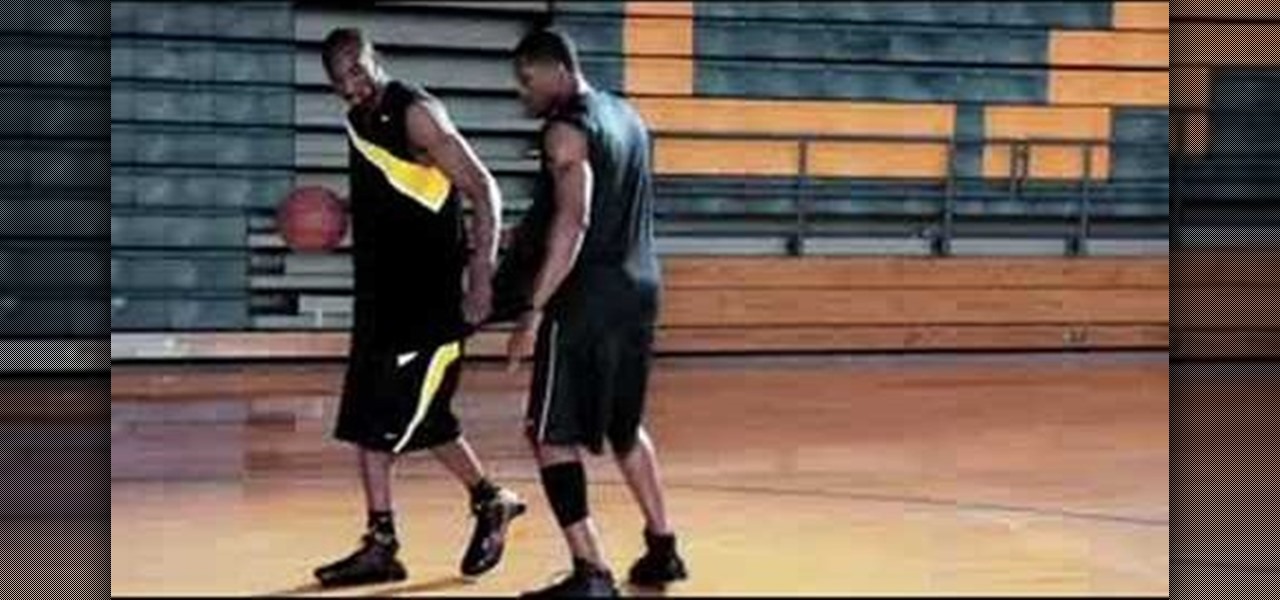
This is how to do the KB24 pull-up jumper. Kobe Bryant shows off the Signature Move from Nike's series. This is a great finishing move by NBA's MVP. Pull-up jumper is a four step process: get to triple threat position, jab step, drive by and pull-up the jumpshot!

Multi time NBA MVP and Lakers legend, Kobe Bryant shows his reverse layup. Start in triple threat position, jab step to get space, drive by the defender and reverse the lay up at the hole. This is a Signature Moves film from Nike.

Big predators pose a big threat unless you know what to do under attack. HOW TO SURVIVE advises making lots of noise, freezing when confronted, and playing defense in order to survive. Watch this video outdoor safety tutorial and learn how to survive an attack from a large predator, like bears or cougars.

If you've ever received that grim error message from your iPod that tells you that you have to restore it, then you know what it feels like to stare down the threat of losing all your hard-acquired music files. This video teaches you how to make your iPod work again without having to restore it, preserving both the functionality of the iPod and your extensive MP3 and video library.

There are many threats to be wary of when playing Terraria. If you'd like to be able to feel safe from a couple of them, watch this video and learn how to protect your house during Red Moon events and Goblin Invasions.

Most crochet projects are going to require you to change colors of threat or join two skeins at some point, and that means changing threads. Watch this video to learn an easy trick to changing thread that will make your crocheting life easier.

If you live somewhere where winter storms and blizzards are a threat, watch this video. It will give you several great tips for riding out a winter storm or blizzard safely inside your house. These include running water continuously so your pipes don't freeze and wearing layers of clothing to adjust to changing temperatures.

Make your way through the Chimera tunnels and find your way to the Stronghold's access point. Once inside eliminate all possible enemy threats. Sounds easy? Just wait!

Watch Ray Mears from the BBC explore the most dangerous threats in the desert--spiders, snakes, and scorpions--with a desert ranger. Learn how to avoid black widows by observing an area before you sit down! Do not "mess with any animals you know nothing about." If stung, stay calm.

Baidu Inc, the "Chinese Google" search engine and technology company, which has been actively pursuing self-driving cars, reported that a gang of hackers recently attempted to steal its driverless car technology.

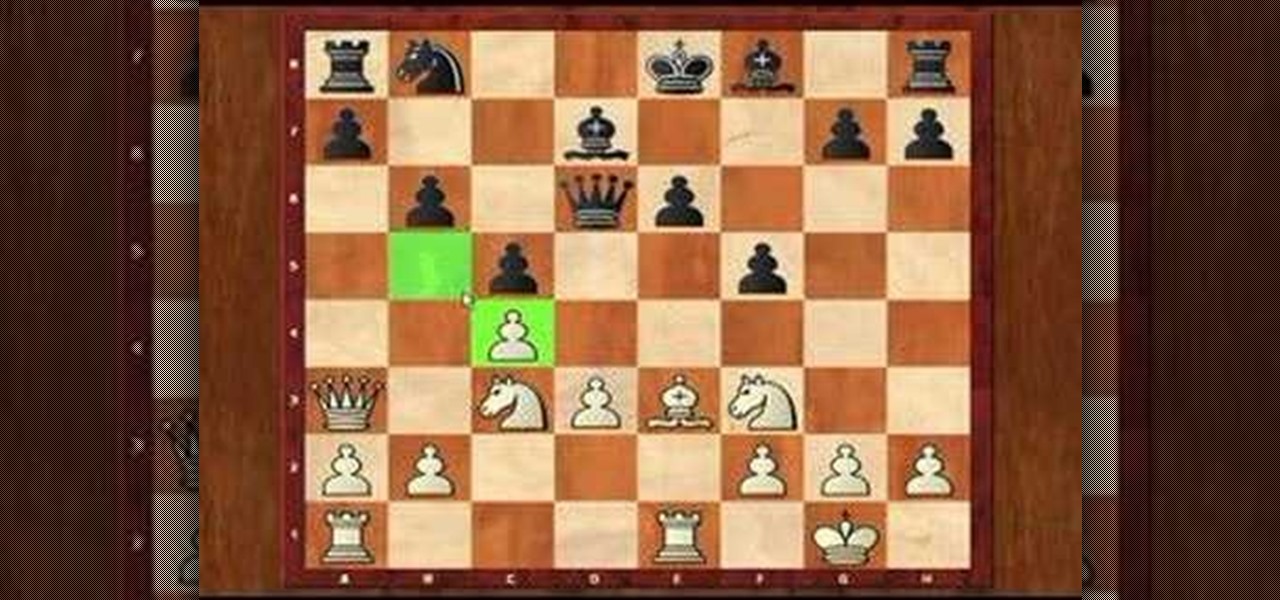
This is a match that takes a look at rapidly changing from a queen side attack to a king side attack, and how that can sometimes catch your opponent off guard. The match also shows how creating complications can sometimes mask the most deadly, yet subtle threat.

LeBron is a threat, no matter what the defense throws at him. See how he uses the art of deception to find a way to score even when he's not shooting. First ask for the ball. Second make a move to draw the 2nd defender. Third pass the ball to the open man.

How to do the Lebron James signature move fake & pass is as easy as a couple of steps. LB23 is a basketball / NBA legend and he's only 24 years old. He is the next Michael Jordan! Watch his Signature Move from Nike.

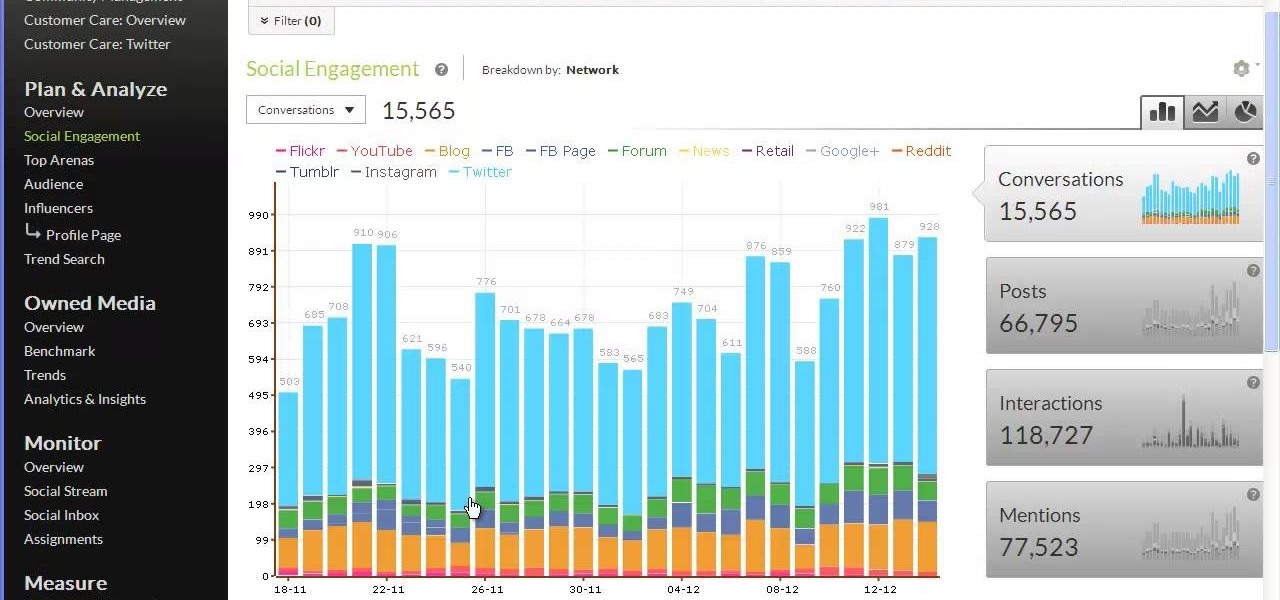
Tracx is a social intelligence software platform that allows enterprises to manage, share and extract actionable insights, threats and opportunities from the social web —in real time.

Hurricanes are a constant threat to many Americans, and many homes are not constructed properly to be safe from hurricanes. In other countries with less money, these problems are even worse. This video from the International French Red Cross will show you how you can construct a cheap, effective shelter against hurricanes out of concrete and wood. If your home is unsafe and you don't want to retrofit, you might want to consider one of these.

The growing list of dangerous antibiotic resistant organisms has just acquired three new members. Researchers have discovered three new species of Klebsiella bacteria, all of which can cause life-threatening infections and have genes that make them resistant to commonly used antibiotics.

There could be a fresh outbreak of the Zika virus in the Americas as the weather heats up and the mosquito population blooms.

Are you a young aspiring actress? A triple threat? Many top singers and entertainers today got their start on the Disney Channel. In this video, learn how to get that audition with the Disney Channel... Who knows, it could be your big break!

To bring things up to code with a new FCC standard, Android recently added an "Emergency broadcasts" feature that will make your smartphone notify you whenever a potential safety threat or Amber Alert is posted in your area. Even if you have your phone set to silent, these emergency alerts will cause your device to emit a loud, piercing sound when a potential threat is nearby.

Having a Clostridium difficile infection means stomach pains, diarrhea, fever, and loss of appetite, and if the symptoms weren't bad enough, the disease often reoccurs. Now, new research has found an increased risk of recurrence in people who take medication to treat their stomach acid, gastroesophageal reflux disease, peptic ulcer disease, or stomach discomfort.


