Interested in using Google's Page Speed performance analysis application? This clip will show you how it's done. It's simple! So simple, in fact, that this home-computing how-to can present a complete, step-by-step overview of the process in just over four minutes. For more information, including complete, step-by-step instructions, take a look.
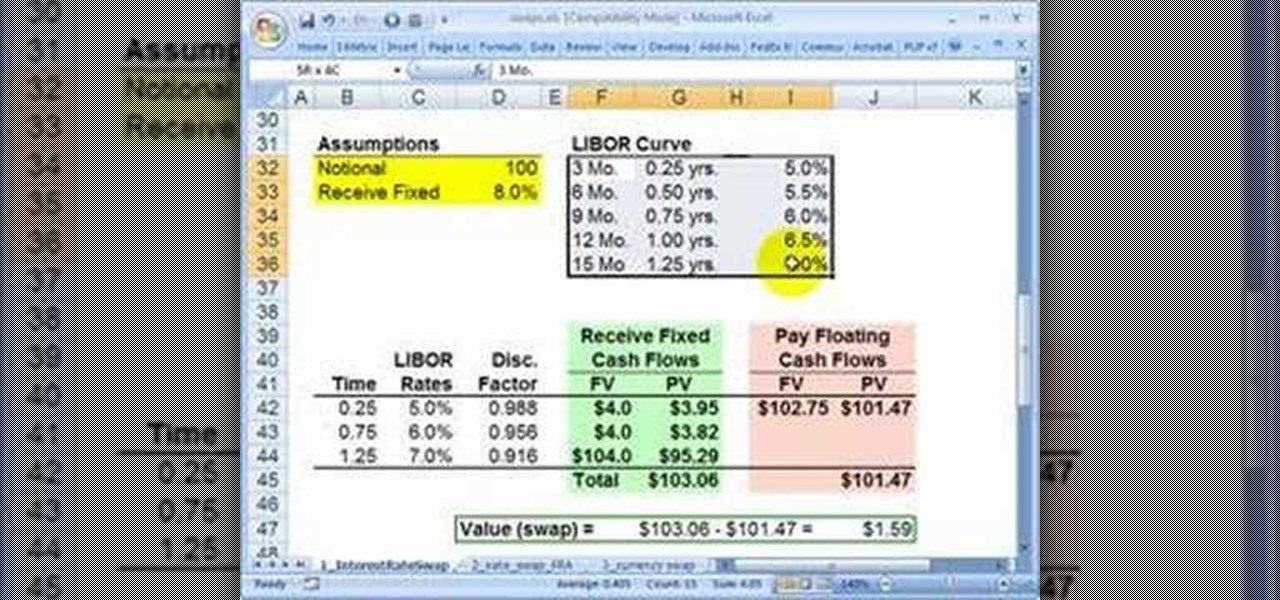
High finance and statistical analysis are too complex for most people once they forget what they learned in high school. If you are an investor or small business owner, you can't afford to forget this stuff. This video will teach you how to value an interest rate swap, good info for financial professionals and students.

If you're reading this, you're likely a tech-savvy coding pro whose analytical talents are mostly applied to designing apps, cracking passwords, and infiltrating networks — all of which are admirable activities for both aspiring and seasoned white hat hackers. But there are other profitable ways that you can put these types of skills to use, namely in the world of investment and trading.

Whether you're interested in learning Microsoft Excel from the bottom up or just looking to pick up a few tips and tricks, you've come to the right place. In this tutorial from everyone's favorite digital spreadsheet guru, ExcelIsFun, the nth installment in his "Highline Excel Class" series of free video Excel lessons, you'll learn how to do basic statistical analysis in Excel. Specifically, this video covers the following topics:
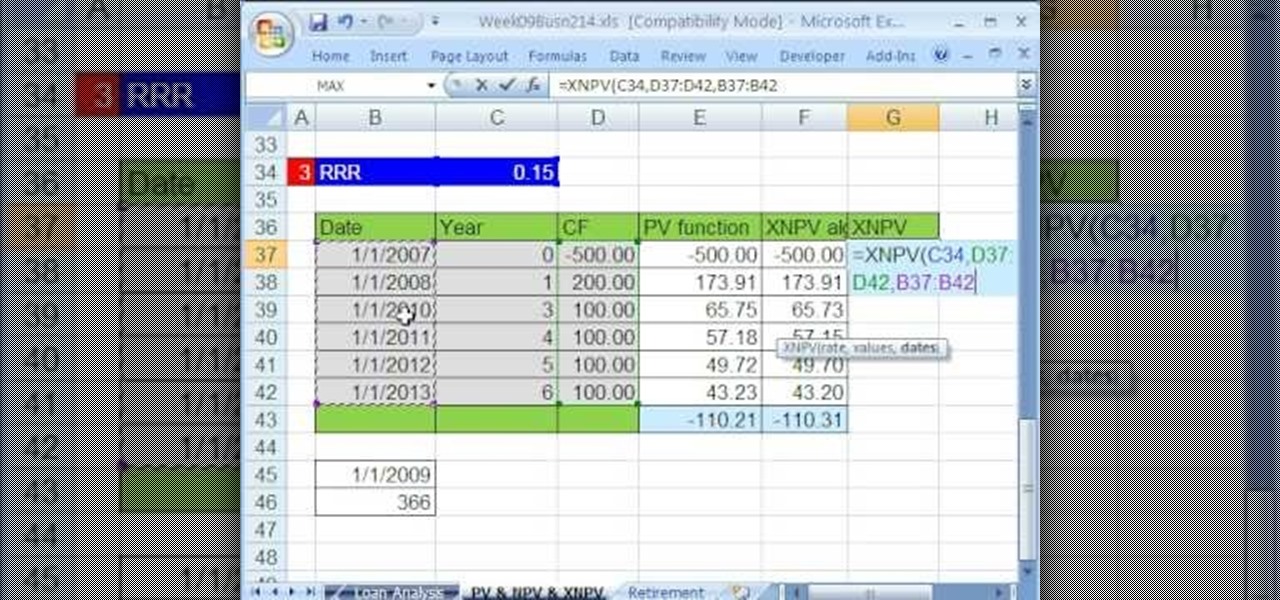
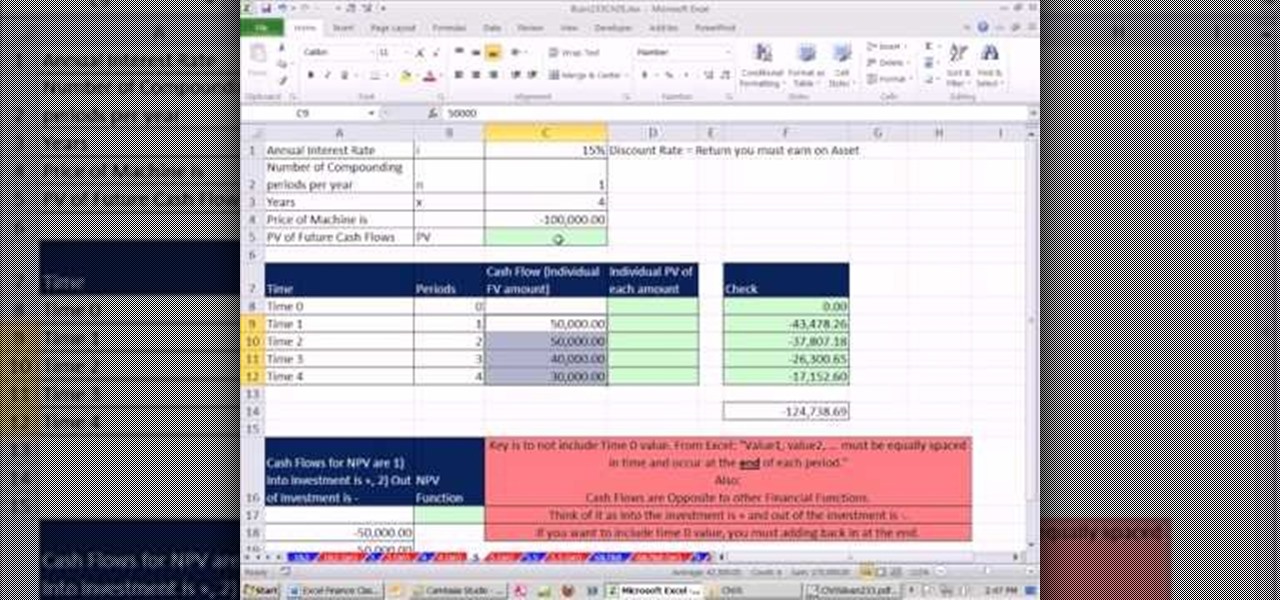
Whether you're interested in learning Microsoft Excel from the bottom up or just looking to pick up a few tips and tricks, you're in the right place. In this tutorial from everyone's favorite digital spreadsheet guru, ExcelIsFun, the 50th installment in his "Highline Excel Class" series of free video Excel lessons, you'll learn how to value an asset as well as perform discounted cash flow analysis with the Excel functions PV, NPV & XNPV.
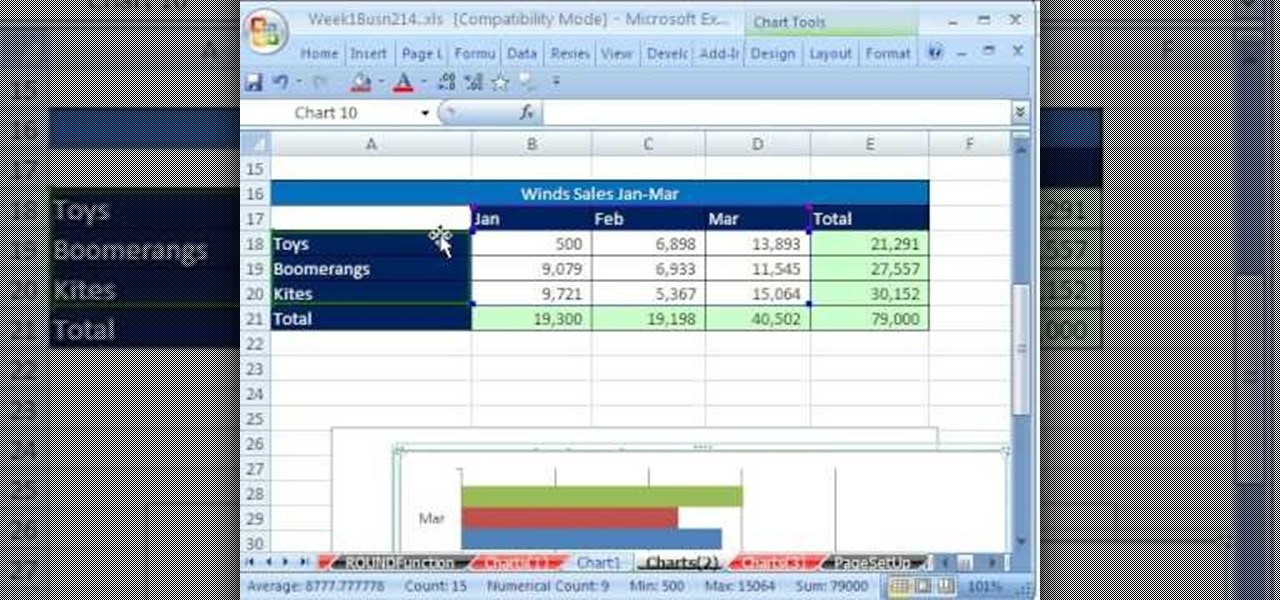
Whether you're interested in learning Microsoft Excel from the bottom up or just looking to pick up a few tips and tricks, you're in the right place. In this tutorial from everyone's favorite digital spreadsheet guru, ExcelIsFun, the 5th installment in his "Highline Excel Class" series of free video Excel lessons, you'll learn how to create seven types of charts — X-Y scatter diagrams, pie charts, column charts, bar charts, stacked bar charts, line charts, and column and line chart combined. ...

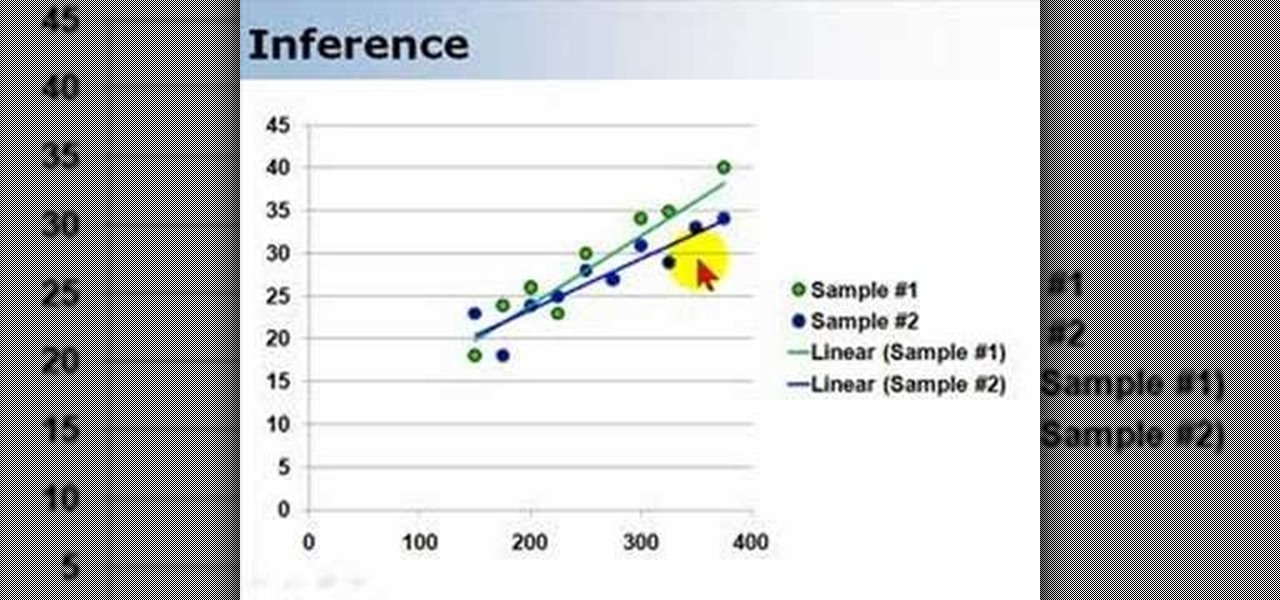
Regression functions are a vital part of statistical analysis of populations, and if you're involved in business, science, or nearly any academic field you should understand how it works. This series of videos will show you how standard regression functions, ANOVA, ordinary least squares, and everything else you need to know.
Analyzing a play can help actors, directors, or scholars to understand everything about a given play. Learn how to write a play analysis in this free theater video from a college professor.
We all know how volatile the stock market is, especially during times of crisis. That does not mean that the market is impossible to gauge, however. Day traders are trained to read charts in order to recognize market trends and price patterns, giving them the insight they need to make their trades as profitable as possible.
The rumor that the iPhone 8 will ship with 3D camera system is not a new one, but a new analysis by Morgan Stanley's Charlie Chan lends credibility to the speculation. Now, it appears more likely than ever that Apple's next iPhone will ship with 3D capabilities, increasing potential for AR and VR integration in the future.
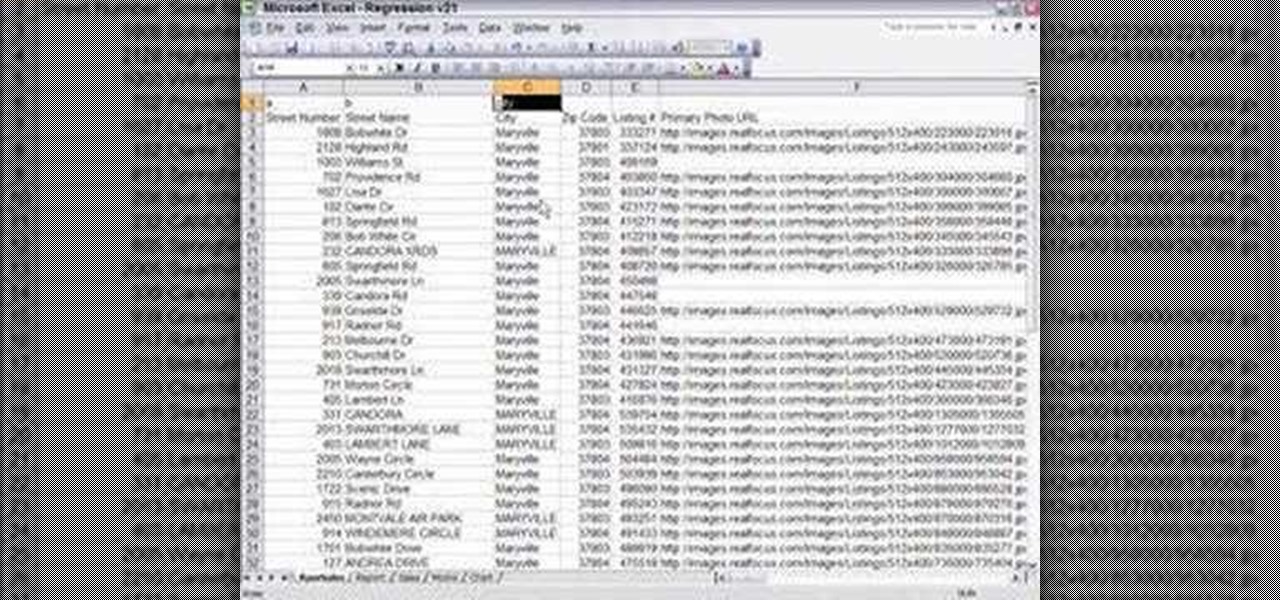
Are you in real estate? Take a look at this instructional video and learn how to run your excel spreadsheet over a regression analysis module. An appraiser who's appraising a house decides to run a multiple regression analysis as an addition to the direct sales comparison approach. The spreadsheet used in this tutorial was written in excel, but could be rewritten in another format. The spreadsheet was exported from an MLS. Once the excel sheet is downloaded, the appraiser will open up the reg...
British record producer David Spoon explains how he uses the computer program Propellerhead Reason 4 to create rhythm and bass tracks in his home music studio. He explains that by just messing around with the controls within the program, you can create a lot of interesting sounds and effects. Sometimes the best sounds are discovered by accident. He uses Filter 2 to create interesting effects that he describes as "acid-y" or "nasty", having to do with the resonance of the bass sound. He also a...
Today, Facebook Messenger is rolling out Discover, a feature that helps you chat with companies and locate nearby businesses of interest to you. First discussed in April at Facebook's developer conference F8, Discover is finally available for public use.
Whether you're new to Adobe After Effects or a seasoned digital film professional after a general overview of CS5's most vital new features, you're sure to be well served by this official video tutorial from the folks at Adobe TV. In it, you'll learn how to turn spoken dialogue into searchable text either by synchronizing content with your Adobe Story script, or by using reference scripts that are optimized for your content. Also see how to accelerate editing by marking in and out points in t...
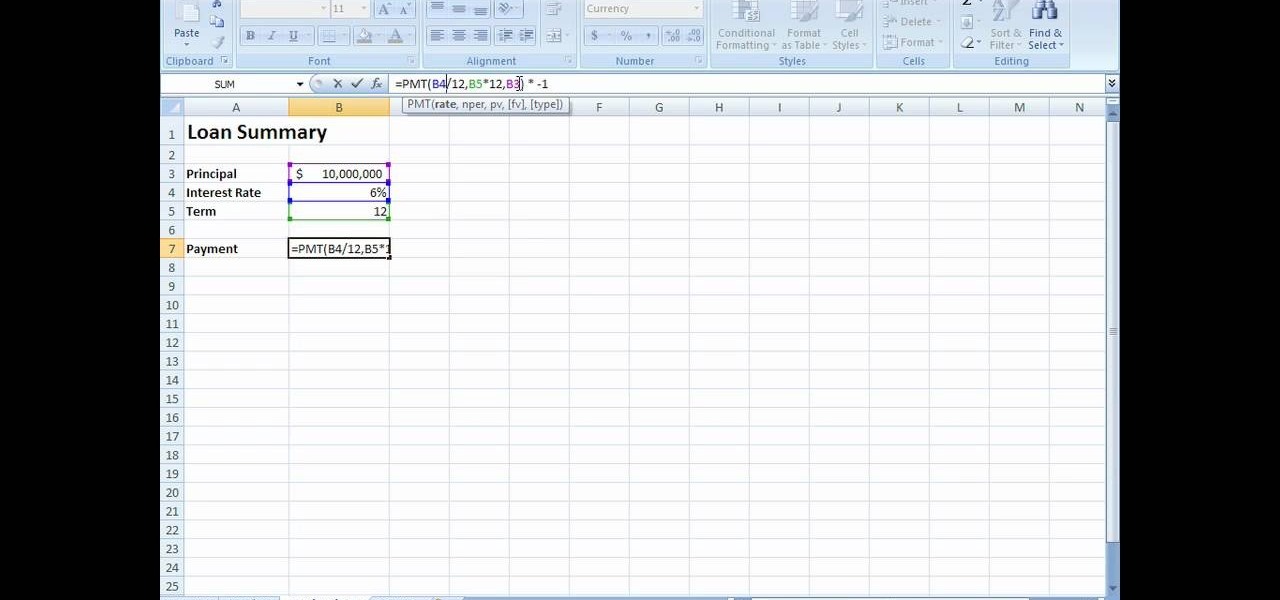
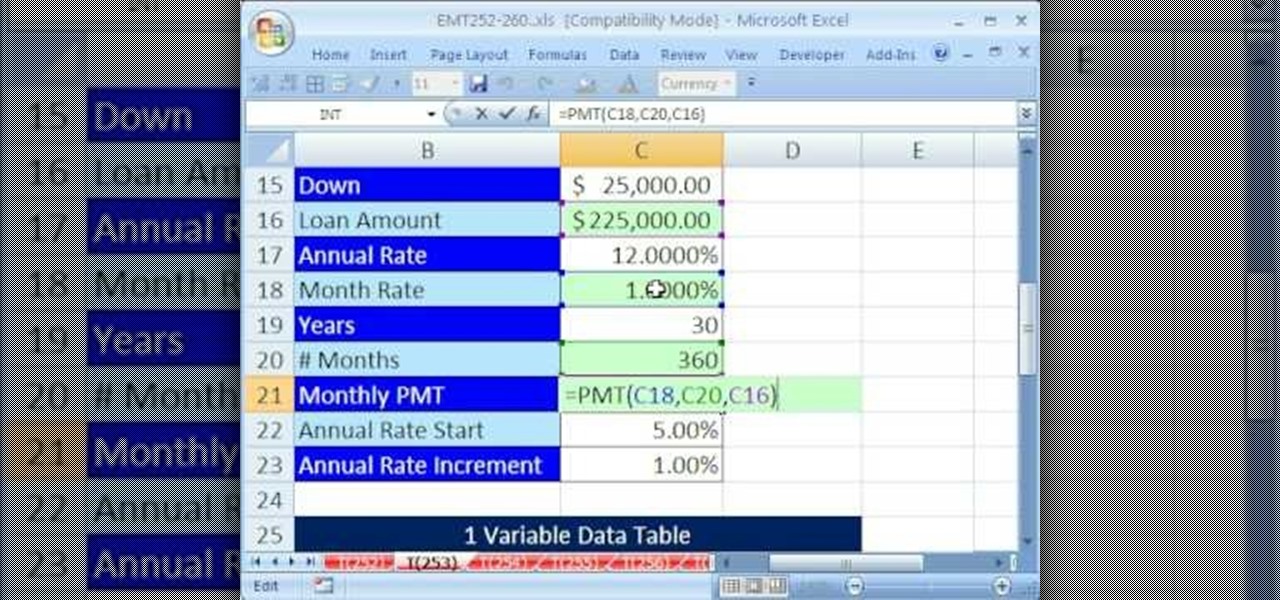
New to Microsoft Excel? Looking for a tip? How about a tip so mind-blowingly useful as to qualify as a magic trick? You're in luck. In this MS Excel tutorial from ExcelIsFun, the 255th installment in their series of digital spreadsheet magic tricks, you'll learn how to create a two-variable data table in Excel for what-if analysis. See the PMT function and learn about the formula equivalent to a data table.
If you have so much as a passing interest in jazz piano, then you've surely heard of Art Tatum. This two-part tutorial offers a descriptive analysis and visual demonstration of one of Art Tatum's favorite licks, the flatted fifth series two-finger descending run. While this tutorial is best suited for intermediate or advanced pianists, players of all skill levels can attempt to play along. Watch this tutorial to get started playing flatted fifth two-finger runs.
In this dance tutorial, if you're interested in doing some break dance moves, this should help.
When German mathematician August Ferdinand Möbius (also known as Moebius) discovered the weird, seemingly parodoxical shape that would later be known as the Möbius strip, he surely never imagined it would go on to be featured everywhere from the work of artist M.C. Escher to the recycling logo we now see on the back of milk cartons. In this video, we watch as a scarf is knitted based on the Möbius strip. This interesting and eye-catching scarf design looks more complicated than it really is.
Discover how to generate an excellent piece of art from an image with the use of layers and tones in Photoshop CS3. If you make certain features or subjects in the image stand out, you will get a more dramatic and interesting look. See how to make features in your images stand out in Photoshop CS3 by adjusting tones and colors.
Making an animated film? This short and easy animation tutorial provides beginners the bare minimum to begin creating a claymation or stop motion animation film. This instructional video shows how to move claymation characters, how to control the lighting, and how to create a visually interesting set with props. This claymation video also compares the different results when you vary the frames per second.
Host Meghan Carter travels to ACE Concrete in Sun Valley, California to discover the essential decorative concrete information. Whether you're interested in concrete floors, sinks, countertops, mantels or any other type of concrete for your home, Meghan got the essential facts to help you make the right decision when using decorative concrete in your home.
A new survey shows that the majority of companies have an interest in using augmented reality, though adoption remains low. Meanwhile, two companies with support roles in the augmented reality industry are seeing positive financial results.
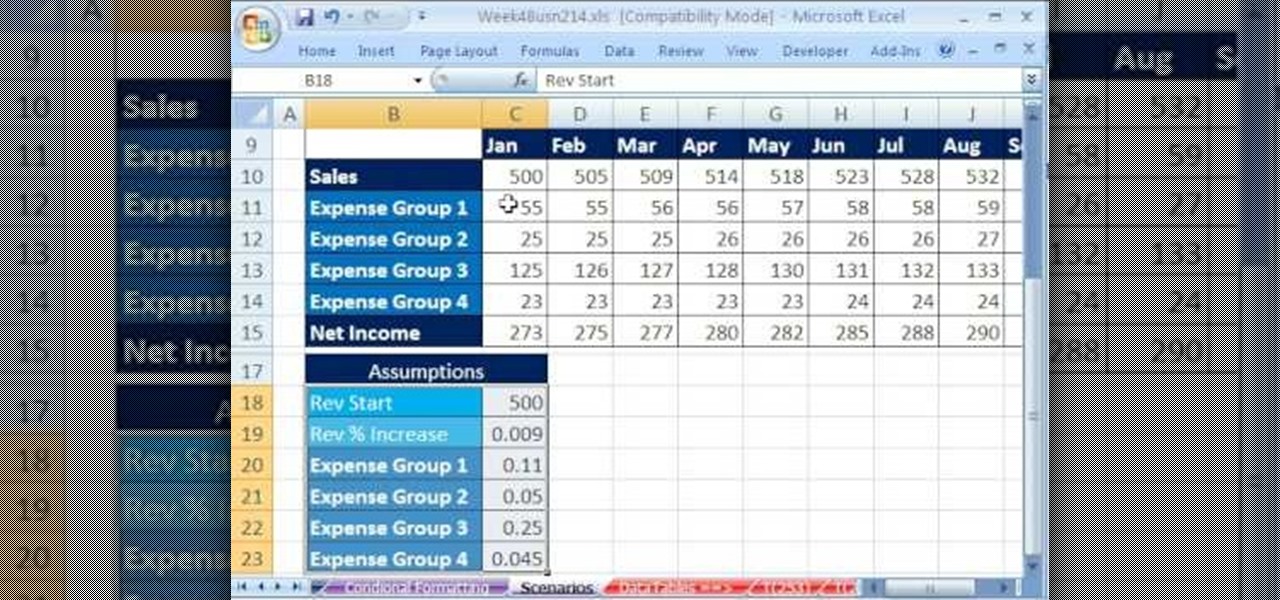
Whether you're interested in learning Microsoft Excel from the bottom up or just looking to pick up a few tips and tricks, you're in the right place. In this tutorial from everyone's favorite digital spreadsheet guru, ExcelIsFun, the 22nd installment in his "Highline Excel Class" series of free video Excel lessons, you'll learn how to create a budget with formula inputs in an assumption area and formulas. Then do what-if analysis by saving and showing scenarios. Also see how to save variables...
If you use Microsoft Excel on a regular basis, odds are you work with numbers. Put those numbers to work. Statistical analysis allows you to find patterns, trends and probabilities within your data. In this MS Excel tutorial from everyone's favorite Excel guru, YouTube's ExcelsFun, the 43rd installment in his "Excel Statistics" series of free video lessons, you'll learn how to use the Excel Data Analysis add-in descriptive statistics tool.
If you use Microsoft Excel on a regular basis, odds are you work with numbers. Put those numbers to work. Statistical analysis allows you to find patterns, trends and probabilities within your data. In this MS Excel tutorial from everyone's favorite Excel guru, YouTube's ExcelsFun, the 13th installment in his "Excel Statistics" series of free video lessons, you'll learn how to install the Excel 2007 Data Analysis add-in.
A histogram is a summary graph showing a count of data points that fall in various ranges. Histograms are used in statistics and other forms of mathematics. In this video, learn how to create your own histogram using data analysis on the computer. This tutorial will show you how to create a frequency distribution, a cumulative frequency distribution, a histogram chart and an ogive chart with the data analysis add-in.
Whether you're interested in learning Microsoft Excel from the bottom up or just looking to pick up a few tips and tricks, you've come to the right place. In this tutorial from everyone's favorite digital spreadsheet guru, ExcelIsFun, the 45th installment in his "Highline Excel Class" series of free video Excel lessons, you'll learn how to perform debt analysis with the following input variables: % Down Payment, APR, Years, Points, Extra Fee. See how to calculate Amount to Borrow, Monthly Pay...
Learn how to prevent fallying prey to cmmon careless errors when doing fiscal analysis in MS Excel. Whether you're new to Microsoft's popular digital spreadsheet application or a seasoned business professional just looking to better acquaint yourself with the Excel 2010 workflow, you're sure to be well served by this video tutorial. For more information, including step-by-step instructions, take a look.
If you use Microsoft Excel on a regular basis, odds are you work with numbers. Put those numbers to work. Statistical analysis allows you to find patterns, trends and probabilities within your data. In this MS Excel tutorial from everyone's favorite Excel guru, YouTube's ExcelsFun, the 3rd installment in his "Excel Statistics" series of free video lessons, you'll learn how to use Excel's sorting and pivot tables (PivotTables) data analysis tools.
As you might guess, one of the domains in which Microsoft Excel really excels is finance math. Brush up on the stuff for your next or current job with this how-to. In this tutorial from everyone's favorite digital spreadsheet guru, YouTube's ExcelIsFun, part of his "Excel Finance Class" series of free video lessons, you'll learn how to use the PV and PMT functions together to do asset valuation using discounted cash flow analysis.
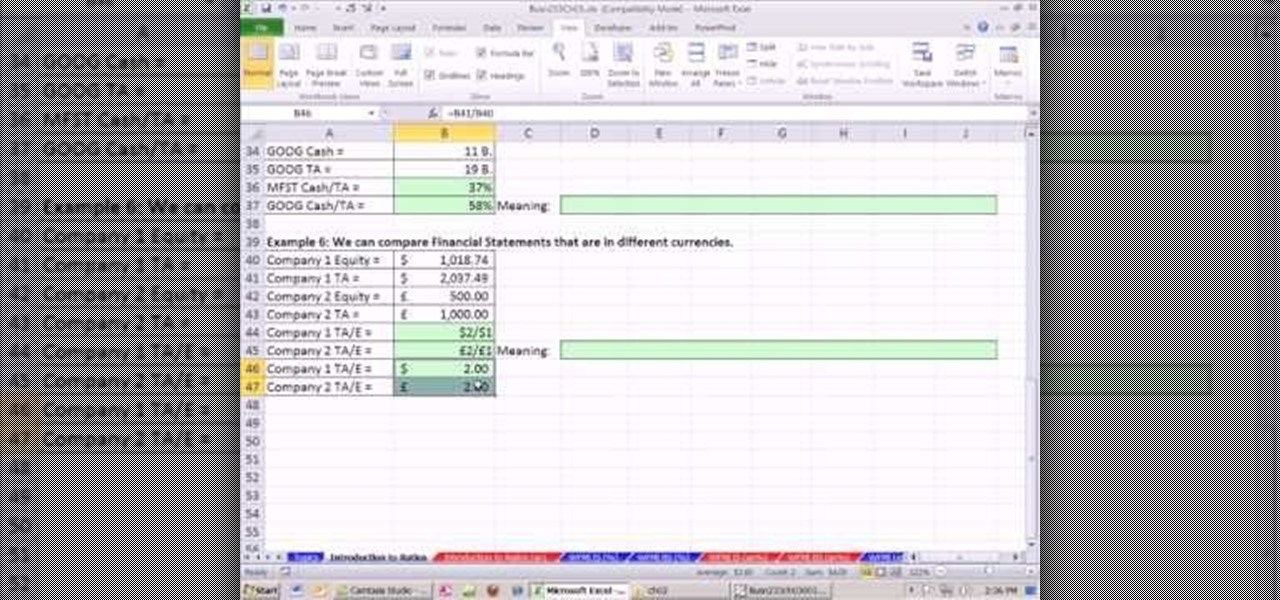
As you might guess, one of the domains in which Microsoft Excel really excels is finance math. Brush up on the stuff for your next or current job with this how-to. In this tutorial from everyone's favorite digital spreadsheet guru, YouTube's ExcelIsFun, the 17th installment in his "Excel Finance Class" series of free video lessons, you'll learn how to perform simple financial ratio analysis.
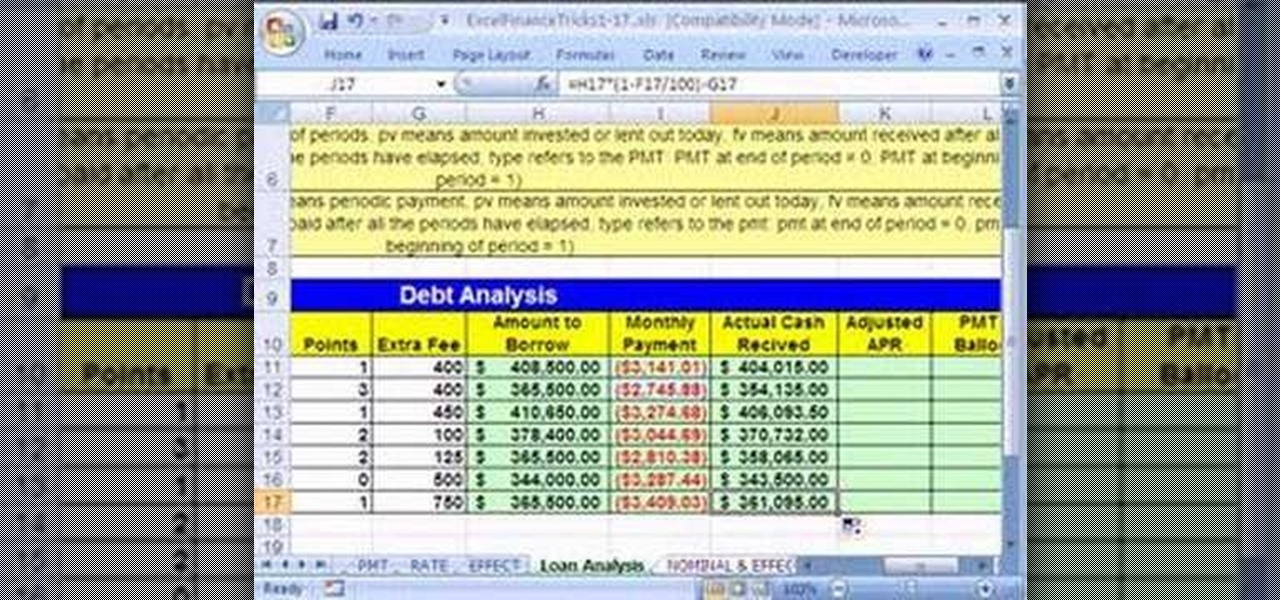
As you might guess, one of the domains in which Microsoft Excel really excels is finance math. Brush up on the stuff for your next or current job with this how-to. In this tutorial from everyone's favorite digital spreadsheet guru, YouTube's ExcelIsFun, the 18th installment in his "Excel Finance Trick" series of free video lessons, you'll learn how to use the PMT and RATE functions for a complete debt/loan analysis.
SlashFilm Offers a Frame-by-Frame Analysis SlashFilm has a very interesting article examining the striking similarities between the 2009 Academy Award-winning film Up and a French university student's short film, Above The Beyond.
Adobe Photoshop CS4 is the industry-standard software for perfecting digital images and is ideal for professional photographers, serious amateur photographers, and graphic designers. In this Adobe Photoshop video tutorial, you'll learn how to use medical analysis tools in Photoshop CS4. For comprehensive instructions on using CS4's new medical analysis tools, take a look. Use medical analysis tools in Photoshop CS4 Extended.
Dr. Keith Johnson shows how to correctly sample a large round bale for forage analysis Learn how to determine the nutritional content of the livestock feed to make sure that the dietetic needs of the farm animals being fed are being met.
Matt covers some lines with a black ...Bg4. He found the first game with analysis on the Kenilworth Chess Club site. Most of the analysis he gave for this game is taken verbatim, but he does mention a couple side variations that you should be curious about. So watch!
Unlock the "Closer Analysis: Hidden Intel" trophy in Call of Duty: Black Ops! This achievement is won by finding the hidden intelligence documents in Missions 1, 2 & 4.
New to Microsoft Excel? Looking for a tip? How about a tip so mind-blowingly useful as to qualify as a magic trick? You're in luck. In this MS Excel tutorial from ExcelIsFun, the 253rd installment in their series of digital spreadsheet magic tricks, you'll learn how to use a data table for what-if analysis. You'll also learn about the PMT and see the formula equivalent to a data table.
In this scientific video tutorial, undergraduate students in a forensic chemistry lab demonstrate how to perform gunshot residue analysis (GSR). Learn how to perform gun shot residue analysis (GSR)! Just like in CSI.