
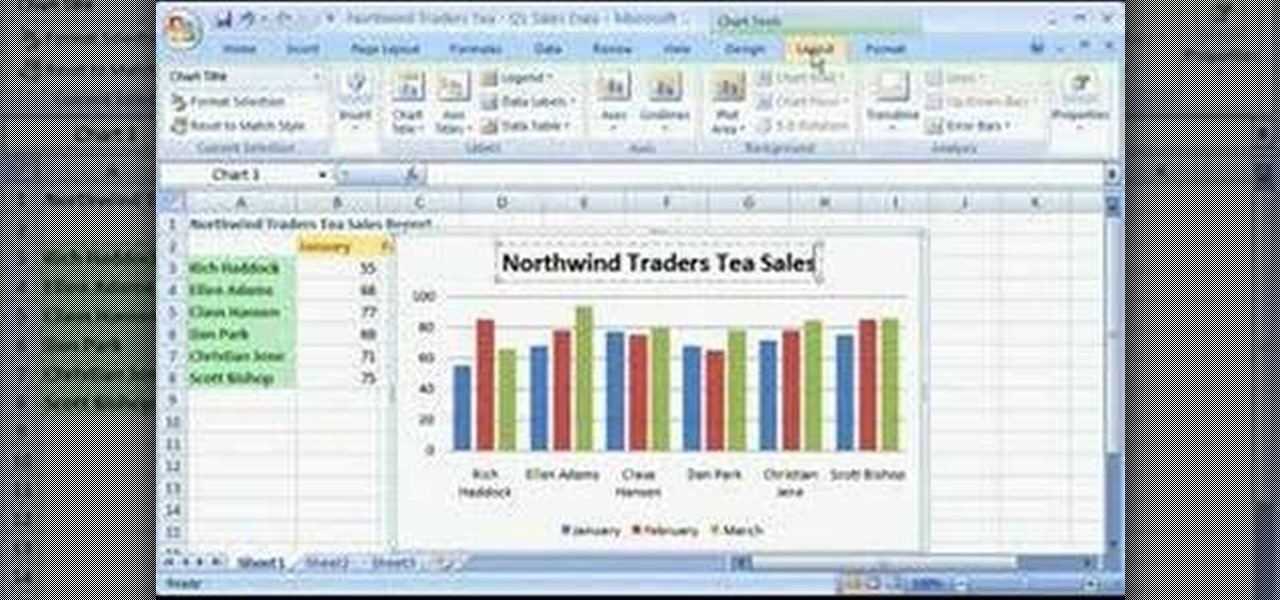
How To: Create charts and diagrams with Microsoft Excel
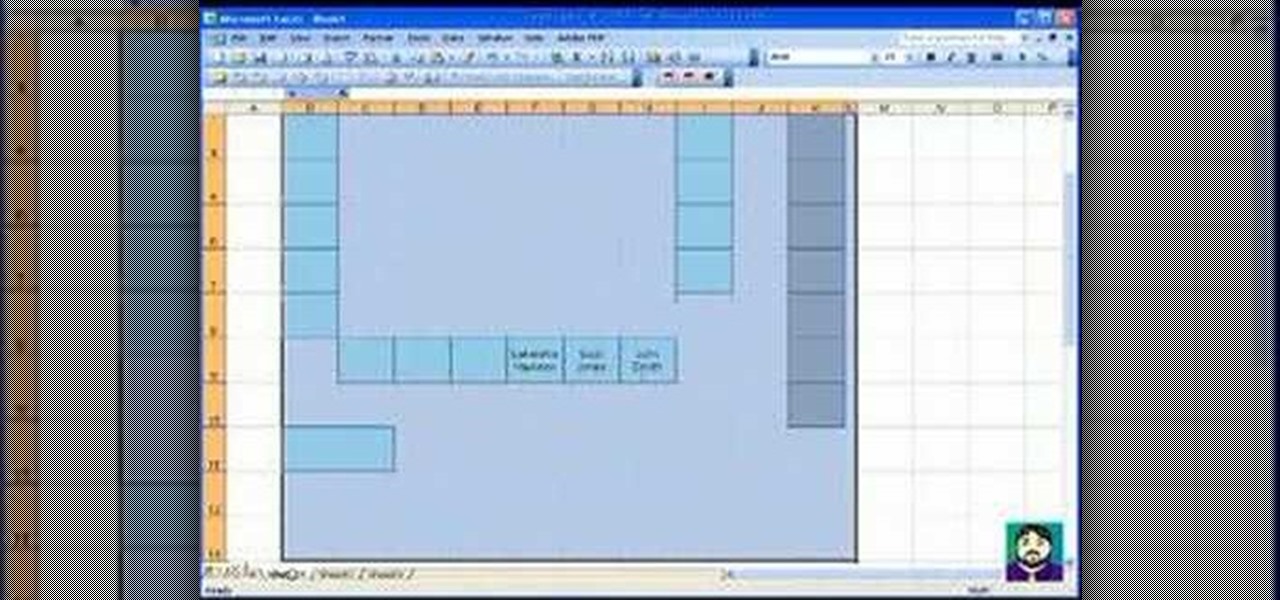
This tutorial demonstrates how to create charts and diagrams with Microsoft Excel by walking you through creating a seating chart in Excel.

This tutorial demonstrates how to create charts and diagrams with Microsoft Excel by walking you through creating a seating chart in Excel.
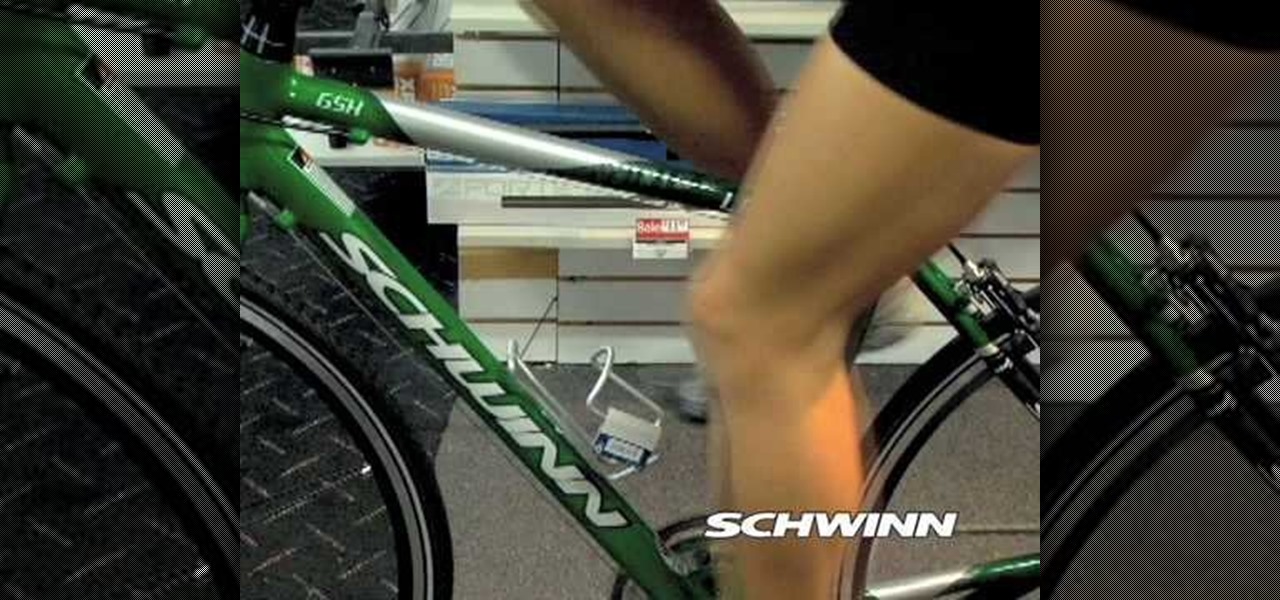
Jessi Stensland, professional triathlete, explains how selecting the right bike can mean the difference between a comfortable ride and possible neck, back, knee or shoulder pains. Stensland first takes us through finding the right bike size with charts such as those available on Schwinn bikes. After the right size is determined, riders should determine the proper fit by adjusting their bike's handlebars and seat. Lastly, Stensland instructs bike riders on how to choose the proper saddle.

If you think about it, your face is just another canvas, with makeup being the paint. You add highlights here to bring parts you want to emphasize forward, bronzer there to create fake shadows, and draw on patches of color (lips) or lines (eyes) to make things either pop or recess.
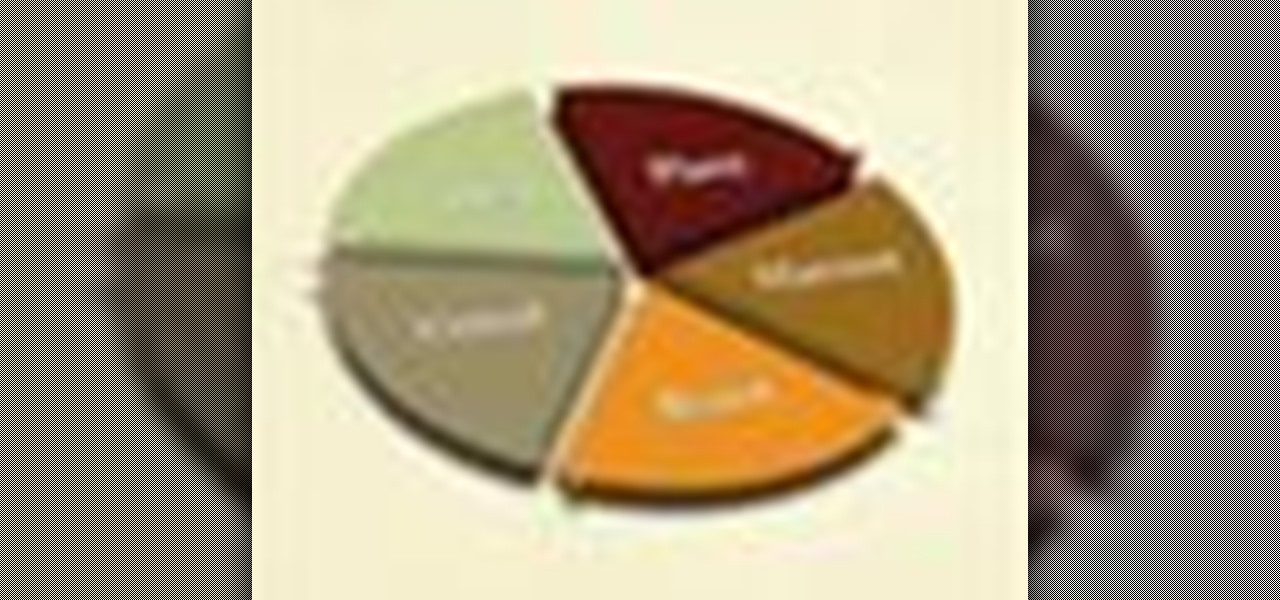
If you have a circular or semicircular protractor like the one used in this video, making a pie chart is as easy as – well — pie. This will teach you how to use your protractor to measure out each individual slice in your pie chart. Learn how to visualize statistical data through hand-drawn pie charts with this free video math lesson.

In this video the instructor shows how to create charts and graphs in Microsoft Word. First, open the Word document and select an area to insert the charts. Now go to the Insert tab in the ribbon and select the Chart icon. The Insert Chart window opens up with various chart templates. There are various categories of charts like Line, Pie, Bar in the left hand side. In the right hand side you can see the sample charts available and you can select any of them that you want. Now it transfers you...
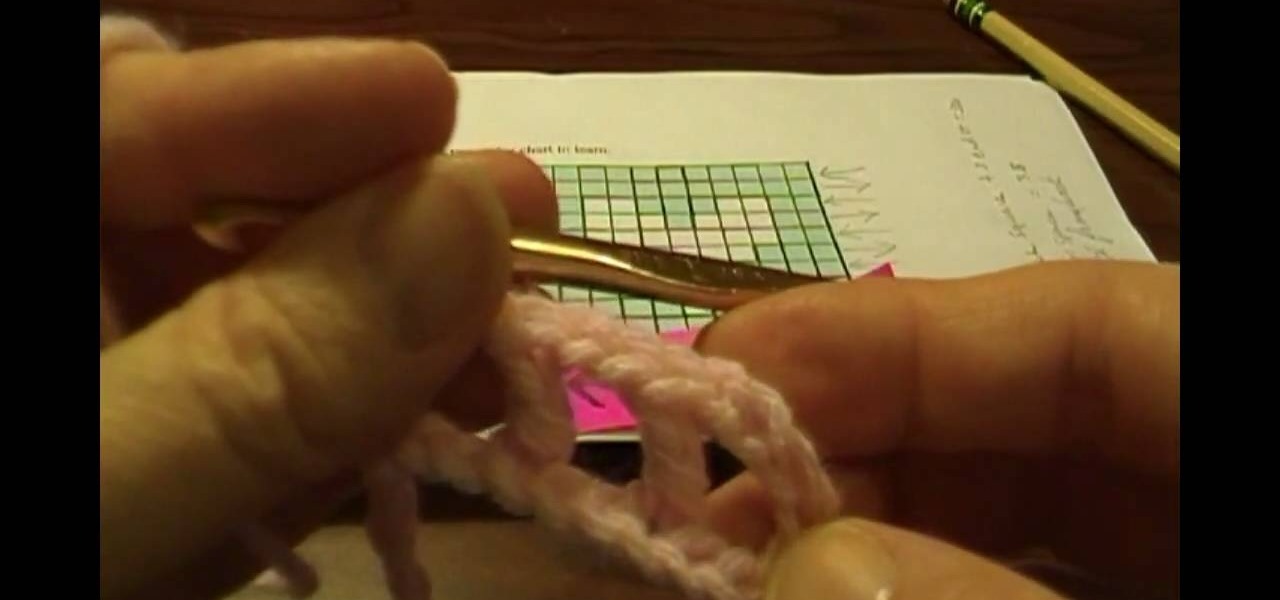
Learn how to crochet using a graph or chart in this six part vieo tutorial series. Filet crochet is lacy stitch - an easy technique - that can have beautiful results. Filet crochet patterns are usually made up of open meshes & solid meshes. Get the free simple heart chart used in this video here.
In this tutorial, we learn how to adjust the front seat and heater in the 2010 Prius. First, you will need to adjust your seats by lifting the lever in the front of the seat. Move up and down until it's comfortable. On the side of the seat is a lever which will move the seat up and down. The other lever behind that will move the seat back up and down until it's in the right place. There is also a button on the side that will change the lumbar support for your back. There is also an option ava...
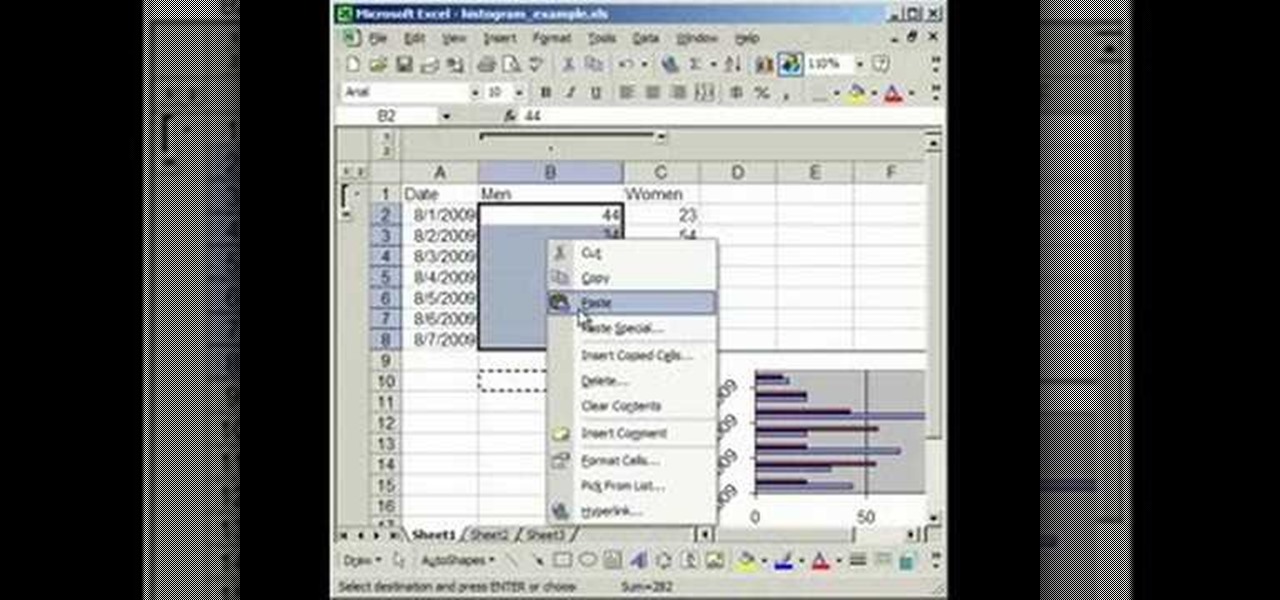
In this tutorial, we learn how to make a histogram chart in Excel. To create a vertical histogram, you will enter in data to the chart. Then, highlight all of the data and go to "insert", "chart", then choose a regular column chart. Grab a regular 2D column and then make sure your values are correct. Then, right click and go to "chart options", then take the legend off. Now, make these columns all touch each other by right clicking over the columns and formatting them. Go to "options" then ch...
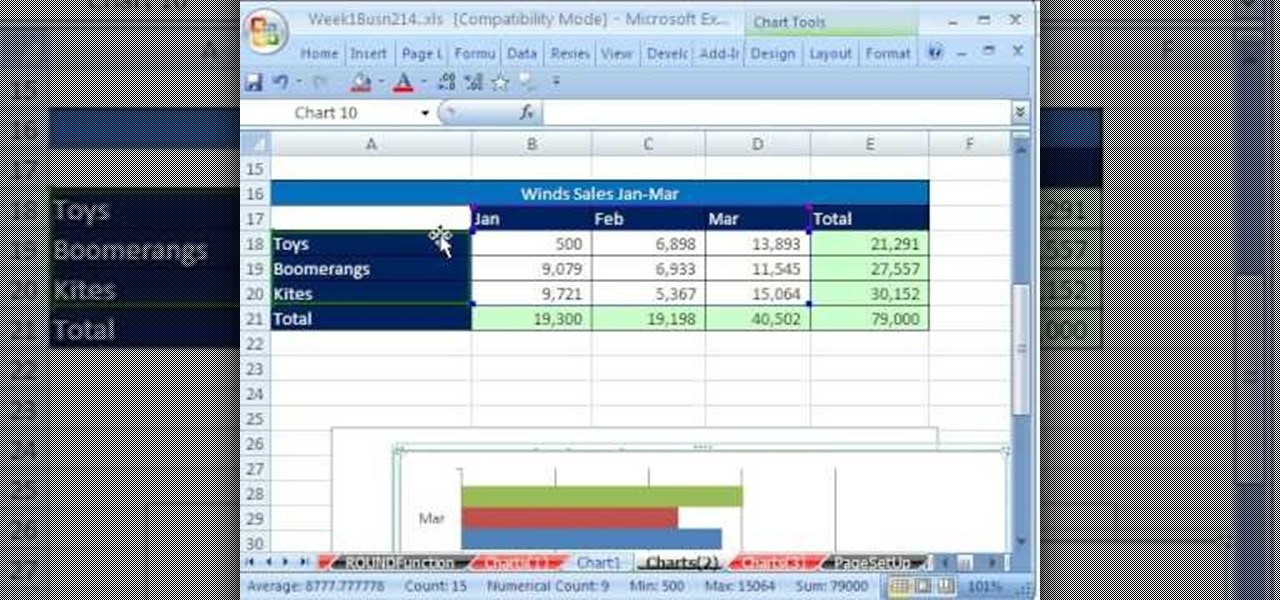
In order to format graphs and charts using Microsoft Word 2007, click on Chart Tools. The tabs at the top of the screen provides you with your options. You can change the type of chart or graph by clicking on Change Chart Type. If there is a particular type of chart that you would like to use again and again, then you can save it as a template via the Save As a Template icon. You can edit the data in your chart of graph by clicking on Edit Data. You can modify the chart layout by clicking on ...
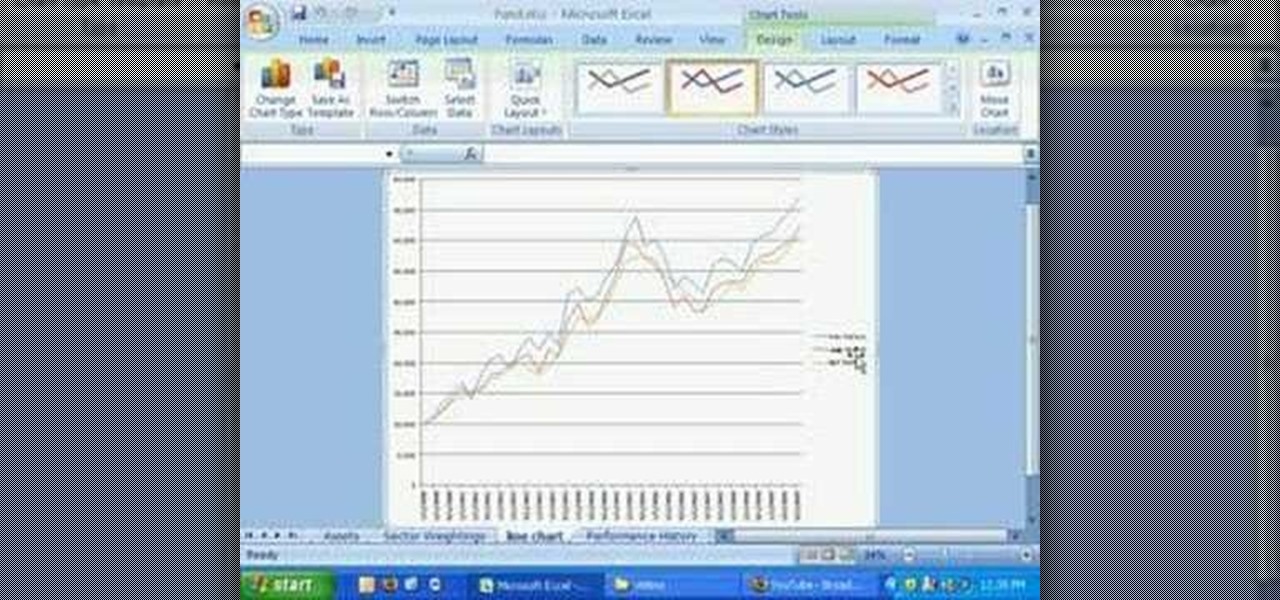
Whether you're interested in learning Microsoft Excel from the bottom up or just looking to pick up a few tips and tricks, you're in the right place. In this tutorial from everyone's favorite digital spreadsheet guru, ExcelIsFun, the 5th installment in his "Highline Excel Class" series of free video Excel lessons, you'll learn how to create seven types of charts — X-Y scatter diagrams, pie charts, column charts, bar charts, stacked bar charts, line charts, and column and line chart combined. ...

In this five-part video tutorial, learn how to double crochet intarsia using a graph or chart. Intarsia knitting is an advanced knitting method, used to knit with several colors of yarn. The simple heart chart used in this video is available here.
This video produced by Toyota USA shows an owner of a 2010 Toyota 4Runner how to use the 3rd row seats in this vehicle. First we learn that only certain 2010 Toyota 4Runners have the 3rd row seats that fold into the floor. Next we are shown how to raise the seats, to do so you simply pull down on the handle at the top of the seat and then raise the seat back into position. Next pull the seat base forward. Finally go to the rear of the vehicle and rotate the headrests into the upright position...
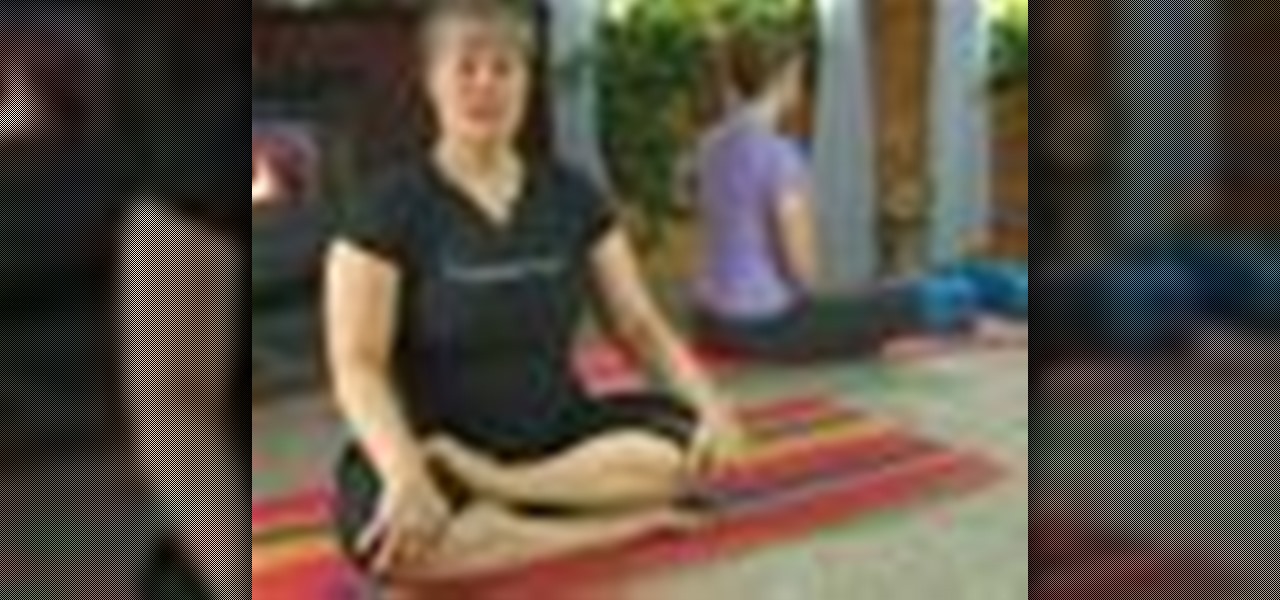
Yoga offers poses for many skill levels, and seated or supine poses can put less stress on some joints and body parts. Learn seated and supine yoga poses from an instructor in this free yoga video.

In this clip, learn how to change out the seat on your beach bike. This clip will show you exactly how to take that tough, standard seat that comes with your new bicycle and change it out with a comfier, better seat. The difference between a bumpy ride and a relaxing one is all in the seat cushion, so make sure you have one installed that best fits you.

Car accidents are the leading cause of death of children in the United States. Follow the guidelines in this how-to video to give your child a safe ride. All you'll need is the kid's new car seat and the owner's manual to your vehicle. Proper installation is key, so check out this instructional video to learn where and how to put that car seat in safely and correctly.
Check out this informative video tutorial from Apple on how to create and edit charts in Numbers '09.
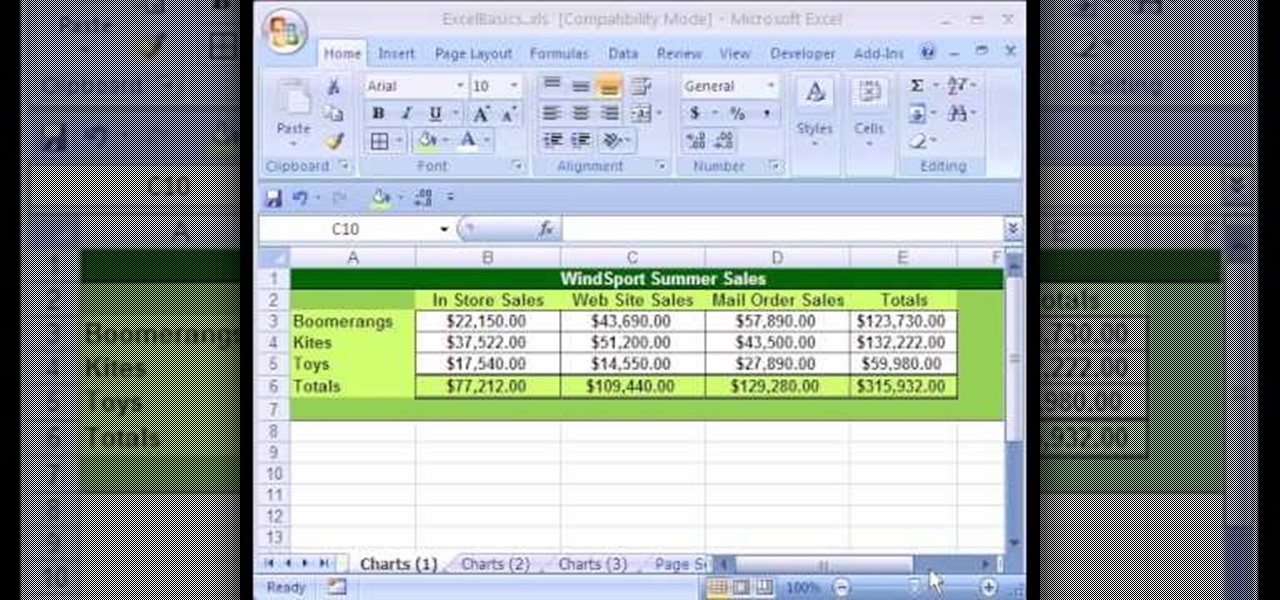
In this Excel basics video, the instructor talks about the basics of charts. There is an enormous difference in how you make charts between Microsoft Excel 2003 and 2007. In both the versions, to make charts the first thing you do is highlight the data cells in your workspace. Now use the toolbar and click on the charts button there. Now Excel automatically generates the charts based on the data and the column and row names. But there are various changes between the charts produced in the dif...

Learn how to make seat covers for furniture with expert sewing tips from a seamstress in this free online upholstery video series.
Whether you're interested in learning Microsoft Excel from the bottom up or just looking to pick up a few tips and tricks, you've come to the right place. In this tutorial from everyone's favorite digital spreadsheet guru, ExcelIsFun, the 31st installment in his "Highline Excel Class" series of free video Excel lessons, you'll learn how to build frequency tables and simple histogram charts in Microsoft Excel. Specifically, this video addresses the following subjects:

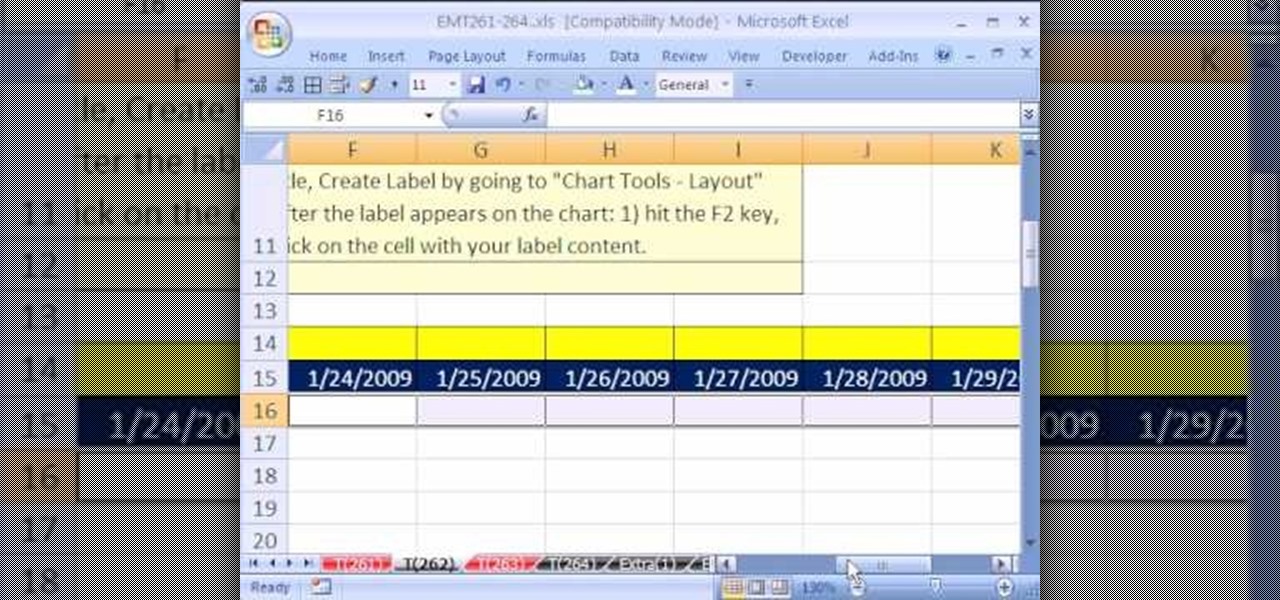
This video is from HelpVids and describes how to change the axis titles on charts in Microsoft Word 2007. To access the chart tools, select the chart and the tools will appear above the ribbon. There are many different design options that you can preview on the screen to make your final selection. To change the chart title, click on the Chart Title button which is located on the Layout ribbon. You can then select where you would like the title to appear. Once you select the location you can t...
Namuoc demonstrates how to create a line chart in Excel. To create a simple line chart in Excel 2007, first highlight the cells in your worksheet that you would like to include in the chart. Then, select the insert tab on the top of the worksheet toolbar. Next, click on the line option. Select the two dimensional line graph option from the given choices. Move the chart to a new sheet. Label the new sheet in the appropriate field and click the OK button. Your line chart will now be created usi...
New to Excel? Looking for a tip? How about a tip so mind-blowingly advanced as to qualify as a magic trick? You're in luck.

This video shows you how to adjust the second-row seats in a 2010 Toyota 4 Runner. The 4 Runner comes with a 40-20-40 split folding second-row seat. To fold the second-row seat, pull up on the strap to pivot the bottom of the seat forward, then push the head rest into the down position. Lift the lever on the outside of the seat to fold the seat back forward. The seat backs recline by leaning forward and pulling up on the lever and leaning back to desired position. The seat also has a center a...
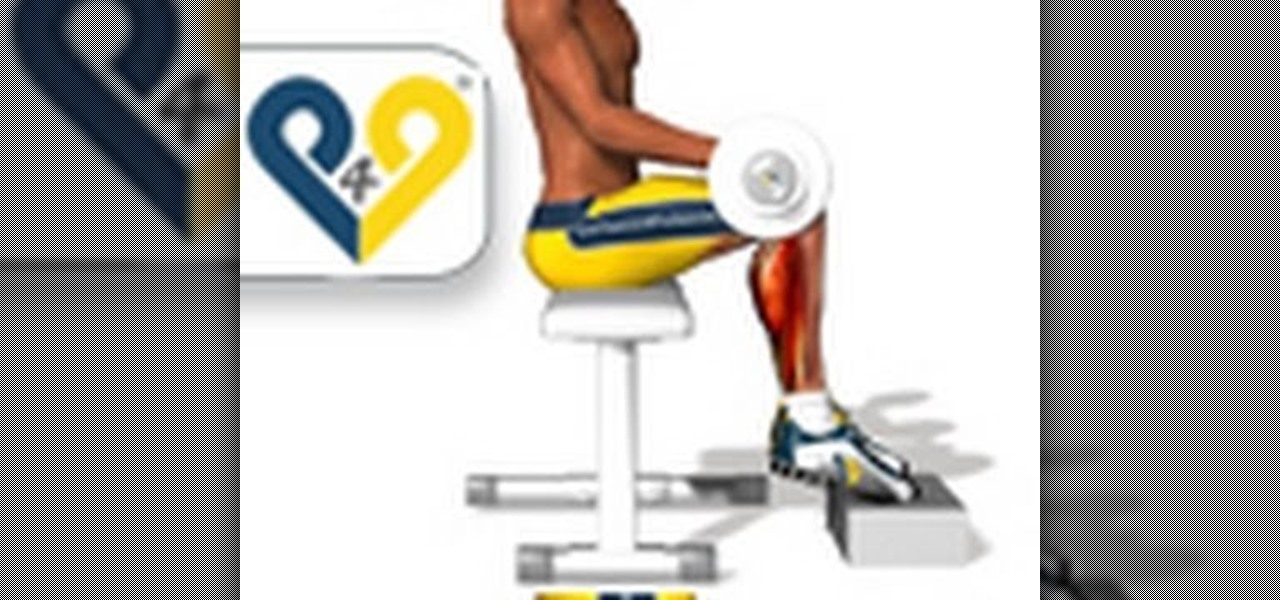
In order to get those Incredible Hulk shoulders and pectorals, you have to do lots of seated presses with heavy dumbbells. It's not exactly fun, we know, but soon enough you'll have big guns hefty enough to wrestle the best of them.

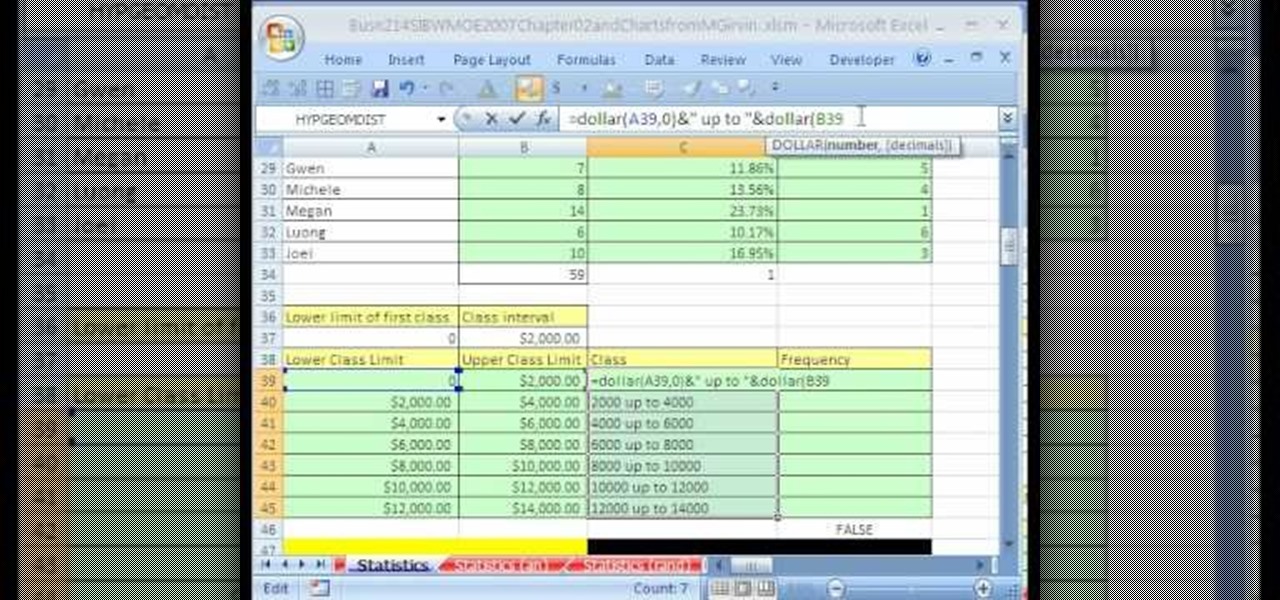
If you use Microsoft Excel on a regular basis, odds are you work with numbers. Put those numbers to work. Statistical analysis allows you to find patterns, trends and probabilities within your data. In this MS Excel tutorial from everyone's favorite Excel guru, YouTube's ExcelsFun, the 22nd installment in his "Excel Statistics" series of free video lessons, you'll learn how to create a percent (%) cumulative frequency distribution with formulas, a histogram and an ogive chart. See how to add ...
Too lazy to even stand up to exercise today? No problemo, because you can complete an entire circuit of exercises without ever leaving your chair!

In this video, we learn how to change your toilet into a silent toilet seat. A silent toilet seat will shut itself by going down slowly without the loud slam. To remove the old toilet seat, go to the back flaps and pop them up. Remove the plastic screws with a screwdriver and then set them aside. Replace this with your new toilet seat and screw the screws back into the back. Now, lift your seat and the lid up and tap them gently. After this, the toilet seat will slowly start to lower and clos...
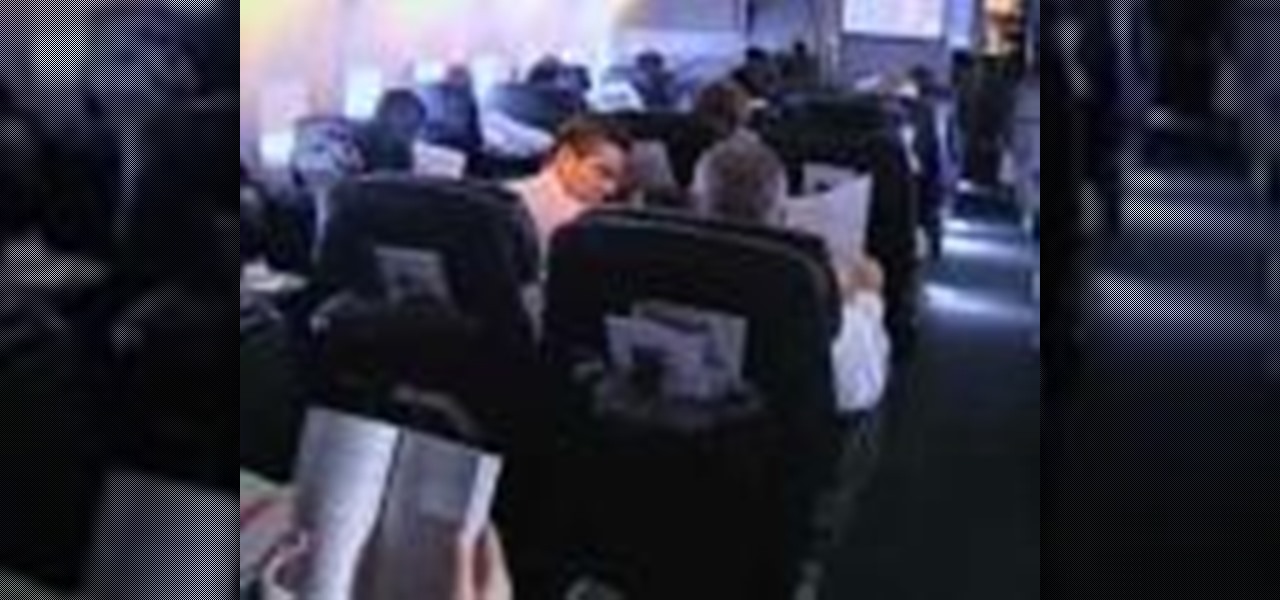
The politics of getting a good seat on a commercial flight are difficult to navigate and not fighting for a good seat can leave you uncomfortable for hours and wrecked when you arrive at your destination. This video features a travel expert outlining some tips for getting good seats on airplanes. Tips include joining a frequent flyer program and buying your tickets online, where you can often pick your seats.
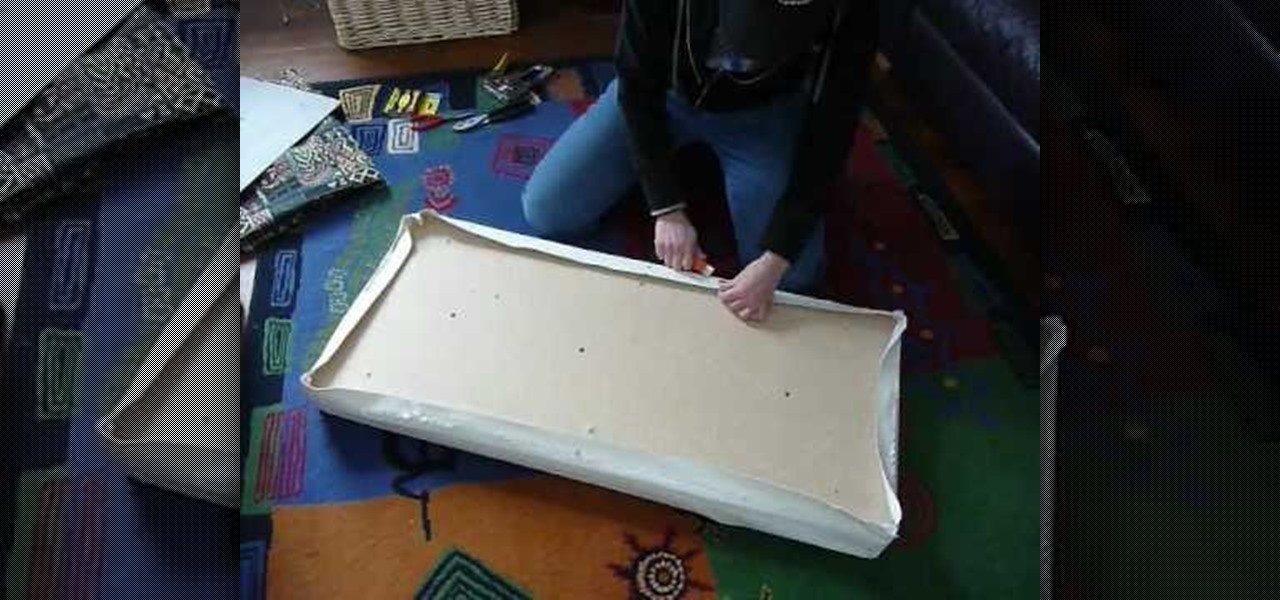
Over time, a bench seat can become worn out and tattered making for an ugly looking thing. If you don't know how to re-cover a bench seat, then this tutorial is what you'll need. This video shows you how to take new material and apply it to the cushions of your bench seat. It's an easy process that will result in a great looking piece of furniture. Enjoy!
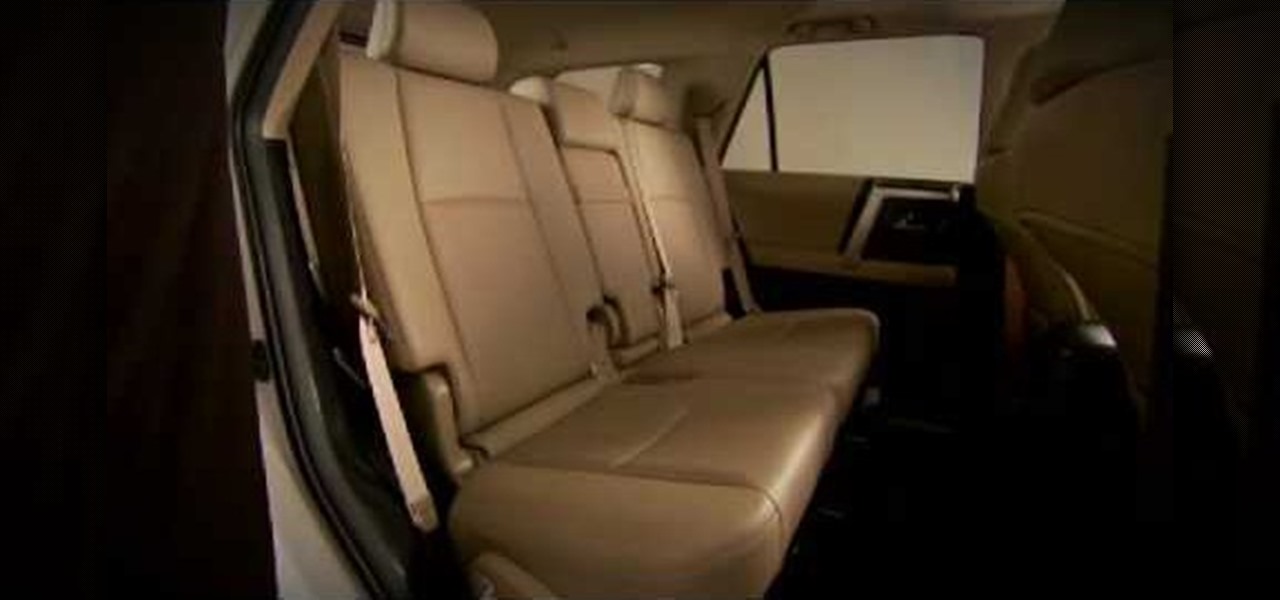
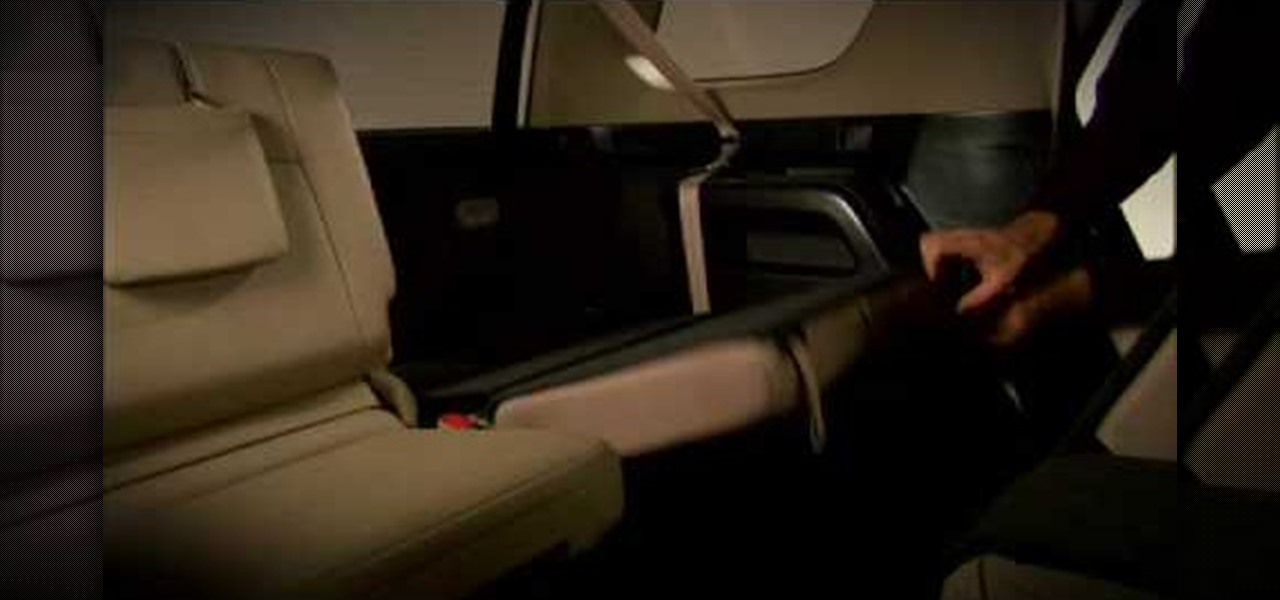
This video displays a 2010 Toyota 4Runner, modeled with seating for seven passengers. In the tutorial it shows a few of the basic adjustments that can be made to the seating. You can adjust the seat to recline to your comfort level and move to seat forward and backward. Unlike most 4Runner model this one comes with an additional back row of seating. This can be accessed simply by pulling the bottom lever of the backseat and pushing the seat forward.
Check out this tutorial and learn how to create chars in Excel 2007. In Office Excel 2007, you just select data in your worksheet, choose a chart type that best suits your purpose, and click. Want to try a different chart type? Just click again and select a new chart type from a huge range of possibilities. Then work with the new Chart Tools to customize the design, layout, and formatting of your chart. You can see how various options would look just by pointing at them.
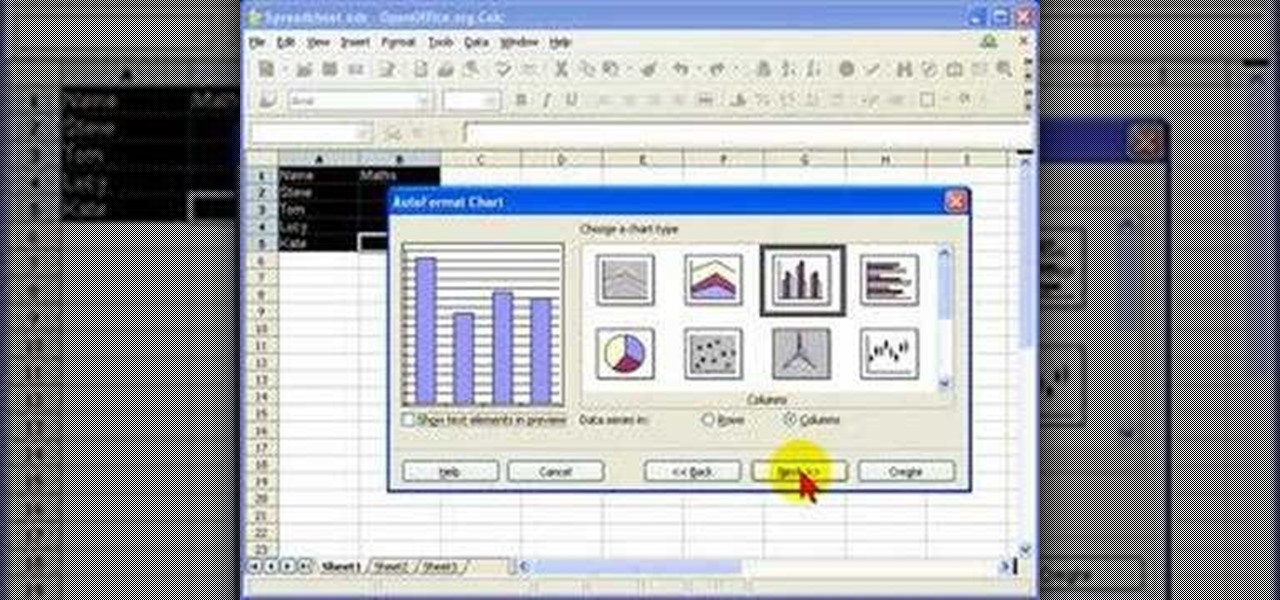
In this screencast tutorial, Steve shows you how to quickly and simply create a bar chart, from the data you have entered into your worksheet in Open Office Calc. If you're looking for a simple and clear way to represent your statistical data, then a simple bar chart is an option you should look at using. So check out this tutorial and start making OpenOffice Calc bar charts today.
Dull and drab bulleted lists are no longer necessary with the help of PowerPoint 2008 for Mac. When you make a bullet list in PowerPoint, you can now transform those boring text charts with actual visual charts and graphs and more. The Microsoft Office for Mac team shows you just how to convert text to a SmartArt graphic in this how-to video.
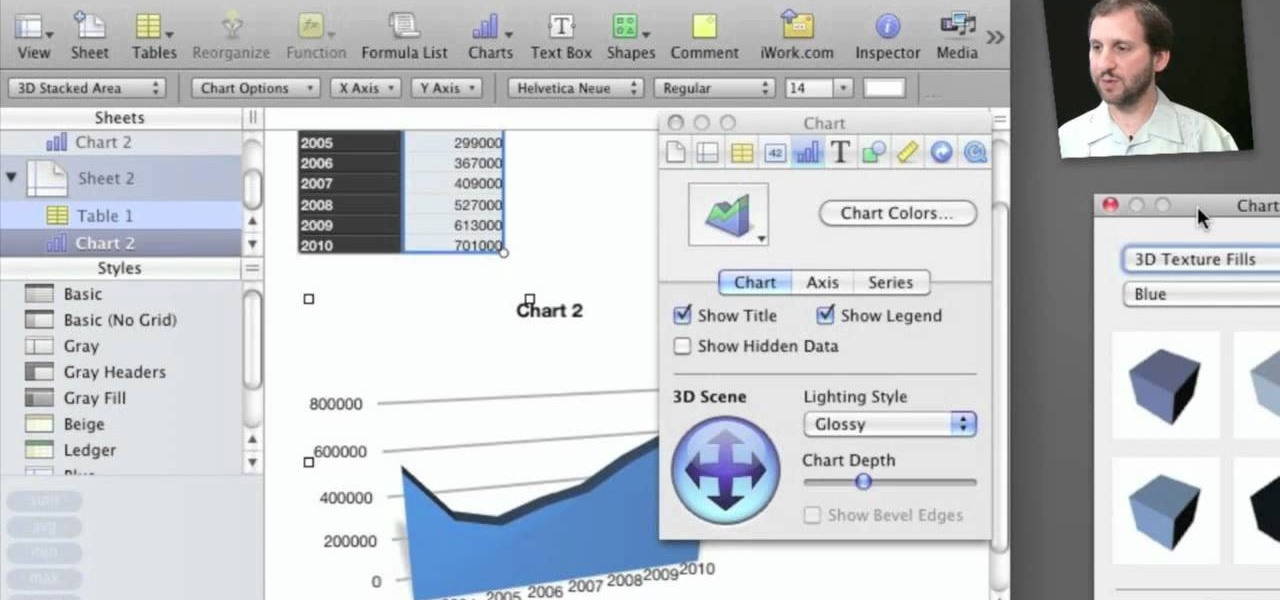
In this video tutorial, you'll learn how to generate and customize the look of simple charts within the iWork '09-version of Numbers. For all the details, including step-by-step instructions, and to get started creating your own charts, take a look.
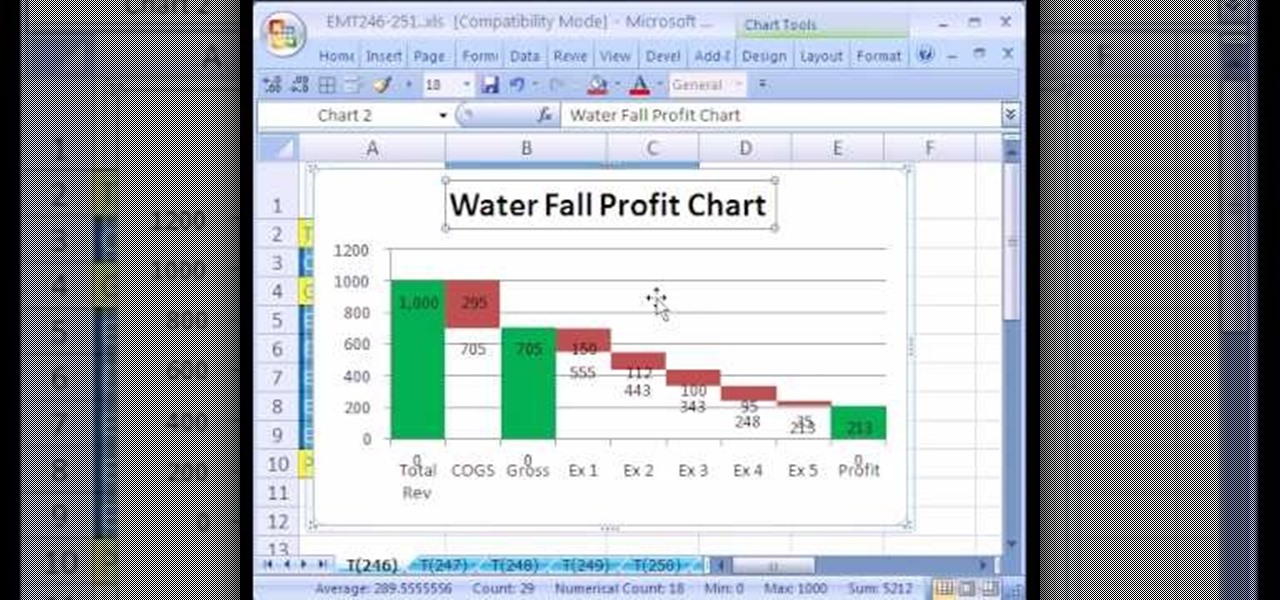
New to Excel? Looking for a tip? How about a tip so mind-blowingly useful as to qualify as a magic trick? You're in luck. In this Excel tutorial from ExcelIsFun, the 246th installment in their series of digital spreadsheet magic tricks, you'll learn how to create a waterfall profit chart from a stacked column chart.

There are two ways to properly lock your seat belt. You can use the childlock auto adhjustment. Or you can recline the seat, but then push forward to make your seat belt very tight. You don't want to be flopping around in the car. The bottom of your wrist is on top of the steering wheel and your shoulder is in the seat. It will loosen up when you get on the track.
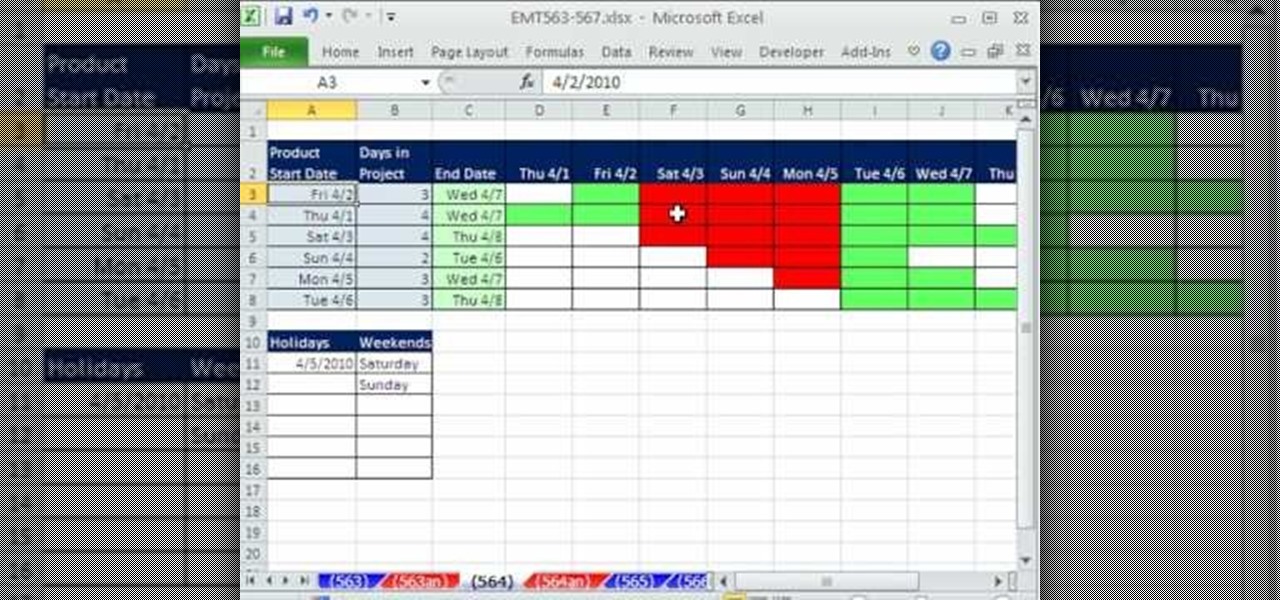
New to Excel? Looking for a tip? How about a tip so mind-blowingly advanced as to qualify as a magic trick? You're in luck. In this two-part Excel tutorial from ExcelIsFun, the 564th installment in their series of Excel magic tricks, you'll learn how to create a cell chart using conditional formatting with Logical TRUE FALSE formulas to create a Gantt Chart. Functions used include WORKDAY, AND, NOT, NETWORKDAY.
This video will show you how to create a flow chart in MS Word 2007. First click on the Insert tab. You can see the smart art option, click on it. A "Smart Art Graphic" window will appear.
Don't get stuck in a middle seat near a bathroom on your next flight. With a little time and effort, you can be sitting pretty. With more and more airlines offering advance seat booking, it's easier to get a little more leg room, or peace and quiet. Watch this video travel tip tutorial and learn how to pick a great airline seat.

New to Excel? Looking for a tip? How about a tip so mind-blowingly useful as to qualify as a magic trick? You're in luck. In this Excel tutorial from ExcelIsFun, the 124th installment in their series of digital spreadsheet magic tricks, you'll learn how to create a box plot or box-&-whisker chart using a stacked bar chart and a open-high-low-close stock chart. You'll also learn how to use the QUARTILE function.