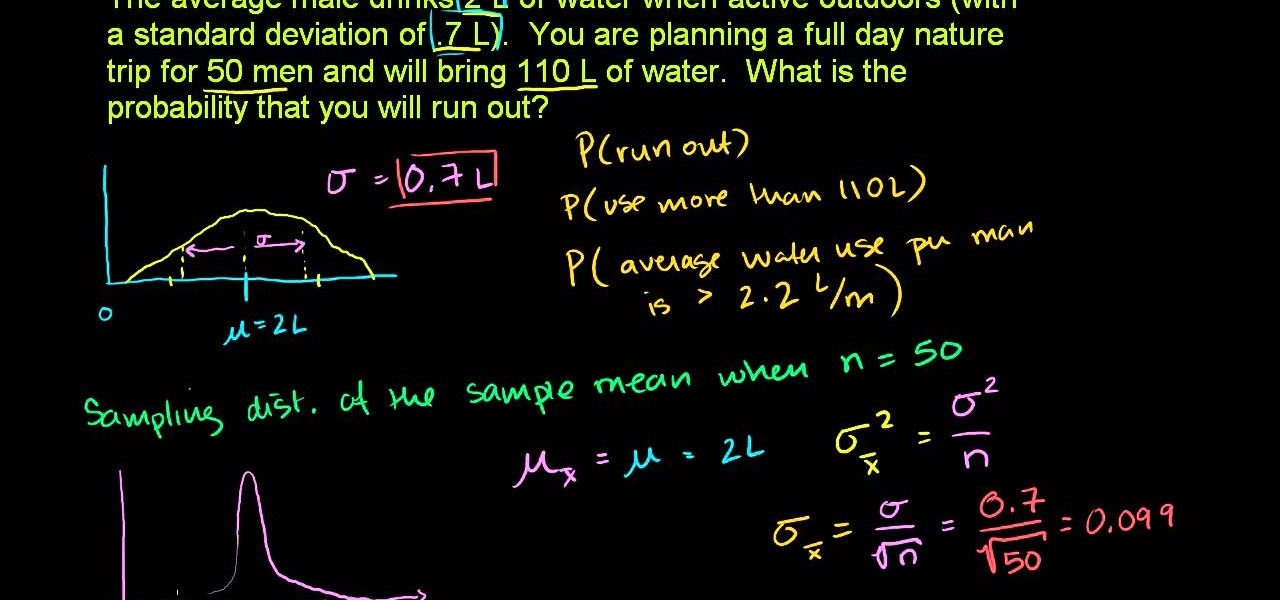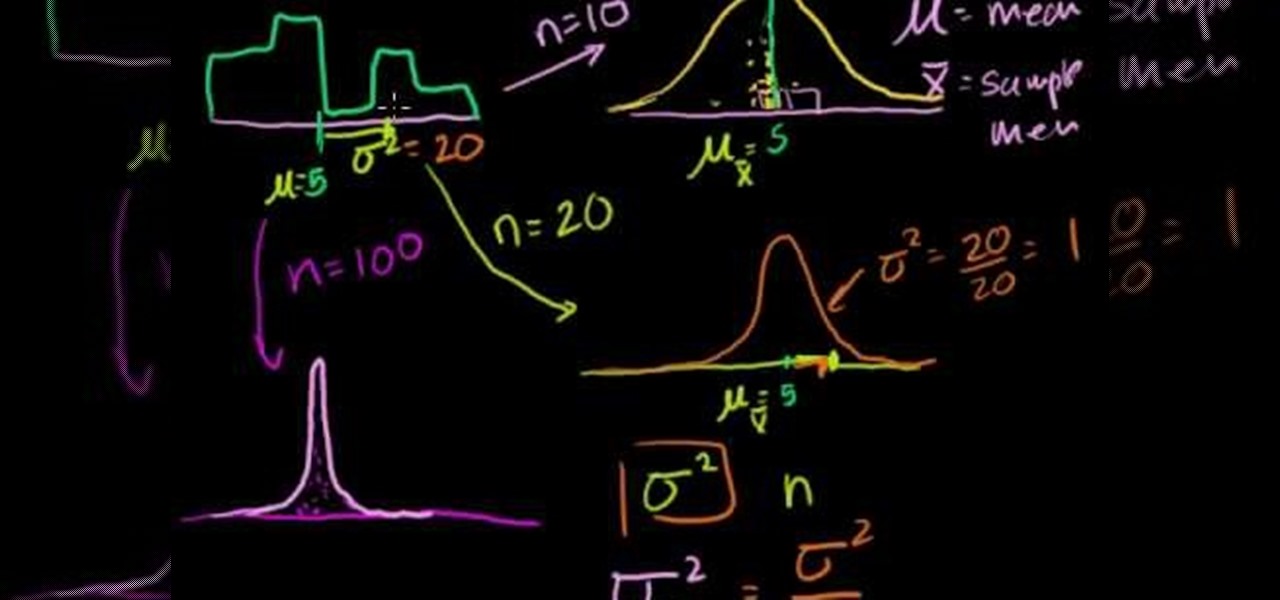
In this video the tutor explains about the standard error of the mean. He starts explaining by drawing the diagram of a distribution and now he takes ten samples from the distribution and starts plotting them. He says that in theory if we do it infinite times then we can obtain the sampling distribution of the sampling mean. For the example he takes the number of samples as 10. Now depending on these values of n we can get different sampling distributions. Now he intends to find the mean of t...
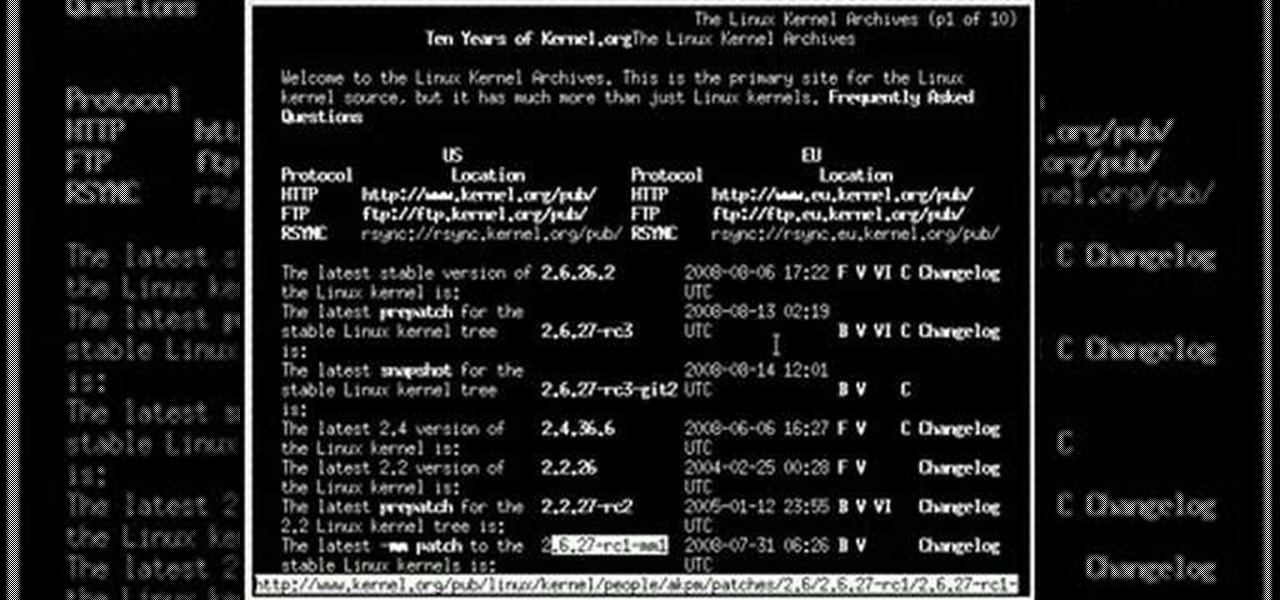
In this four-part video tutorial series, you'll learn how to compile a Linux kernel on a Debian-based system (e.g., Ubuntu). You'll learn two separate methods for kernel compilation, both (1) how to make the kernel into a Debian package, which can be handy if you're using a package manager and (2) how to install the kernel manually with make and make install. Take a look!
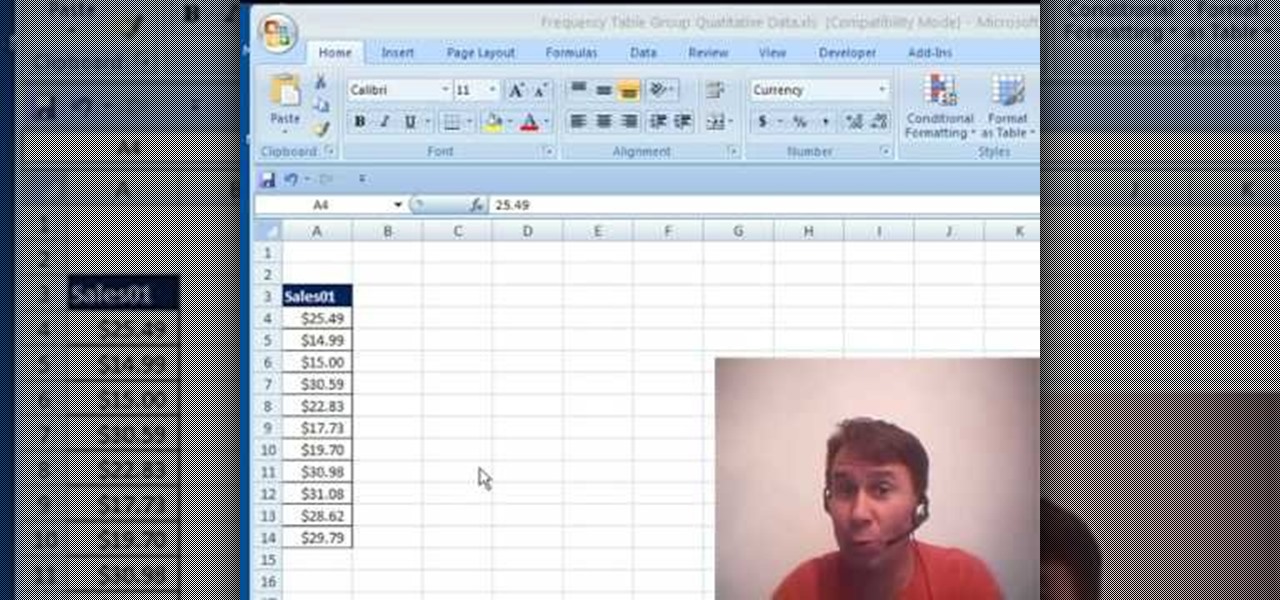
If you use Microsoft Excel on a regular basis, odds are you work with numbers. Put those numbers to work. Statistical analysis allows you to find patterns, trends and probabilities within your data. In this MS Excel tutorial from everyone's favorite Excel guru, YouTube's ExcelsFun, the 15th installment in his "Excel Statistics" series of free video lessons, you'll learn how to use create a frequency distribution, relative frequency distribution, percent frequency distribution and pie chart wi...
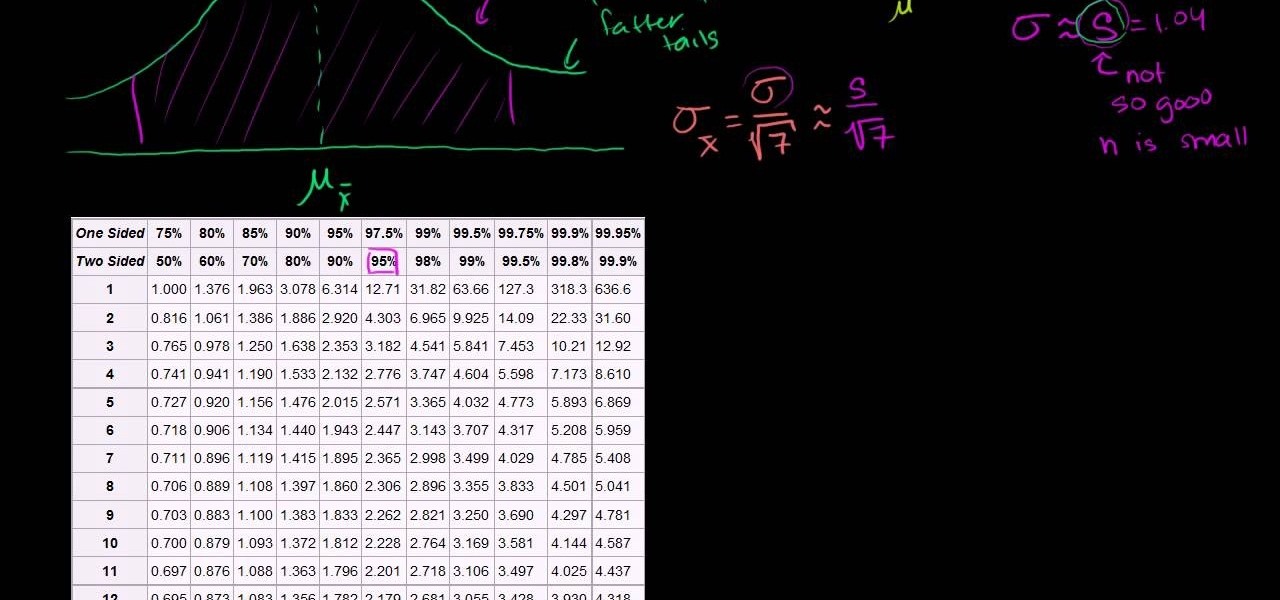
Learn how to build small sample size confidence intervals using t-distributions. From Ramanujan to calculus co-creator Gottfried Leibniz, many of the world's best and brightest mathematical minds have belonged to autodidacts. And, thanks to the Internet, it's easier than ever to follow in their footsteps. With this installment from Internet pedagogical superstar Salman Khan's series of free math tutorials, you'll learn how to construct a small size sample confidence interval using t distribut...
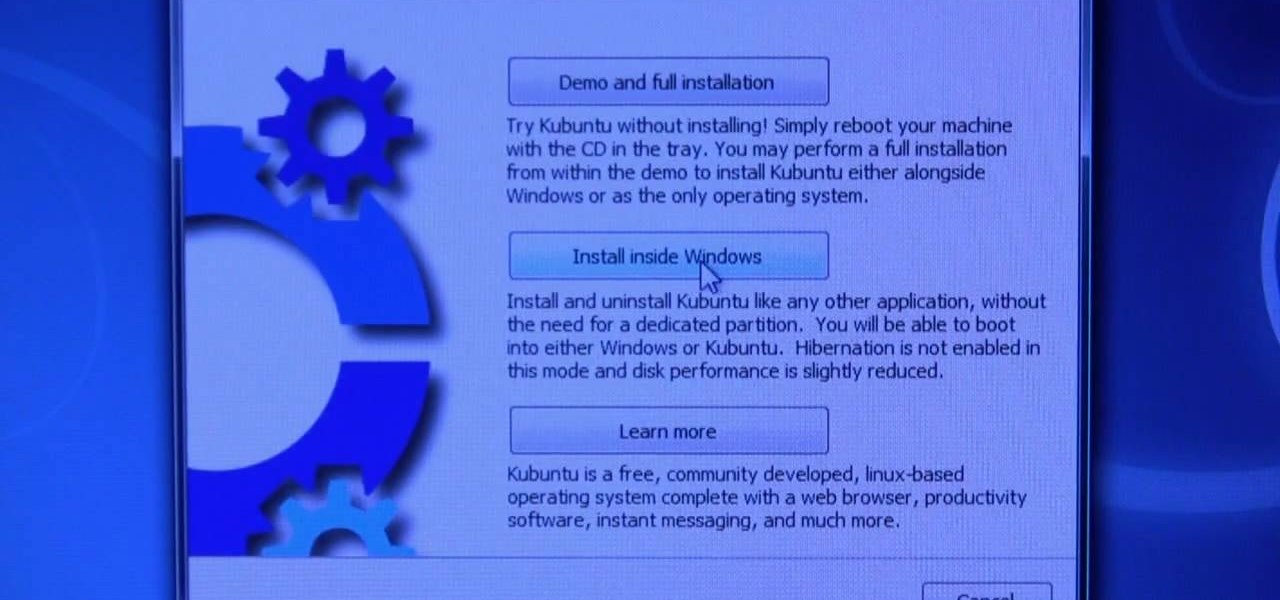
This video describes basics about using Wubi installer for Ubuntu in Windows operating system.Wubi installer is usually used for Ubuntu family distribution installations.You can download Wubi installer from the Internet and then it will install all desired distribution automatically or you can run installer from CD or DVD.In this example Wubi is installed from Kubuntu live DVD.After inserting DVD into your computer's disk drive autoplay function offers to run Kubuntu installer. If you don't h...

With the Group Text app, you can easily set up a distribution list so you can send out text messages to large numbers of people at once. You can also set up form templates, which are useful if you tend to send out a similar text message each time. This short tutorial shows you how to set up the distribution list, and how to get the most out of your Group Text. You can even set up multiple distribution lists for different topics or texts!

FreshDV had the opportunity recently to speak with Jerome Courshon on the marketing and distribution of movies and films. Jerome offers a full course in the “Secrets of Distribution” . If you are a filmmaker of any kind you owe it to your crew, your cast and yourself to watch this segment. From contracts, residuals, and pitfalls to avoid Jerome covers the 101 basics of film distribution and helps prepare you for what you need to know once the ink dries on the DVDs. In Jerome’s words:
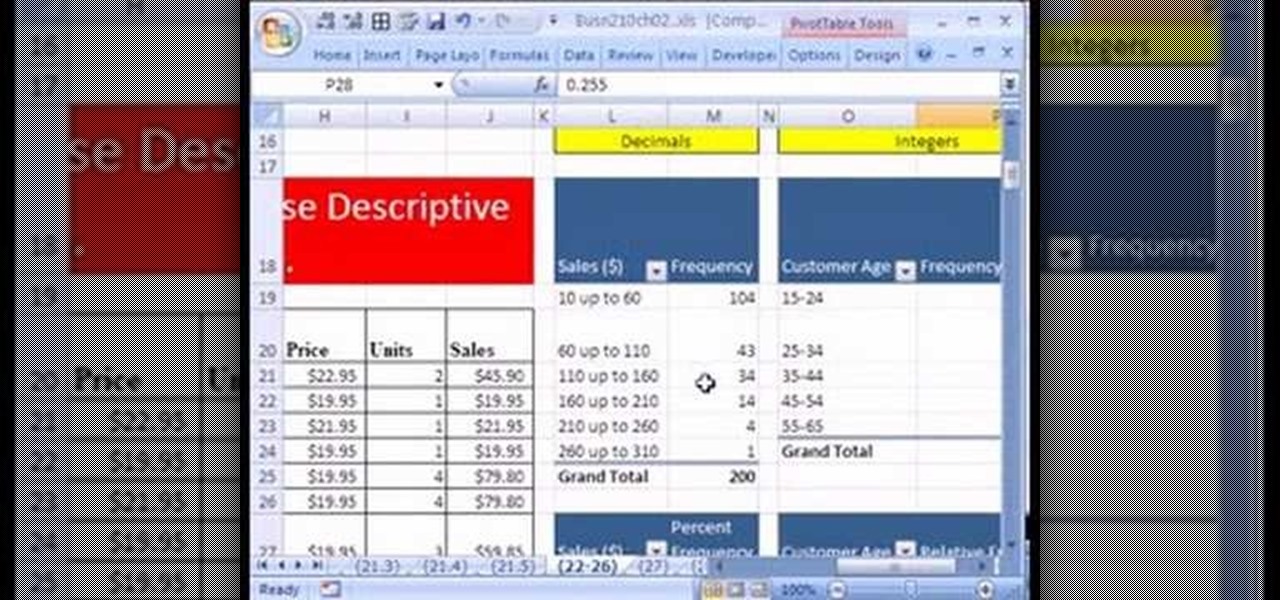
If you use Microsoft Excel on a regular basis, odds are you work with numbers. Put those numbers to work. Statistical analysis allows you to find patterns, trends and probabilities within your data. In this MS Excel tutorial from everyone's favorite Excel guru, YouTube's ExcelsFun, the 26th installment in his "Excel Statistics" series of free video lessons, you'll learn how to create quantitative data cumulative frequency distributions with pivot tables.
If you use Microsoft Excel on a regular basis, odds are you work with numbers. Put those numbers to work. Statistical analysis allows you to find patterns, trends and probabilities within your data. In this MS Excel tutorial from everyone's favorite Excel guru, YouTube's ExcelsFun, the 19th installment in his "Excel Statistics" series of free video lessons, you'll learn how to group categories in a frequency distribution with a formula (2 COUNTIF) and the pivot table (PivotTable) grouping fea...
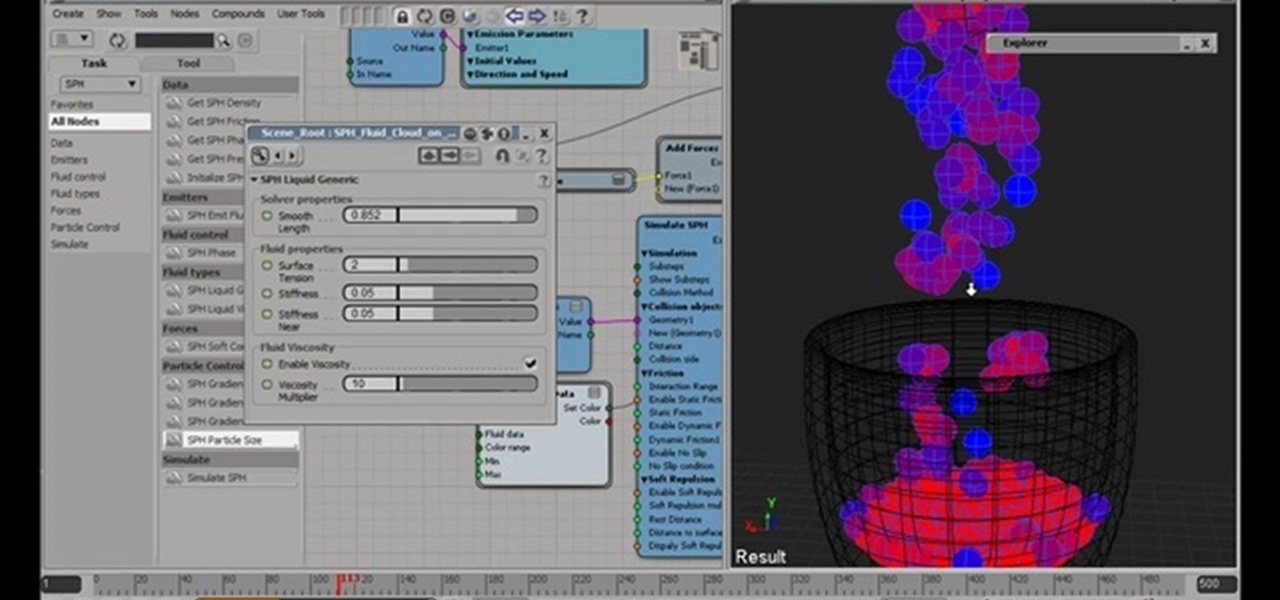
This is a tutorial on the SPH fluids nodes. This is a particle-based distributed fluid simulator application designed for Hewlett-Packard Scalabe Visualization Array. This application uses volume domain distribution among the nodes.
If you use Microsoft Excel on a regular basis, odds are you work with numbers. Put those numbers to work. Statistical analysis allows you to find patterns, trends and probabilities within your data. In this MS Excel tutorial from everyone's favorite Excel guru, YouTube's ExcelsFun, the 44th installment in his "Excel Statistics" series of free video lessons, you'll learn how to use the SKEW function to calculate the skew in a distribution of data.
If you use Microsoft Excel on a regular basis, odds are you work with numbers. Put those numbers to work. Statistical analysis allows you to find patterns, trends and probabilities within your data. In this MS Excel tutorial from everyone's favorite Excel guru, YouTube's ExcelsFun, the 21st installment in his "Excel Statistics" series of free video lessons, you'll learn how to build labels and counting formulas for a frequency distribution.
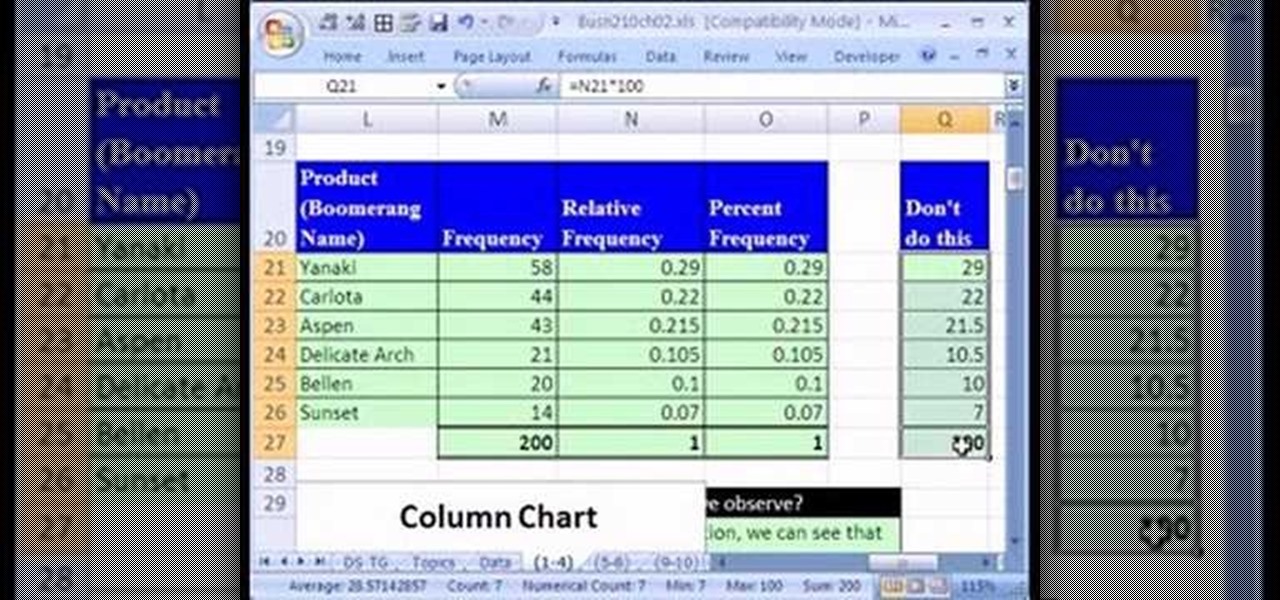
If you use Microsoft Excel on a regular basis, odds are you work with numbers. Put those numbers to work. Statistical analysis allows you to find patterns, trends and probabilities within your data. In this MS Excel tutorial from everyone's favorite Excel guru, YouTube's ExcelsFun, the 13th installment in his "Excel Statistics" series of free video lessons, you'll learn how to create a column chart from a frequency distribution for categorical data.
See how to install part number 7903 the Draw-Tite weight distribution assembly for our 1200 pounds tongue weight and 12000 pounds trailer weight. This video uses a Dodge Ram Pickup but it can be used on any truck.
If your iPhone is a business tool for you, you'll want ways to send out mass e-mails, either to your customers or employees and coworkers. You can use the iEDL, or Email Distribution App, published by MerckTech, to set up a distribution list that will let you send out mass emails as often as you need. This video shows you all the ins and outs of this awesome little app. Expand your productivity and marketing reach for your business and personal projects!
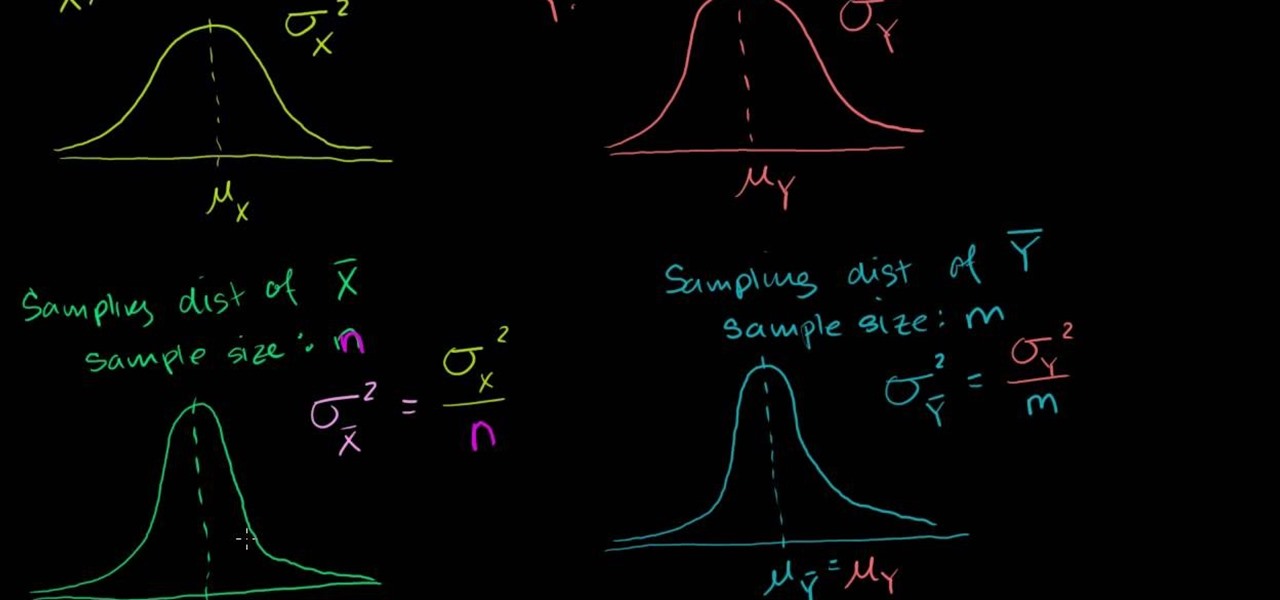
From Ramanujan to calculus co-creator Gottfried Leibniz, many of the world's best and brightest mathematical minds have belonged to autodidacts. And, thanks to the Internet, it's easier than ever to follow in their footsteps. With this installment from Internet pedagogical superstar Salman Khan's series of free math tutorials, you'll learn how to find the sampling distribution for the difference between means.
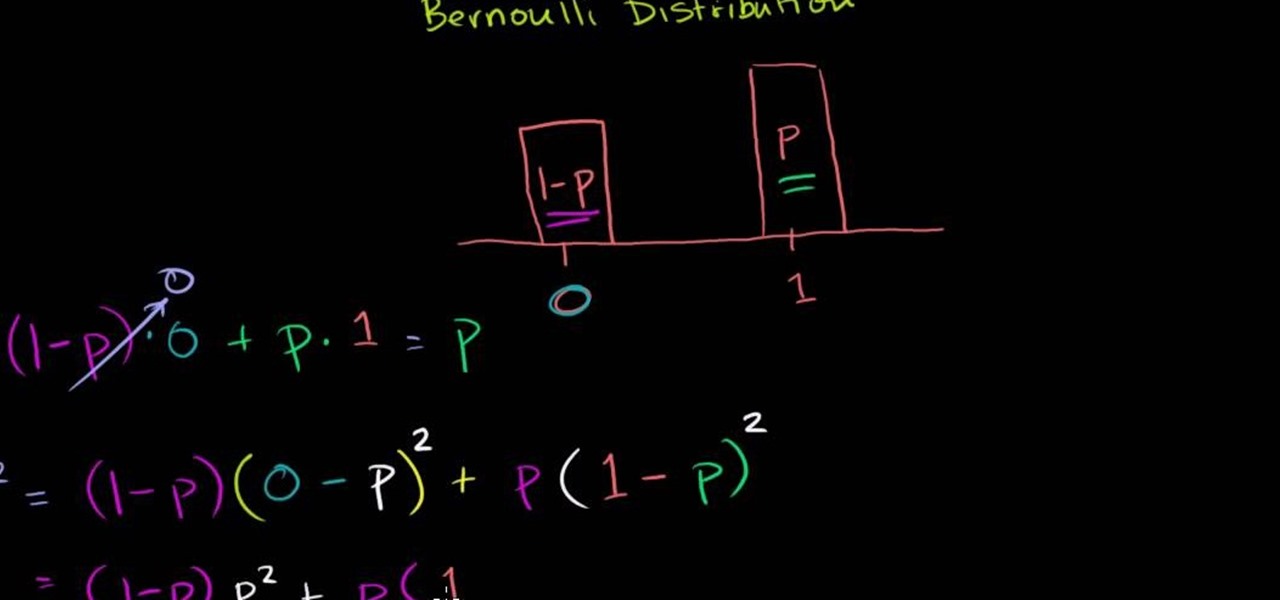
From Ramanujan to calculus co-creator Gottfried Leibniz, many of the world's best and brightest mathematical minds have belonged to autodidacts. And, thanks to the Internet, it's easier than ever to follow in their footsteps (or just study for that next big test). With this installment from Internet pedagogical superstar Salman Khan's series of free math tutorials, you'll learn how to calculate mean and variance for a Bernouilli distribution.
From Ramanujan to calculus co-creator Gottfried Leibniz, many of the world's best and brightest mathematical minds have belonged to autodidacts. And, thanks to the Internet, it's easier than ever to follow in their footsteps (or just study for that next big test). With this installment from Internet pedagogical superstar Salman Khan's series of free math tutorials, you'll learn how to calculate sample distribution in statistics.
From Ramanujan to calculus co-creator Gottfried Leibniz, many of the world's best and brightest mathematical minds have belonged to autodidacts. And, thanks to the Internet, it's easier than ever to follow in their footsteps (or just study for that next big test). With this installment from Internet pedagogical superstar Salman Khan's series of free math tutorials, you'll learn how to calculate the mean and variance of a Bernouilli distribution.
In need of a general (and quick) introduction to the Ubuntu GNU/Linux distribution or just Linux more generally? Let this video be your guide. For more information, and to learn more about Ubuntu Linux, watch this home-computing how-to from the folks at Butterscotch.
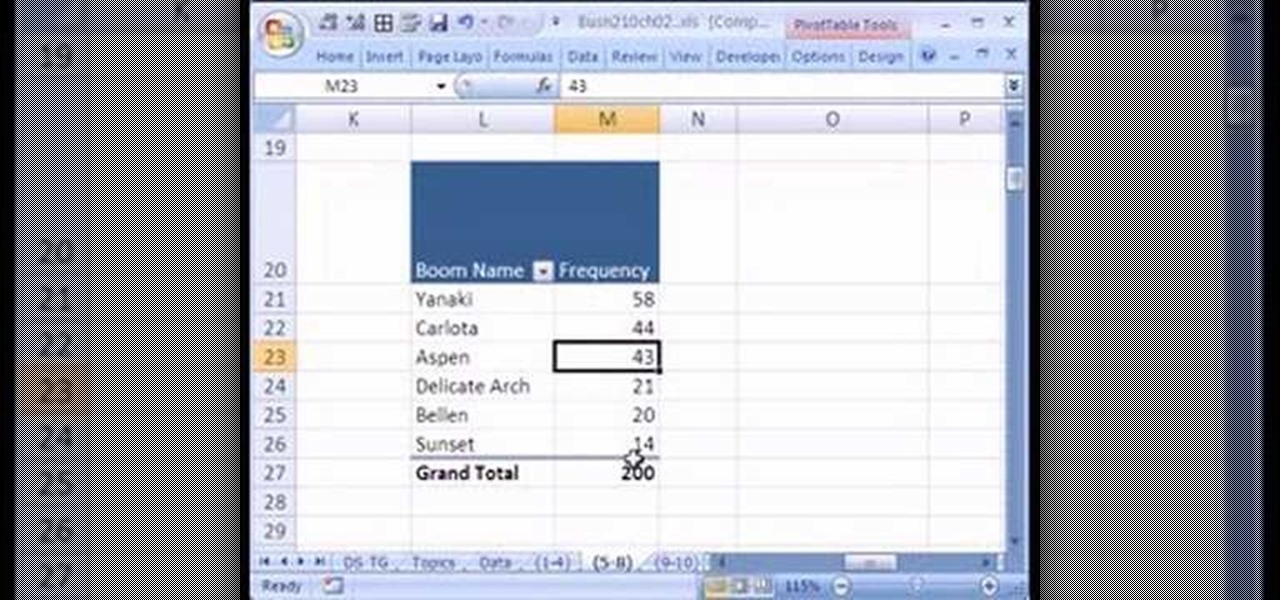
New to Microsoft Excel? Looking for a tip? How about a tip so mind-blowingly useful as to qualify as a magic trick? You're in luck. In this MS Excel tutorial from ExcelIsFun and Mr. Excel, the 15th installment in their joint series of digital spreadsheet magic tricks, you'll learn how to use a pivot table with grouping and a count function to create a frequency distribution.
A histogram is a summary graph showing a count of data points that fall in various ranges. Histograms are used in statistics and other forms of mathematics. In this video, learn how to create your own histogram using data analysis on the computer. This tutorial will show you how to create a frequency distribution, a cumulative frequency distribution, a histogram chart and an ogive chart with the data analysis add-in.
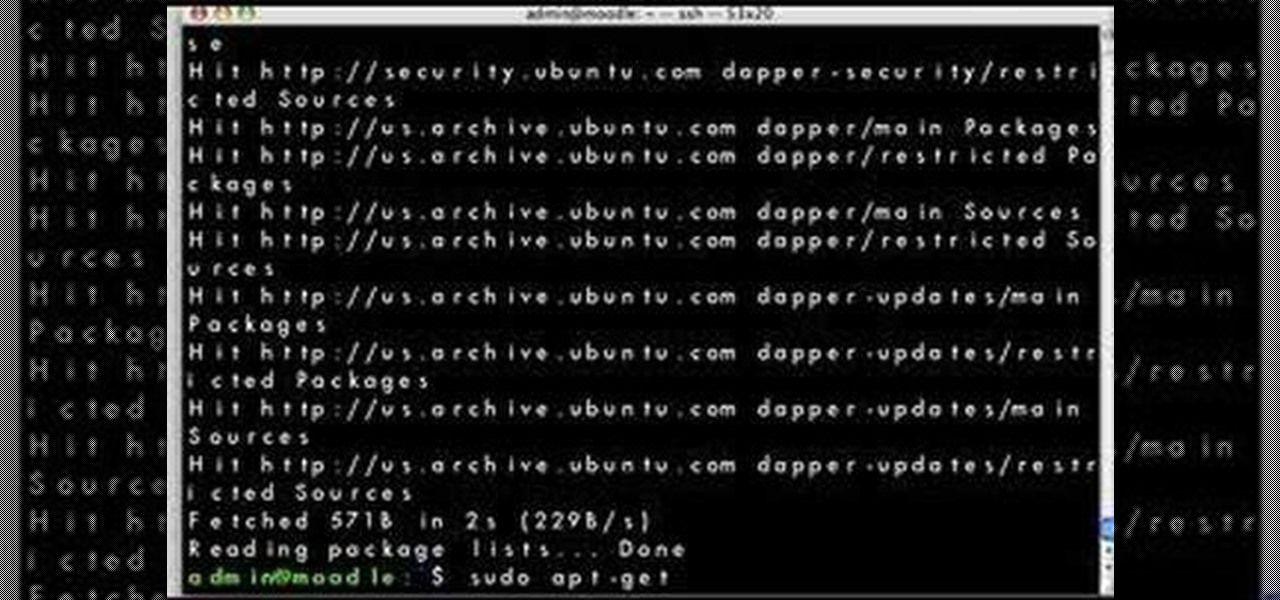
Looking for a simple way to update your Linux distribution? This video tutorial demonstrates how to upgrade your Linux distribution via the apt-get command in the terminal. To get started using the apt-get update tool, press play!
If you use Microsoft Excel on a regular basis, odds are you work with numbers. Put those numbers to work. Statistical analysis allows you to find patterns, trends and probabilities within your data. In this MS Excel tutorial from everyone's favorite Excel guru, YouTube's ExcelsFun, the 24th installment in his "Excel Statistics" series of free video lessons, you'll learn how to create quantitative data frequency distributions with pivot tables. See how to create the correct unambiguous labels ...
If you use Microsoft Excel on a regular basis, odds are you work with numbers. Put those numbers to work. Statistical analysis allows you to find patterns, trends and probabilities within your data. In this MS Excel tutorial from everyone's favorite Excel guru, YouTube's ExcelsFun, the 12th installment in his "Excel Statistics" series of free video lessons, you'll learn how to use Advanced Filter 'Unique Records Only" to extract a list of unique items from a data base, and then use the COUNTI...
This video is going to show you how to measure for a weight distribution shank for a trailer hitch.
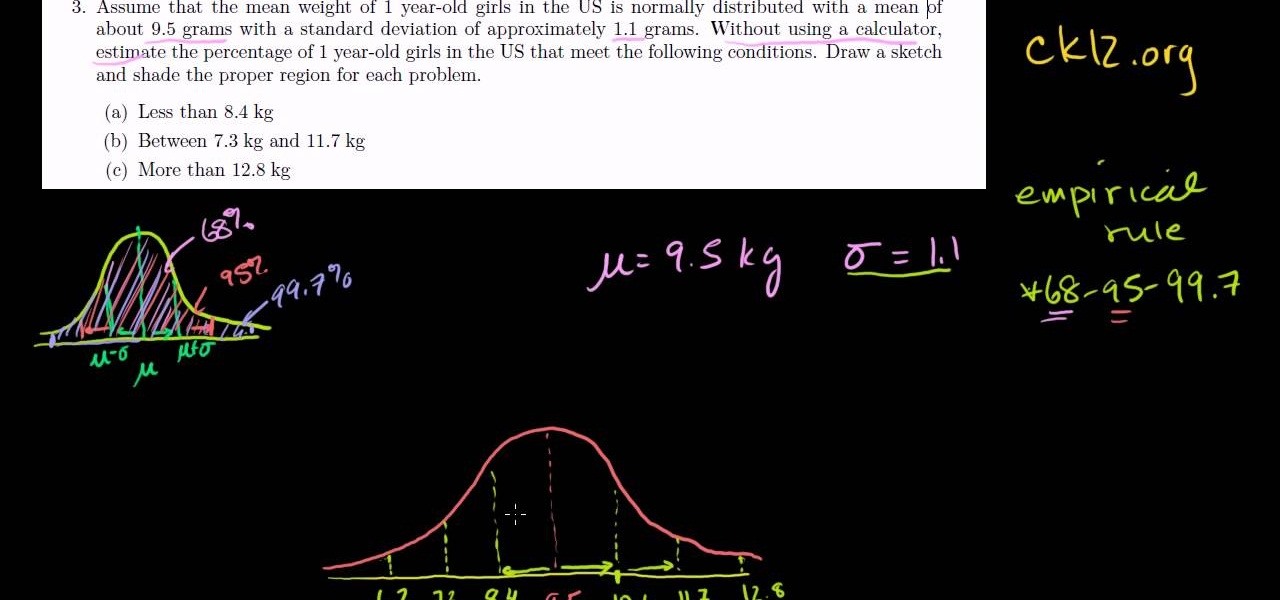
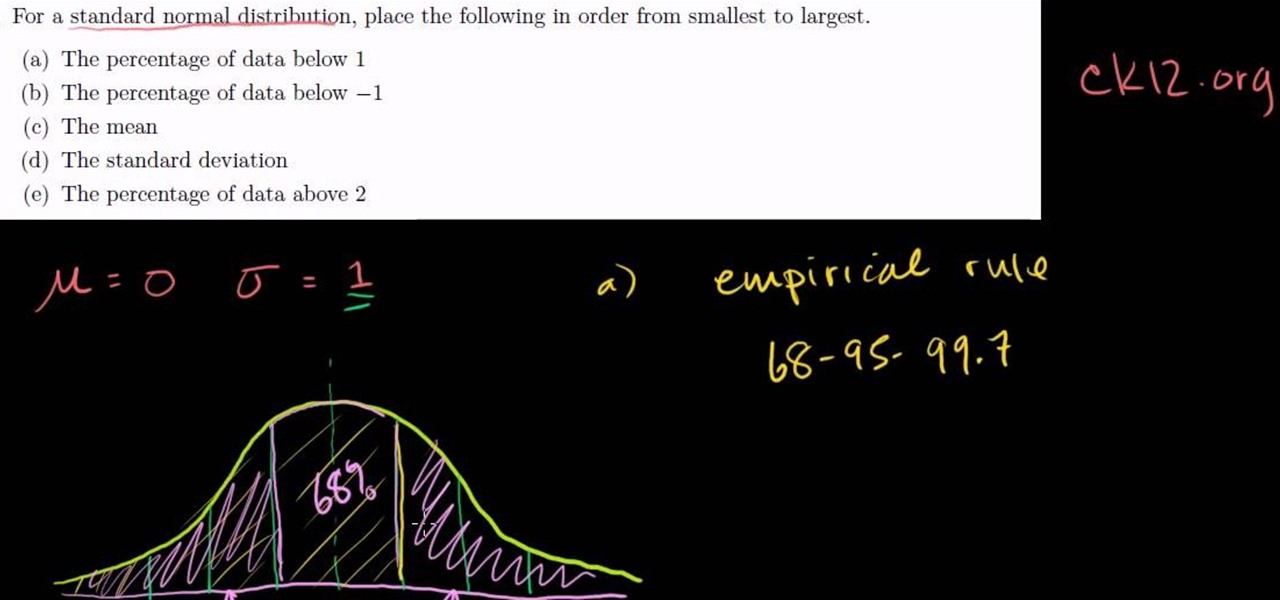
Learn how to use the empirical rule (or 68-95-99.7 rule) to estimate probabilities for normal distributions in statistics. From Ramanujan to calculus co-creator Gottfried Leibniz, many of the world's best and brightest mathematical minds have belonged to autodidacts. And, thanks to the Internet, it's easier than ever to follow in their footsteps (or just finish your homework or study for that next big test). With this installment from Internet pedagogical superstar Salman Khan's series of fre...
If you use Microsoft Excel on a regular basis, odds are you work with numbers. Put those numbers to work. Statistical analysis allows you to find patterns, trends and probabilities within your data. In this MS Excel tutorial from everyone's favorite Excel guru, YouTube's ExcelsFun, the 25th installment in his "Excel Statistics" series of free video lessons, you'll learn how to create quantitative data percent & relative frequency distributions with pivot tables. Also see how to create a histo...
If you use Microsoft Excel on a regular basis, odds are you work with numbers. Put those numbers to work. Statistical analysis allows you to find patterns, trends and probabilities within your data. In this MS Excel tutorial from everyone's favorite Excel guru, YouTube's ExcelsFun, the 22nd installment in his "Excel Statistics" series of free video lessons, you'll learn how to create a percent (%) cumulative frequency distribution with formulas, a histogram and an ogive chart. See how to add ...
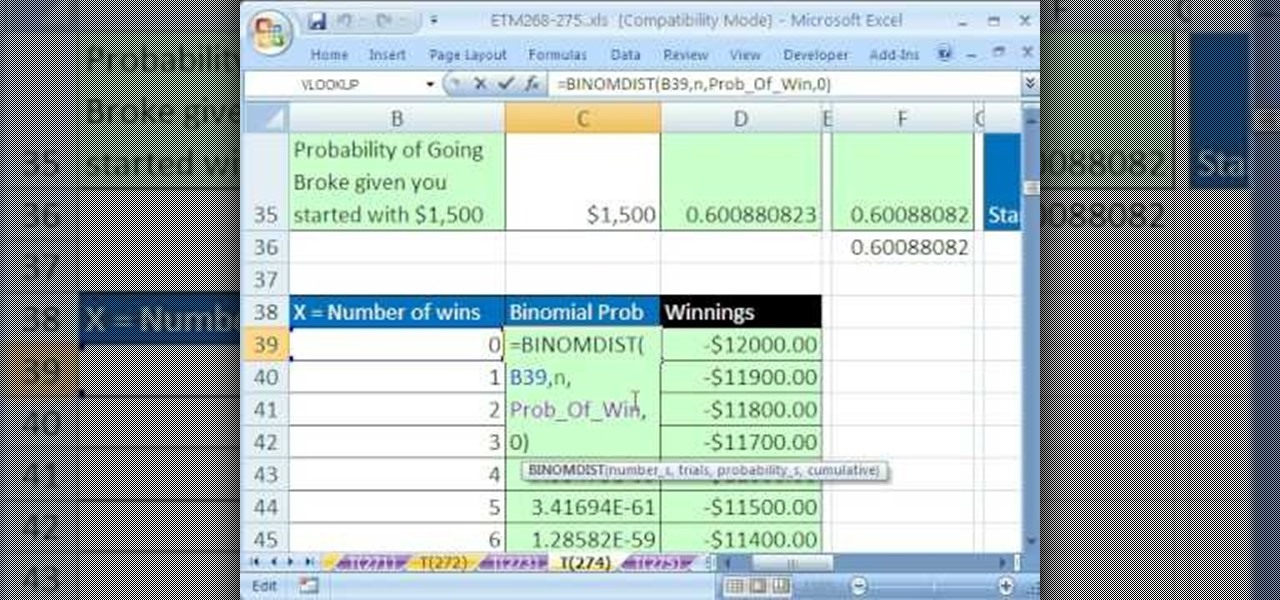
New to Excel? Looking for a tip? How about a tip so mind-blowingly useful as to qualify as a magic trick? You're in luck. In this Excel tutorial from ExcelIsFun, the 274th installment in their series of digital spreadsheet magic tricks, you'll learn how to calculate various probabilities for a binomial distribution when there are additional complicating factors. This is accomplished with recourse to Excel's BINOMDIST, NORMSDIST, SUMIF, SUM, INDEX and MATCH functions. See also how to create th...
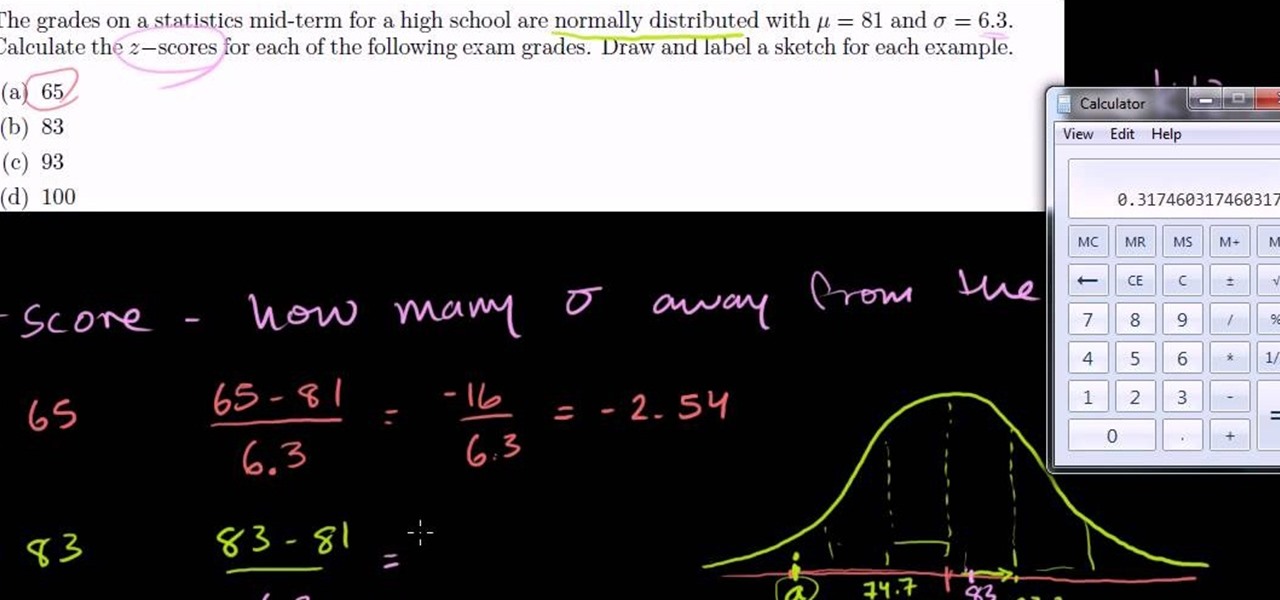
Need help figuring out how to determine a z-score for a normal distribution (or bell curve) in statistics? From Ramanujan to calculus co-creator Gottfried Leibniz, many of the world's best and brightest mathematical minds have belonged to autodidacts. And, thanks to the Internet, it's easier than ever to follow in their footsteps (or just finish your homework or study for that next big test). With this installment from Internet pedagogical superstar Salman Khan's series of free math tutorials...
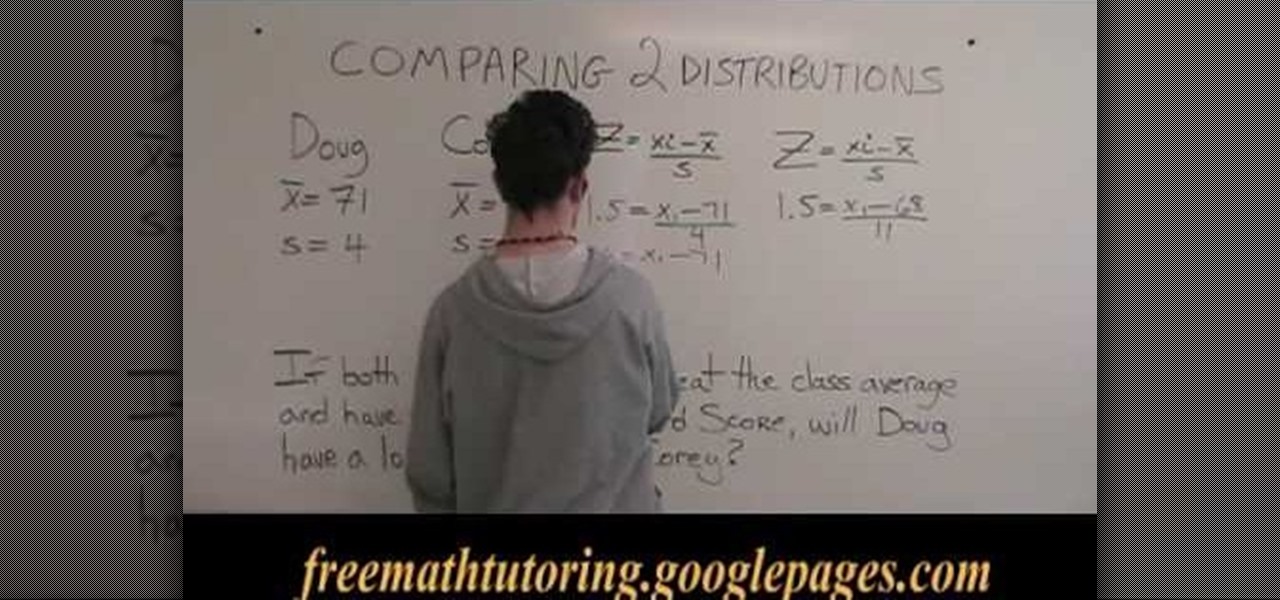
This is a video tutorial in the Education category where you are going to learn how to compare 2 distributions with the Z-Score formula. In this example Doug's class has X bar as 71 and a standard deviation of 4. Corey's class has X bar as 68 and a standard deviation of 11. If both Doug and Corey beat the class average and have the same standard score, will Doug have a lower grade than Corey? If both of them have a standard score of 1.5, then Doug will get 77 marks and Corey will get 84.5 mar...
In this video, we learn how to write a press release for local distribution. First, you need to make sure you have a good headline. This will make people want to read what you have to say or toss it aside. After this, you will need to answer who, what, where, how, why, and what inside of the rest of the release. People want to know all of the details when they read something like this, so give the juicy details that are interesting and leave the boring stuff out. After you have done this, sub...
If you use Microsoft Excel on a regular basis, odds are you work with numbers. Put those numbers to work. Statistical analysis allows you to find patterns, trends and probabilities within your data. In this MS Excel tutorial from everyone's favorite Excel guru, YouTube's ExcelsFun, the 14th installment in his "Excel Statistics" series of free video lessons, you'll learn how to create relative & percent & frequency distributions with formulas for categorical data. See, too, how to create a per...
In this video tutorial the instructor explains about the concepts of standard normal distribution and the empirical rule and how to use it to solve an exercise. He starts by explaining about standard normal deviation saying that in a standard normal deviation the value of mean is zero and the value of standard deviation is one. Now he draws the standard normal deviation by drawing a bell curve on an axis. Now he points the mean and standard deviations on it. Now using these concepts he goes o...
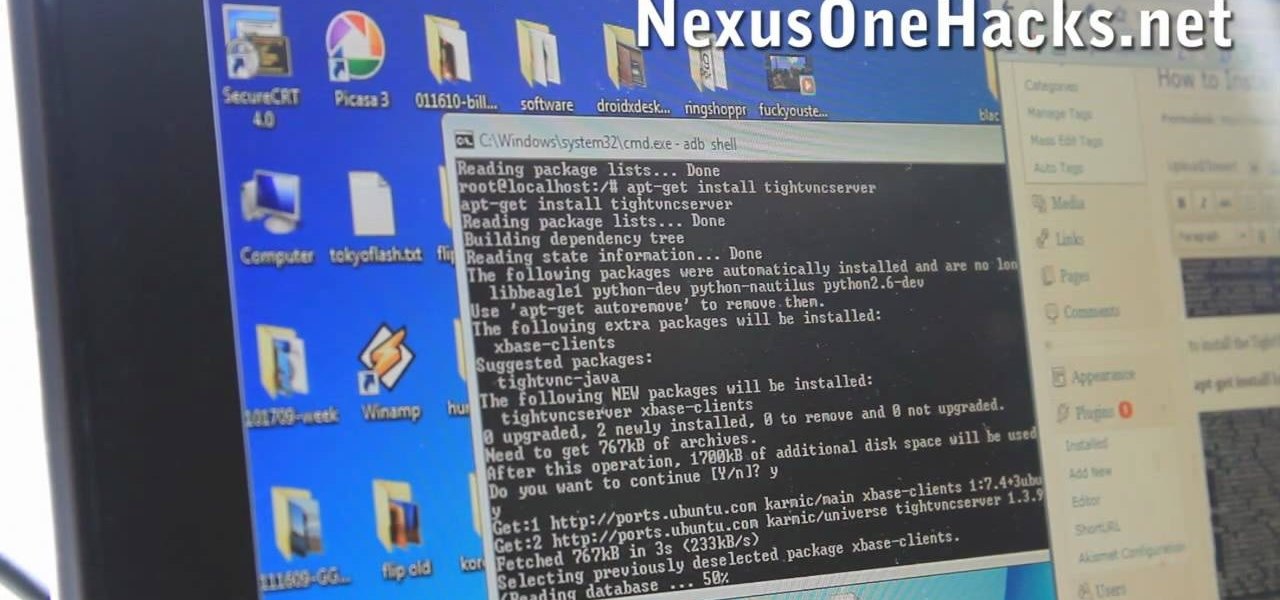
Looking to make your HTC Evo 4G smartphone even better? Unlock your phone's full computational potential by installing Linux on it! This video guide presents a complete, step-by-step walkthrough of the process. For more information, and to get started installing the Ubuntu Linux distribution on your own Android smart phone (without blowing out your phone's Android installation), take a look!
Looking to make your Google Nexus One or HTC Evo smartphone even better? Unlock your phone's full computational potential while following in a tried-and-true geek tradition: Install Linux on it! This video guide presents a complete, step-by-step walkthrough of the process. For more information, and to get started installing the Ubuntu Linux distribution on your own Android smart phone (without blowing out your phone's Android installation), take a look!
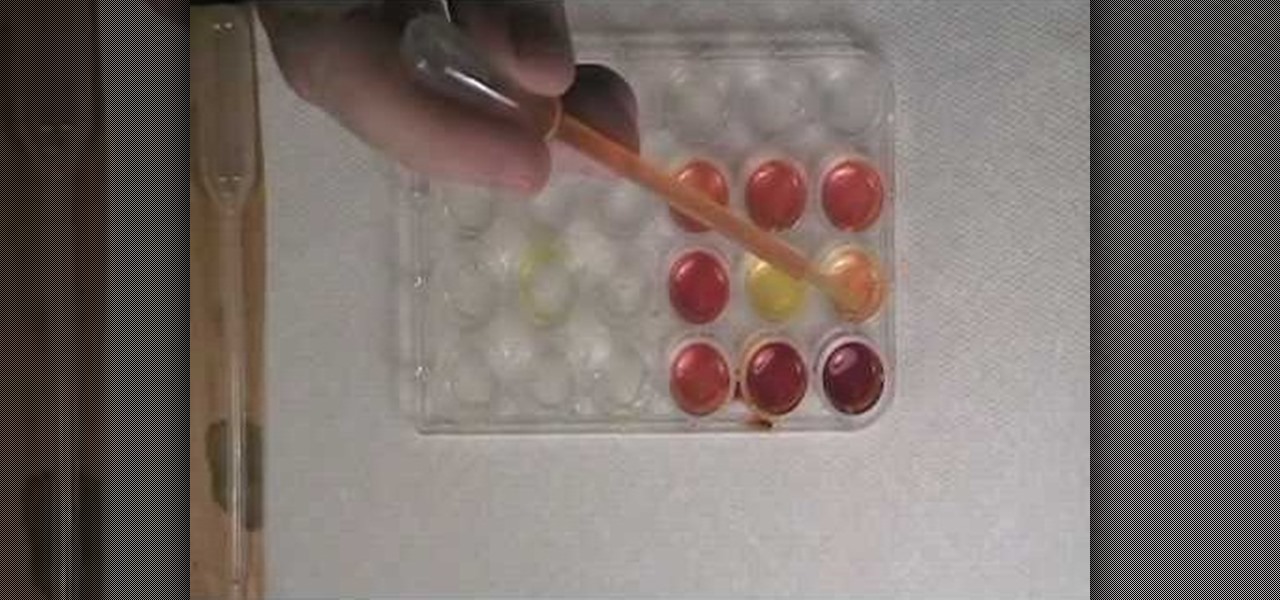
Want to test whether the soil sample or a water sample contains boron, watch this video. As shown in the video, the first step is to create test specimens of various concentrations using a simple turmeric and ethanol solution as a base for comparison. The basis of this experiment is the fact that curumin present in turmeric reacts with boron to form a reddish compound and so the result of this reaction can easily be verified visually.
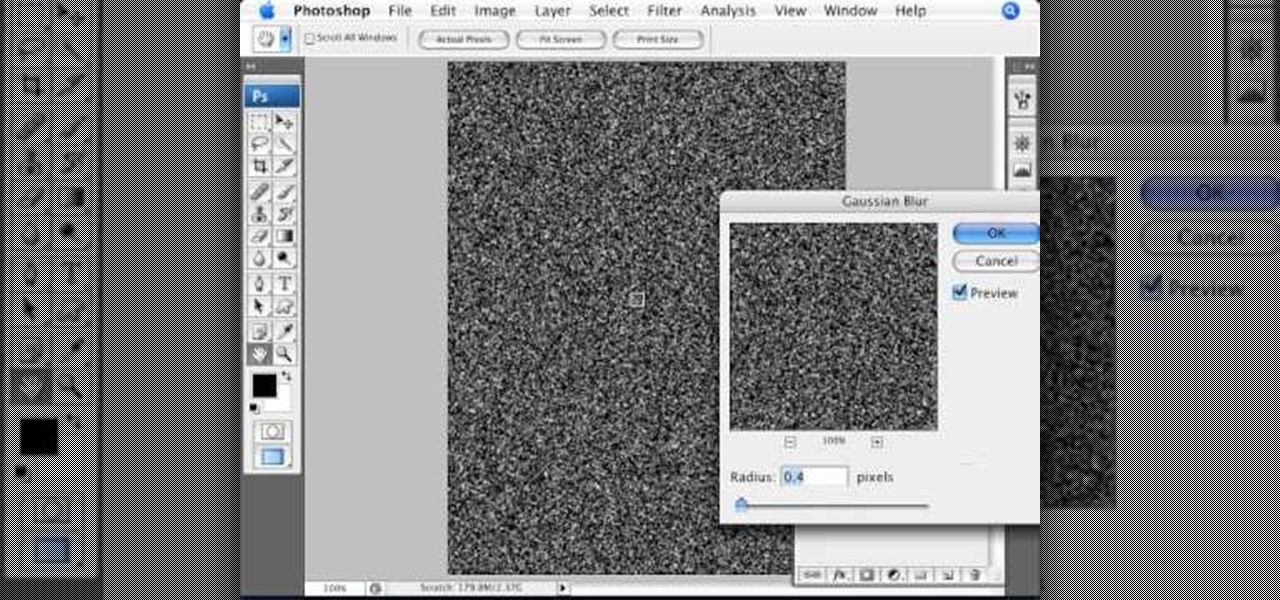
Open an image and on the layers panel add a new layer by clicking on the fifth icon below the layers panel. A new layer is created with the name 'layer 1' and your previous layer would have the name 'background'. These names can be changed by you. For now we'll leave them as they are.
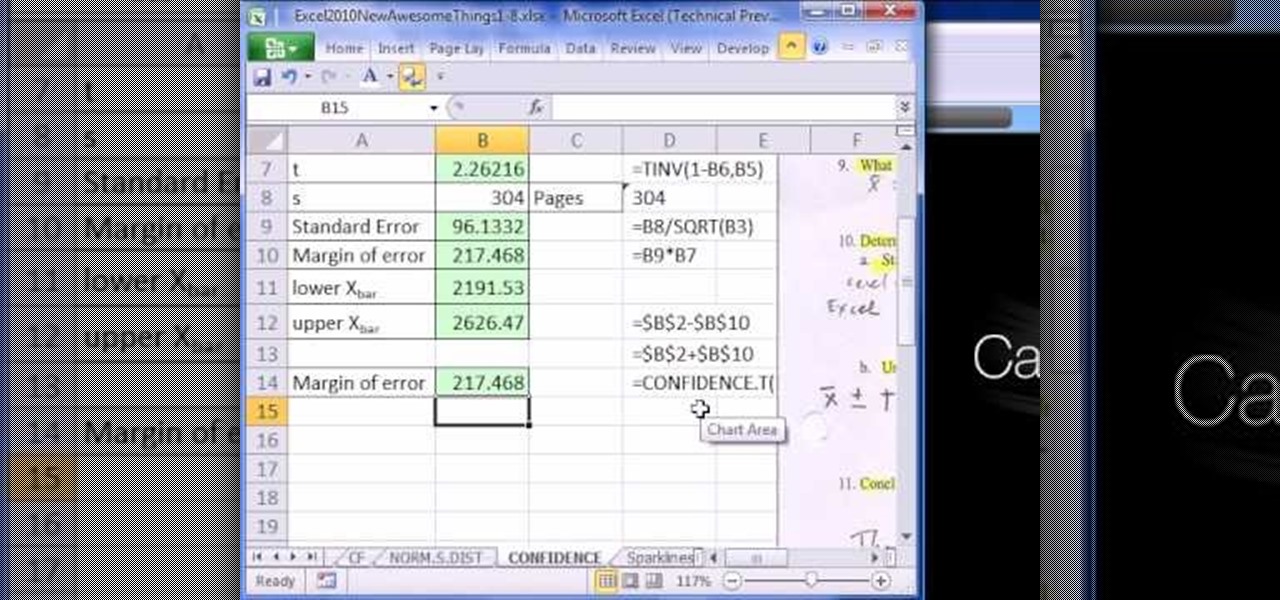
New to Microsoft Excel 2010? Looking for a few good tips and tricks? Look no further. In this free video tutorial from everyone's favorite MS Excel guru, YouTube's ExcelIsFun, the 7th installment in his series of Excel 2010 video tutorials, you'll learn how to use Excel's new CONFIDENCE.T function to calculate the margin of error for a T distribution confidence interval.