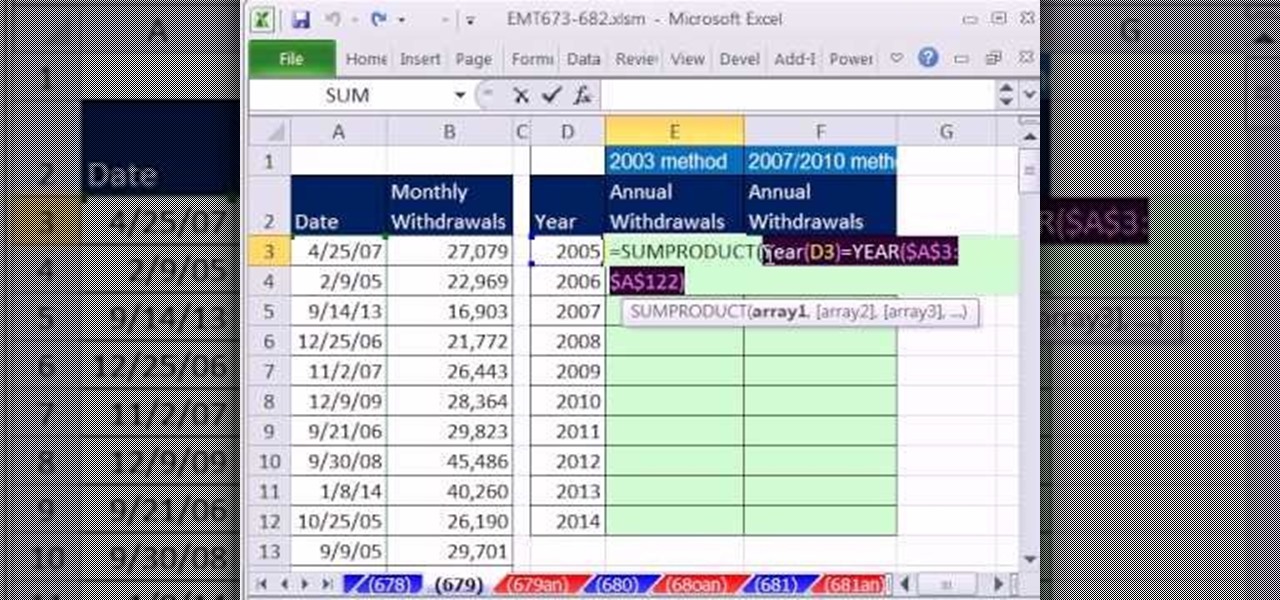
New to Microsoft Excel? Looking for a tip? How about a tip so mind-blowingly useful as to qualify as a magic trick? You're in luck. In this MS Excel tutorial from ExcelIsFun, the 679th installment in their series of digital spreadsheet magic tricks, you'll learn how to summarize yearly totals from monthly totals when there Year Criteria is entered as a serial date. See the SUMPRODUCT and SUMIFS functions. Learn about criteria and how to enter it into the SUMIFS functions.

United States Womens Softball Team members discuss and illustrate how to run the bases correctly. The main techniques used are how to lead off then steal each base as the technique is different for each one, and perform the hit and run. The breakdown is great!

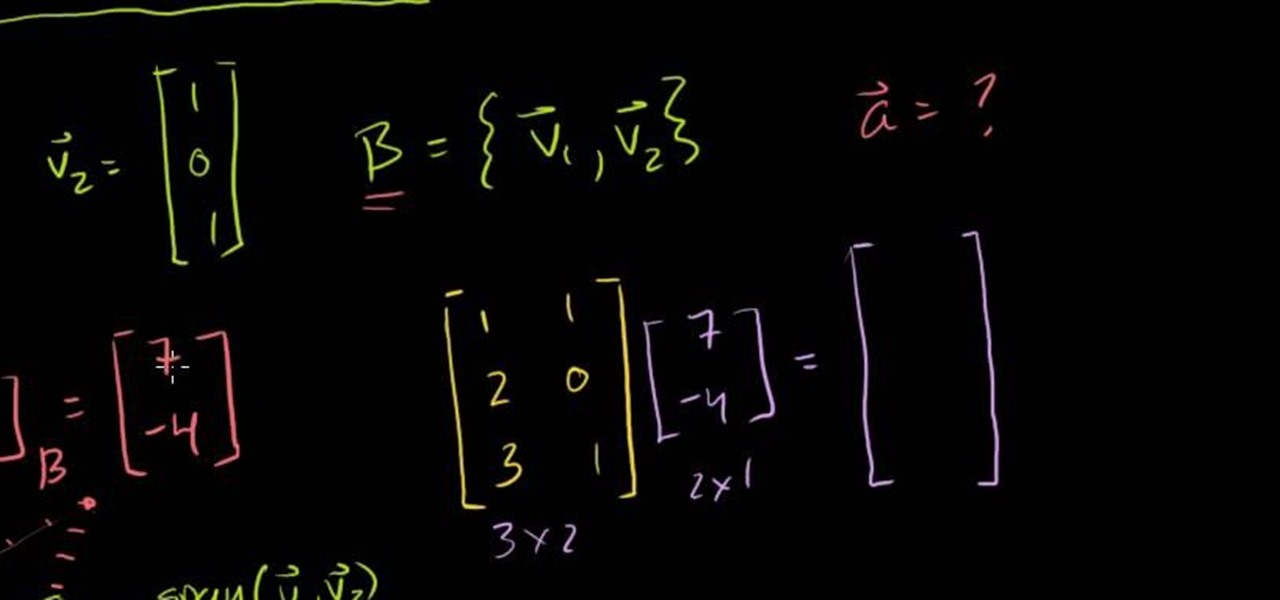
Learn how to find a transformation matrix with respect to a non-standard basis in linear algebra. From Ramanujan to calculus co-creator Gottfried Leibniz, many of the world's best and brightest mathematical minds have belonged to autodidacts. And, thanks to the Internet, it's easier than ever to follow in their footsteps (or just finish your homework or study for that next big test).

One achievement for you to earn in Starcraft 2: Wings of Liberty is the "My Precious" achievement, and you can get this in the Colonist mission of Save Haven. In order to obtain the achievement, you must successfully rescue two Colonist bases from the Protoss attack on HARD difficulty, i.e., destroy the Purifier while at least 2 Colony bases are left un-purified!
Need help figuring out how to utilize change of basis matrices in linear algebra? From Ramanujan to calculus co-creator Gottfried Leibniz, many of the world's best and brightest mathematical minds have belonged to autodidacts. And, thanks to the Internet, it's easier than ever to follow in their footsteps (or just finish your homework or study for that next big test). With this installment from Internet pedagogical superstar Salman Khan's series of free math tutorials, you'll learn how use a ...

Learn how to use invertible change of basis matrices in linear algebra. From Ramanujan to calculus co-creator Gottfried Leibniz, many of the world's best and brightest mathematical minds have belonged to autodidacts. And, thanks to the Internet, it's easier than ever to follow in their footsteps (or just finish your homework or study for that next big test). With this installment from Internet pedagogical superstar Salman Khan's series of free math tutorials, you'll learn how to use invertibl...

In this video, we learn how to find the area of a trapezoid. The formula to figure out how to find the answer is: Area= 1/2x (base1 x base2) x height. Now, find the bases and the height of the trapezoid. Remember that the height must always be perpendicular to the bases. Once you have found these, add the bases and multiply by the height. You can use a calculator to do this or do it off hand if you're good with math. For the third step, divide the answer by 2 and then write down the answers w...
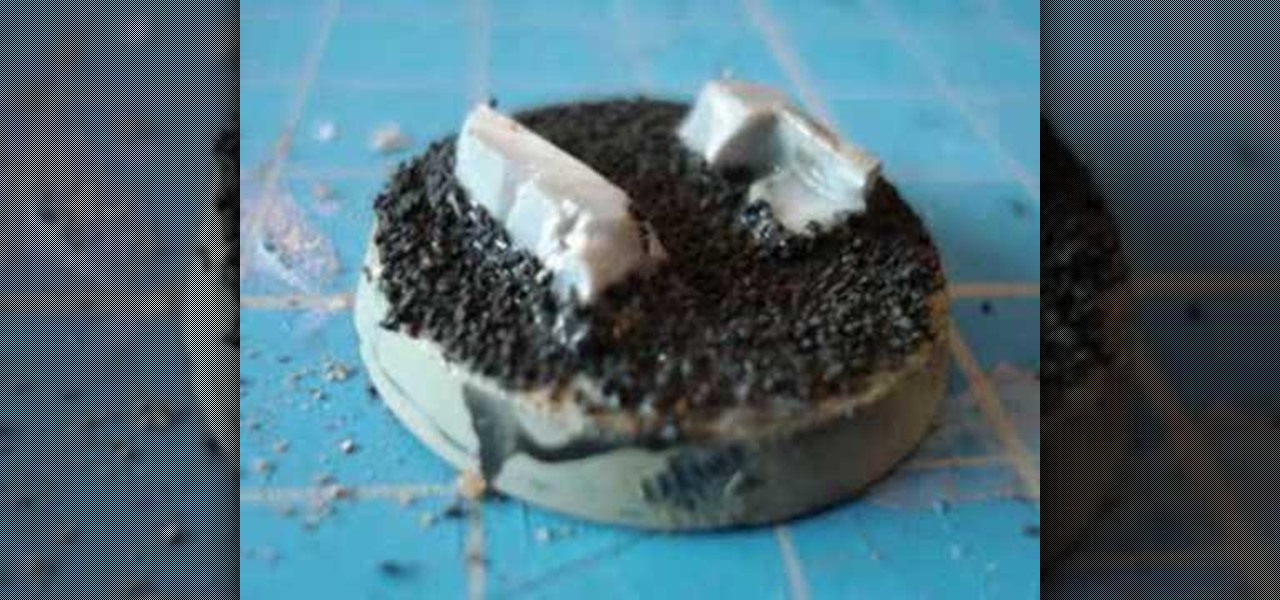
If you usually wind up playing Warhammer 40k on the same type of board pretty consistently, you should consider spicing up your pieces by giving them bases that look like the sort of terrain your favor. This video will show you how to make an urban environment base for Warhammer 40k miniatures that will make your pieces look that much better. And look account for so much in Warhammer games don't they?
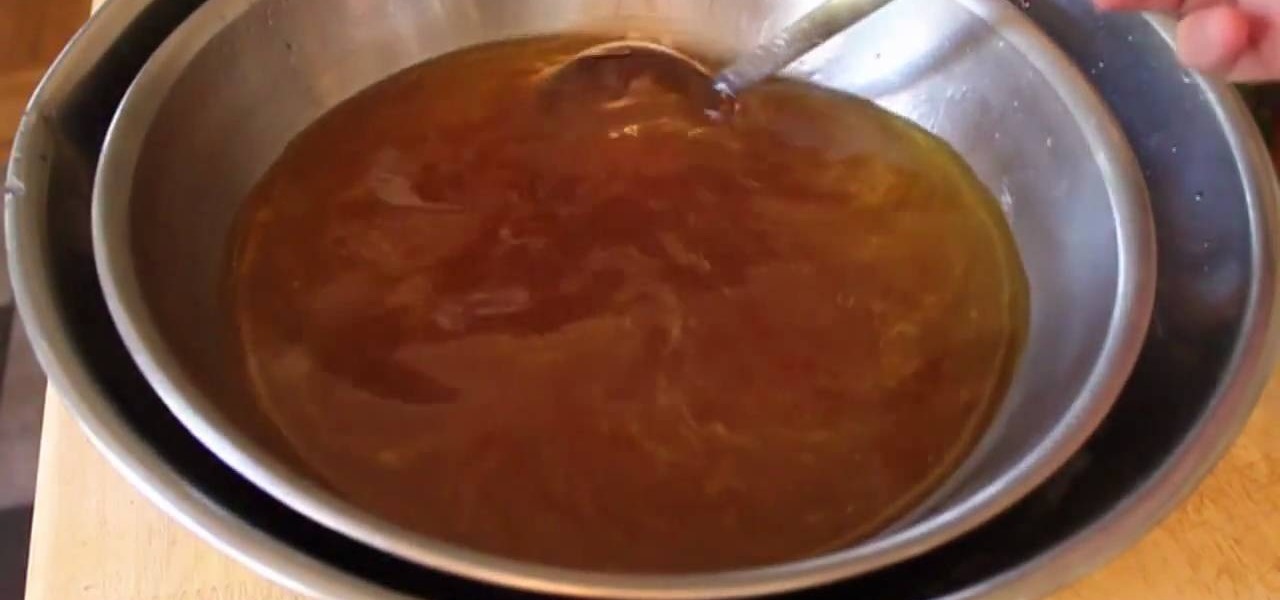
Chicken stock is the mother of all soups and meals: It is the basis for recipes that call for a dash of extra flavor (like pan-roasted salmon with spinach or grilled chicken) and also a basis for a bunch of savory soups (like minestrone).
In this video, Mr. Maisonet provides a quick and easy method for calculating the area of a trapezoid. In the first step, The lengths of the two bases (the two sides of a trapezoid that are parallel to one another) are averaged. The lengths of the bases are first added together, and the sum is divided by two, yielding the average. The average is then multiplied by the height. The resulting product is the area of the trapezoid. This method for finding the area of a trapezoid is mathematically s...
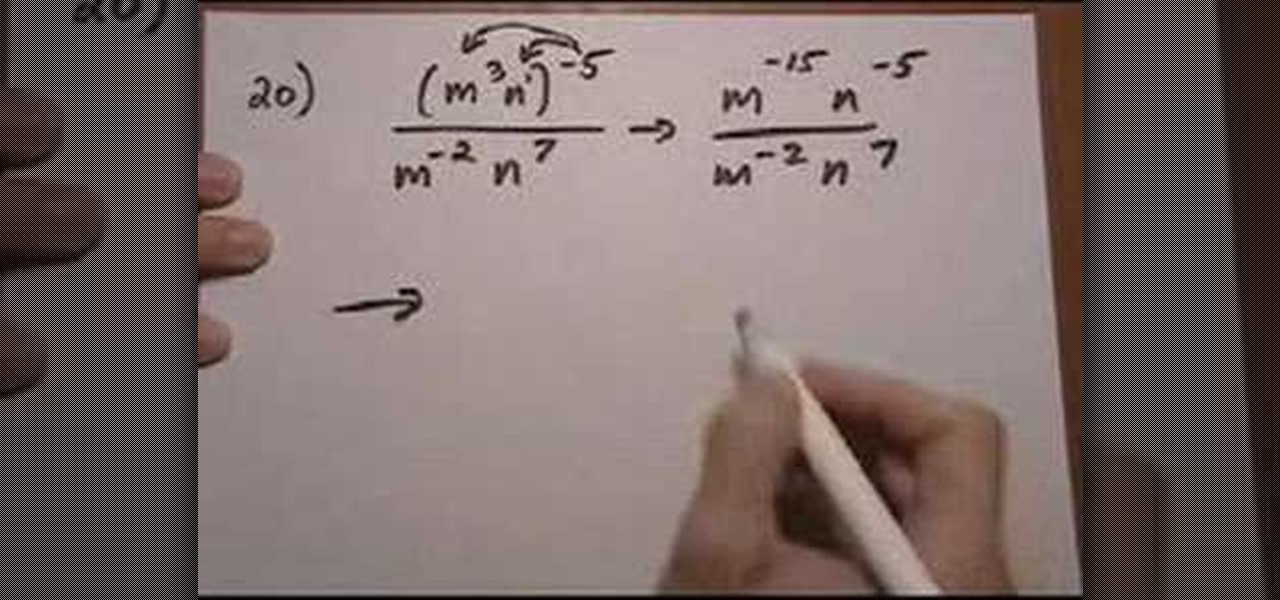
The video shows how to solved mixed property problems using the exponent rules. See if there are any rules you can apply to the problem until you get to a point where you can't simplify anymore. The instructor shows in the example problem that the two bases are the same, but there is extras happening the numerator. The power to power multiply rule is applied removing the extra issues from the numerator. Next the quotient rules is applied as there is the exact same base to the power so we keep...
The yearly Victoria's Secret Fashion Show is a fashion show unlike any other. Rather than stick thin waifs floating down the runway with "I'm hungry" plastered all over their gaunt faces, Victoria's Secret showcases models with healthy, toned bodies who command the stage with their cheeky and flirty antics.
This tutorial shows you how to add flag bases to capture the flag maps in Unreal Tournament 3 Editor.
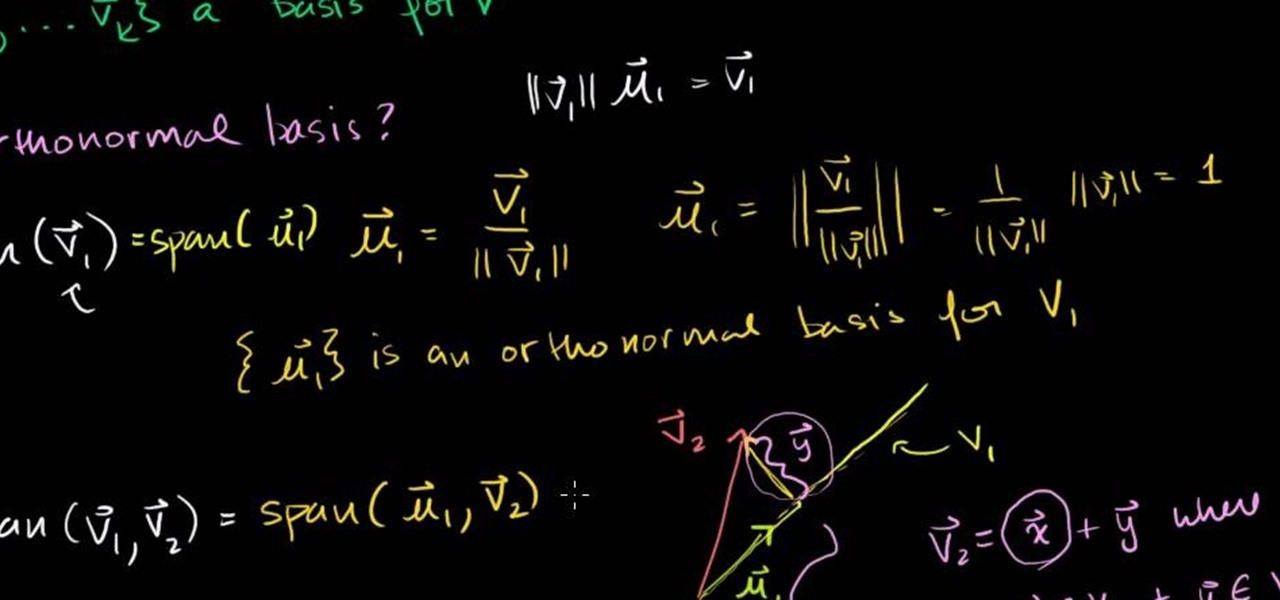
Learn how to find an orthonormal basis for a subspace using the Gram-Schmidt process in linear algebra! From Ramanujan to calculus co-creator Gottfried Leibniz, many of the world's best and brightest mathematical minds have belonged to autodidacts. And, thanks to the Internet, it's easier than ever to follow in their footsteps (or just finish your homework or study for that next big test). With this installment from Internet pedagogical superstar Salman Khan's series of free math tutorials, y...
The body wave has been around since the 1980's, and along with the arm wave forms the basis for all of popping and it's child-styles. You basically have to learn how to a body wave to hip-hop dance, and this video will help you do just that. It explains in great detail how to body wave like a pro.
In this clip, you'll learn how to use the Auto Levels and Auto Curves commands to correct the luminance of an image on a channel-by-channel basis in Adobe Photoshop CS5. Whether you're new to Adobe's popular raster graphics editor or a seasoned designer looking to better acquaint yourself with the new features and functions of the latest iteration of the application, you're sure to benefit from this free software tutorial. For more information, watch this video guide.
Shooting good footage with handheld cameras that wiggle, bounce, and fall onto rocks on a regular basis is tough. Sometimes, though, you may want to make it appear as if film that you've shot with tripods and such was actually shot with a handheld, like in some horror films. This video will show you how to create a fake camera movement effect in After Effects, giving your professionally-shot film just enough of that vérité quality.
In this clip, learn how to make a perfectly thin, crispy Italian style pizza with Food Mob. You will also learn how to top those beautiful bases with the best ingredients so absolutely everyone at the table will be happy. Don't bother with delivery or one of those store bought pizzas - make your own! It's worth it.
Creating cool animations is the bread and butter of Flash. This video will help you get started making them yourself for your website, video game, or movie. It explains how to animate objects, making them move around however you wish and form the basis of your animation. No source files needed, just make some circles and get started!
We live in a computer world full of file formats. Whether we are talking about images, videos, or text documents, there are dozens of file types for each, and there are new ones added every year to applications. Keeping in mind that many of these formats were created before the internet was widely available (at least, in infant form), the primary reason for this glut of often complex choices is competition.
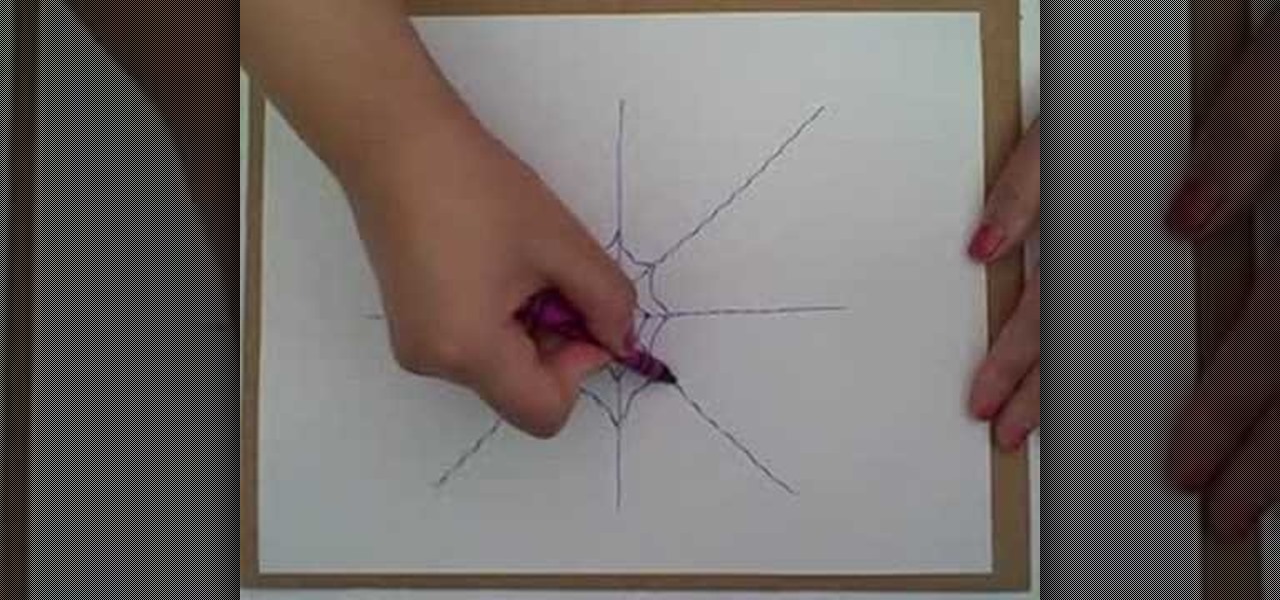
This how to video shows you how to create a basic spider web. This will be helpful if you do not know how to create the basis for a basic web. You will need a crayon and a piece of paper. First draw a large plus sign in the middle of the paper. Next, make two intersecting diagonal lines. You have formed the basis of the web. Next, Draw a curved line crossing in between each line. Start this at the center. After you go around the lines once, draw another line above the previous. Keep on doing ...
This video demonstrates how to make a catapult out of popsicle sticks. For this project, you will need the following: 7” rubber bands, a box of popsicle sticks, a hot glue gun, a Dixie cup, and tape.
With constant Twitter updates, grueling commutes home, and a neverending workday, it's no wonder more and more of us have anxiety and stress on a regular basis. While you may not be able to just call it quits for a week and hit Fiji for some scuba fun, you can relive stress temporarily with a massage.
If you're lucky enough to have manageable pin-straight hair then we envy you. Most girls deal with frizz and damaging styling products on a daily basis trying to get their hair to look like yours.
A really beautifully painted Warhammer miniature mounted on a stock base is like Christina Hendrix at the Emmy's, but with trash bags wrapped around her feet instead of shoes. It cheapens your work. This video will show you how to make really cool miniature bases out of cork board and a hot glue gun.
Major chords are like happy kids' movies, which have an upbeat beginning, middle, and end to satisfy innocent minds and sugarcoat harsher realities.
Working with both Macs and PCs covers all bases, but it also adds new problems. If you fall into this category, you probably work with file formats that are not incompatible with the other computers. One of these file types in XML files. This tutorial will show you how to open XML on your Mac.
If you use Microsoft Excel on a regular basis, odds are you work with numbers. Put those numbers to work. Statistical analysis allows you to find patterns, trends and probabilities within your data. In this MS Excel tutorial from everyone's favorite Excel guru, YouTube's ExcelsFun, the 45th installment in his "Excel Statistics" series of free video lessons, you'll learn how to see how to calculate a z-score.
If you use Microsoft Excel on a regular basis, odds are you work with numbers. Put those numbers to work. Statistical analysis allows you to find patterns, trends and probabilities within your data. In this MS Excel tutorial from everyone's favorite Excel guru, YouTube's ExcelsFun, the 35.2nd installment in his "Excel Statistics" series of free video lessons, you'll learn how to use Excel's GEOMEAN function to find geometric mean.
If you use Microsoft Excel on a regular basis, odds are you work with numbers. Put those numbers to work. Statistical analysis allows you to find patterns, trends and probabilities within your data. In this MS Excel tutorial from everyone's favorite Excel guru, YouTube's ExcelsFun, the 40th installment in his "Excel Statistics" series of free video lessons, you'll learn how to calculate range & interquartile range for variability using the MAX, MIN, QUARTILE functions.
If you use Microsoft Excel on a regular basis, odds are you work with numbers. Put those numbers to work. Statistical analysis allows you to find patterns, trends and probabilities within your data. In this MS Excel tutorial from everyone's favorite Excel guru, YouTube's ExcelsFun, the 86th installment in his "Excel Statistics" series of free video lessons, you'll learn how to construct confidence intervals for proportions using NORMSINV function and other formulas.
If you use Microsoft Excel on a regular basis, odds are you work with numbers. Put those numbers to work. Statistical analysis allows you to find patterns, trends and probabilities within your data. In this MS Excel tutorial from everyone's favorite Excel guru, YouTube's ExcelsFun, the 87th installment in his "Excel Statistics" series of free video lessons, you'll learn how to calculate sample size (n) for confidence intervals.
If you use Microsoft Excel on a regular basis, odds are you work with numbers. Put those numbers to work. Statistical analysis allows you to find patterns, trends and probabilities within your data. In this MS Excel tutorial from everyone's favorite Excel guru, YouTube's ExcelsFun, the 27th installment in his "Excel Statistics" series of free video lessons, you'll learn how to create a quantitative data dot plot chart using the REPT and COUNTIF functions.
If you use Microsoft Excel on a regular basis, odds are you work with numbers. Put those numbers to work. Statistical analysis allows you to find patterns, trends and probabilities within your data. In this MS Excel tutorial from everyone's favorite Excel guru, YouTube's ExcelsFun, the 26th installment in his "Excel Statistics" series of free video lessons, you'll learn how to create quantitative data cumulative frequency distributions with pivot tables.
If you use Microsoft Excel on a regular basis, odds are you work with numbers. Put those numbers to work. Statistical analysis allows you to find patterns, trends and probabilities within your data. In this MS Excel tutorial from everyone's favorite Excel guru, YouTube's ExcelsFun, the 16th installment in his "Excel Statistics" series of free video lessons, you'll learn how to cross tabulate & do percentage cross tabulation for categorical data using a pivot table (PivotTable).
If you use Microsoft Excel on a regular basis, odds are you work with numbers. Put those numbers to work. Statistical analysis allows you to find patterns, trends and probabilities within your data. In this MS Excel tutorial from everyone's favorite Excel guru, YouTube's ExcelsFun, the 19th installment in his "Excel Statistics" series of free video lessons, you'll learn how to group categories in a frequency distribution with a formula (2 COUNTIF) and the pivot table (PivotTable) grouping fea...
If you use Microsoft Excel on a regular basis, odds are you work with numbers. Put those numbers to work. Statistical analysis allows you to find patterns, trends and probabilities within your data. In this MS Excel tutorial from everyone's favorite Excel guru, YouTube's ExcelsFun, the 17th installment in his "Excel Statistics" series of free video lessons, you'll learn how to cross tabulate & do percentage cross tabulation for categorical data using formulas rather than pivot tables.
If you use Microsoft Excel on a regular basis, odds are you work with numbers. Put those numbers to work. Statistical analysis allows you to find patterns, trends and probabilities within your data. In this MS Excel tutorial from everyone's favorite Excel guru, YouTube's ExcelsFun, the 3rd installment in his "Excel Statistics" series of free video lessons, you'll learn how to use Excel's sorting and pivot tables (PivotTables) data analysis tools.
If you use Microsoft Excel on a regular basis, odds are you work with numbers. Put those numbers to work. Statistical analysis allows you to find patterns, trends and probabilities within your data. In this MS Excel tutorial from everyone's favorite Excel guru, YouTube's ExcelsFun, the 35th installment in his "Excel Statistics" series of free video lessons, you'll learn how to calculate weighted and geometric means and see how to use the GEOMEAN function.
If you use Microsoft Excel on a regular basis, odds are you work with numbers. Put those numbers to work. Statistical analysis allows you to find patterns, trends and probabilities within your data. In this MS Excel tutorial from everyone's favorite Excel guru, YouTube's ExcelsFun, the 33rd installment in his "Excel Statistics" series of free video lessons, you'll learn how to use the AVEARGE, MEDIAN, MODE, PERCENTILE, QUARTILE and PERCENTILERANK functions to measure location.