This video shows the way to name a line segment. A line segment begins and ends with an end point. We can name a line segment by naming the two end points of the line segment. The example shown in the video shows a line segment that ends with points named 'A' and 'C'. So, we can name this line segment as segment 'AC'. This can also be named as segment 'CA'. The example shown consists of a point 'B' in between 'A' or 'B'. We cannot name the line segment as segment 'AB' or 'BA' and segment 'BC'...
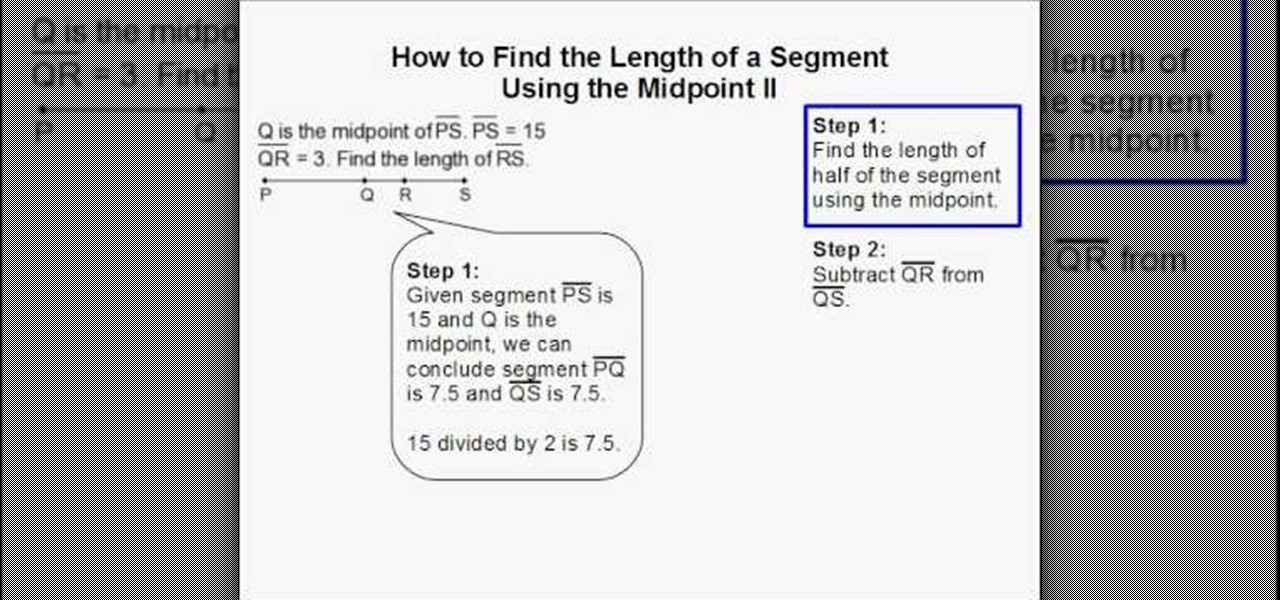
First of all in the given question you have to write down the values of the total length of the line segment, PS=15. The length of the line segment, QR =3. Now you have to find the value of line segment RS. Because you know that the Q is the midpoint of the line segments PQ and QS must be equal. Therefore you can find out the length of the half of the segment using the midpoint. Subtract the value of QR from QS. Given that segment PS=15 and Q is the midpoint, you can conclude segment PQ=7.5 a...
Regression functions are a vital part of statistical analysis of populations, and if you're involved in business, science, or nearly any academic field you should understand how it works. This series of videos will show you how standard regression functions, ANOVA, ordinary least squares, and everything else you need to know.

What's up readers? We have ever so slightly touched upon this concept of scope with variables but still don't really know what it means. In this tutorial we will learn the behaviors of variables existing in our programs and within functions.

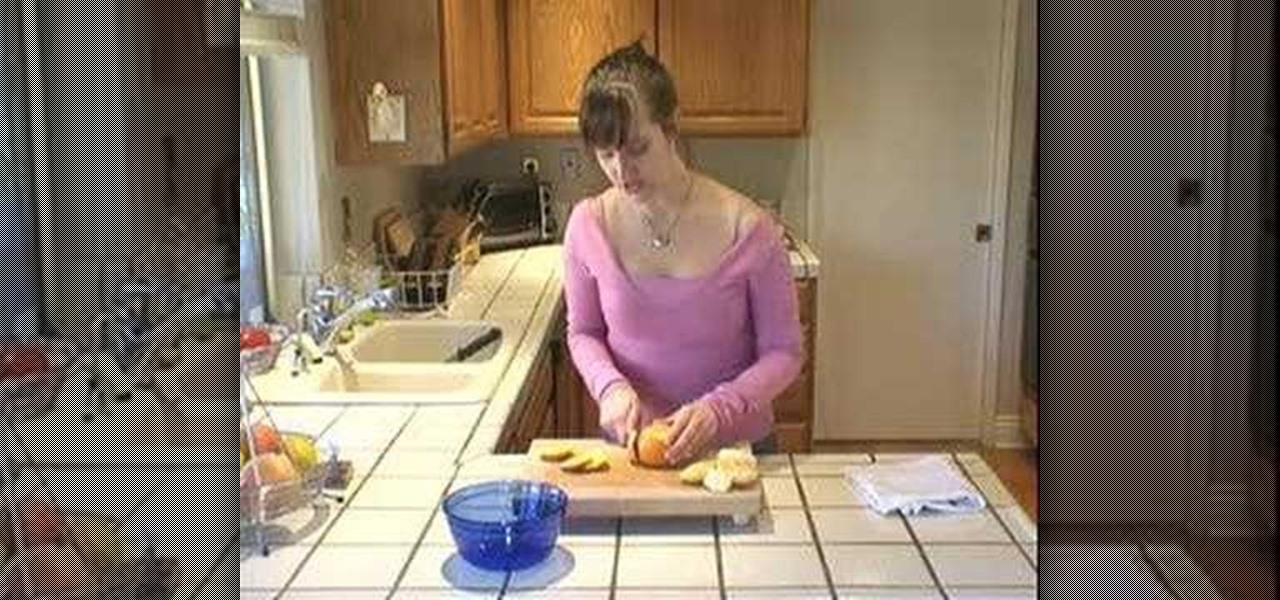
Check out this video cooking tip from The Chef's Toolbox in Australia. Watch this tutorial to learn how to segment an orange like a chef. Segmenting orange fruits for recipes is easy with a little know-how, see how to do it right here.

This video shows the method to find the length of the total segment using the midpoint. Let the total line segment be PS. Let Q be the midpoint of PS. Let R be a point on the line segment QS. The first step involves the use of midpoint to find out the length of QS. We are given that QR = 1 and RS = 4.5. QS is equal to QR plus RS which is equal to 5.5. Now since Q is the midpoint of PS the total length of the segment PS is equal to twice the length of the segment QS. This is equal to 11 units....

This four part segment from Motorola provides a ton of information and serves as a guide on Webtop for the Droid Bionic.
This video from Yay Math! is a geometry lesson on how to complete a proof involving segments. He draws a line segment with four points labeled A, B, C and D. The problem is as follows: Given: AC is equivalent to BD. Prove that AB is equivalent to CD. The first statement of proof is the given. Next, you need to define the congruent segments and state that they're equal in measurement. Next, break down the segments: AC=AB+BC, and BD=BC+CD. This is called segment addition postulate. The end of t...
Analyzing a play can help actors, directors, or scholars to understand everything about a given play. Learn how to write a play analysis in this free theater video from a college professor.
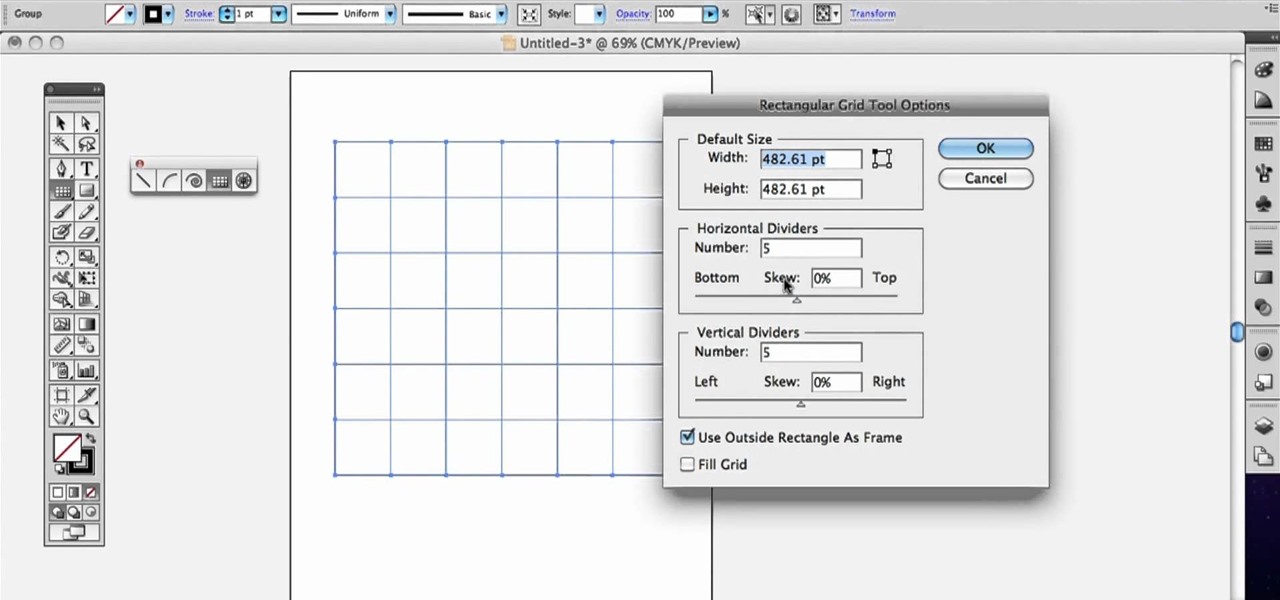
In this clip, you'll learn how to create line segments with the Line Segment tool when doing design work in Adobe Illustrator CS4 or CS5. Whether you're new to Adobe's popular vector graphics editing software or a seasoned professional just looking to better acquaint yourself with the program and its various features and filters, you're sure to be well served by this video tutorial. For more information, including detailed, step-by-step instructions, watch this free video guide.
If you would like to create the look of stitches or sutures on your clay sculptures, you will need the following: clay, a toothpick or sharp implement, and a cutting tool.
This video tutorial is in the Education category which will show you how to evaluate a line integral along a straight line segment using the definition of the line integral. This video evaluates a line integral along a straight line segment using a parametric representation of the curve (using a vector representation of the line segment) and then integrating. A vector representation of a line that starts at r0 and ends at r1 is r(t) = (1-t)r0 + tr1 where t is greater than equal to 0 and lesse...
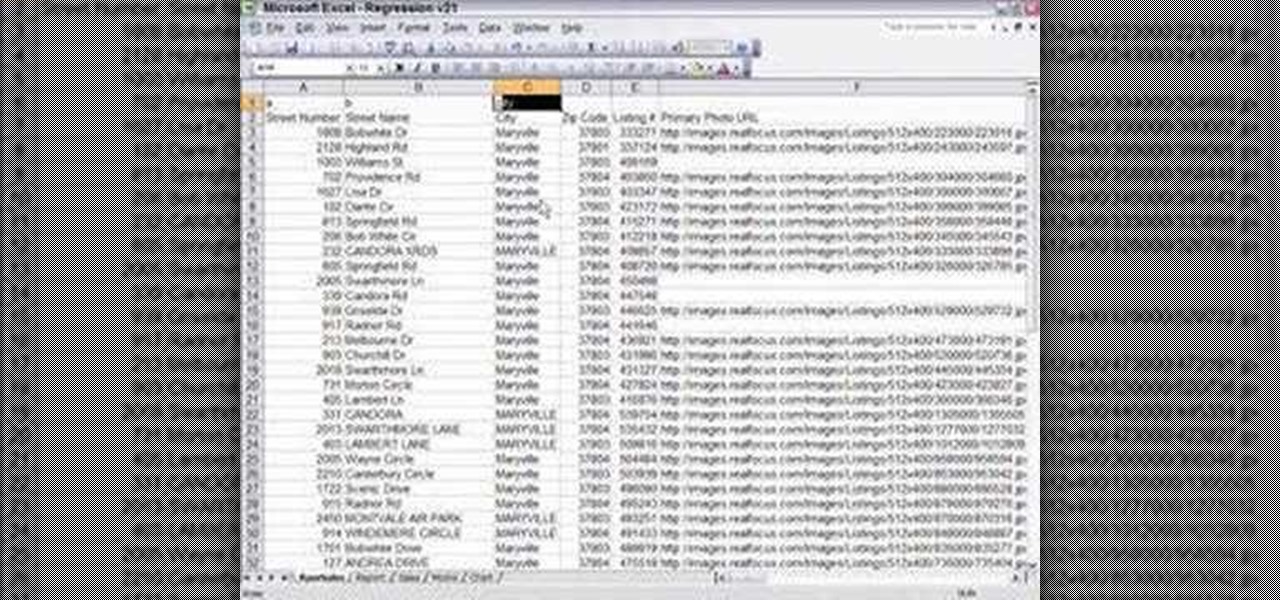
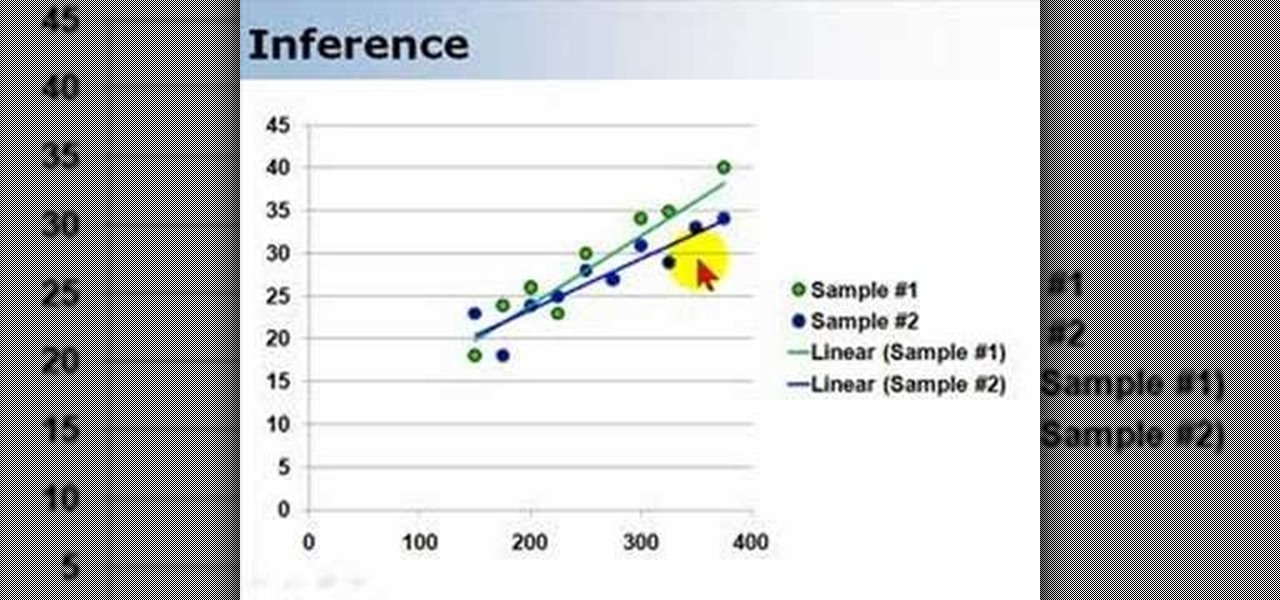
Are you in real estate? Take a look at this instructional video and learn how to run your excel spreadsheet over a regression analysis module. An appraiser who's appraising a house decides to run a multiple regression analysis as an addition to the direct sales comparison approach. The spreadsheet used in this tutorial was written in excel, but could be rewritten in another format. The spreadsheet was exported from an MLS. Once the excel sheet is downloaded, the appraiser will open up the reg...
Whether you're new to Adobe After Effects or a seasoned digital film professional after a general overview of CS5's most vital new features, you're sure to be well served by this official video tutorial from the folks at Adobe TV. In it, you'll learn how to turn spoken dialogue into searchable text either by synchronizing content with your Adobe Story script, or by using reference scripts that are optimized for your content. Also see how to accelerate editing by marking in and out points in t...
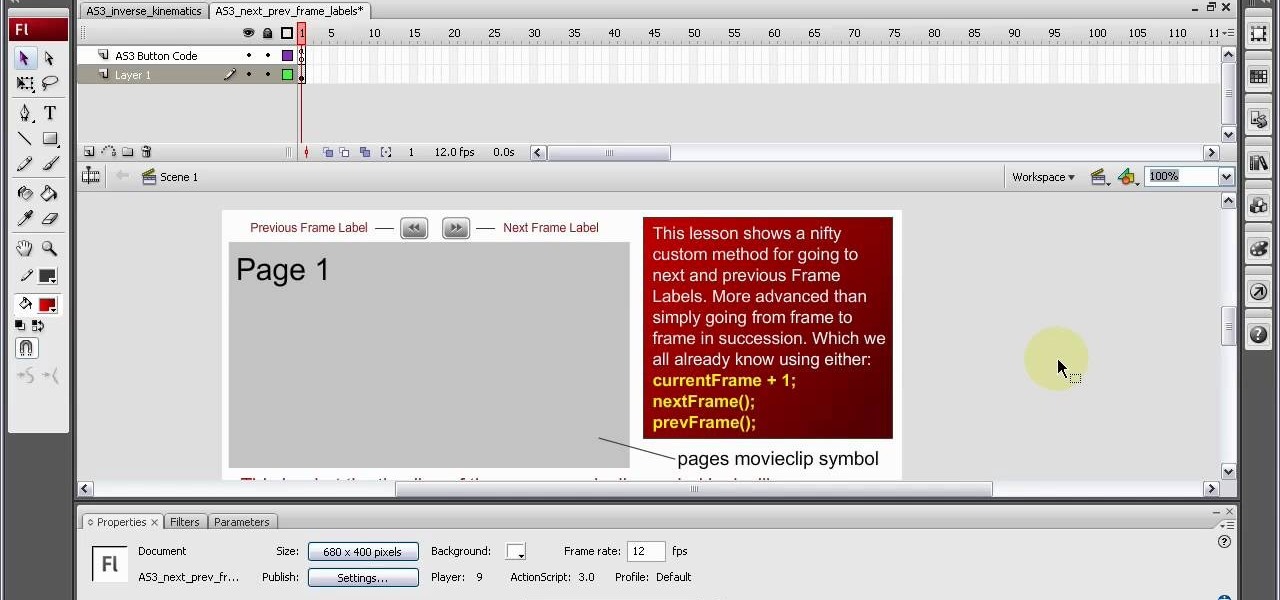
Frame labels are titles associated with certain segments of content (such as playing a tutorial in sequence and assigning each clip a separate frame label). This tutorial shows you how to set up a custom navigation system for your frame labels, so users can switch back and forth between segments.
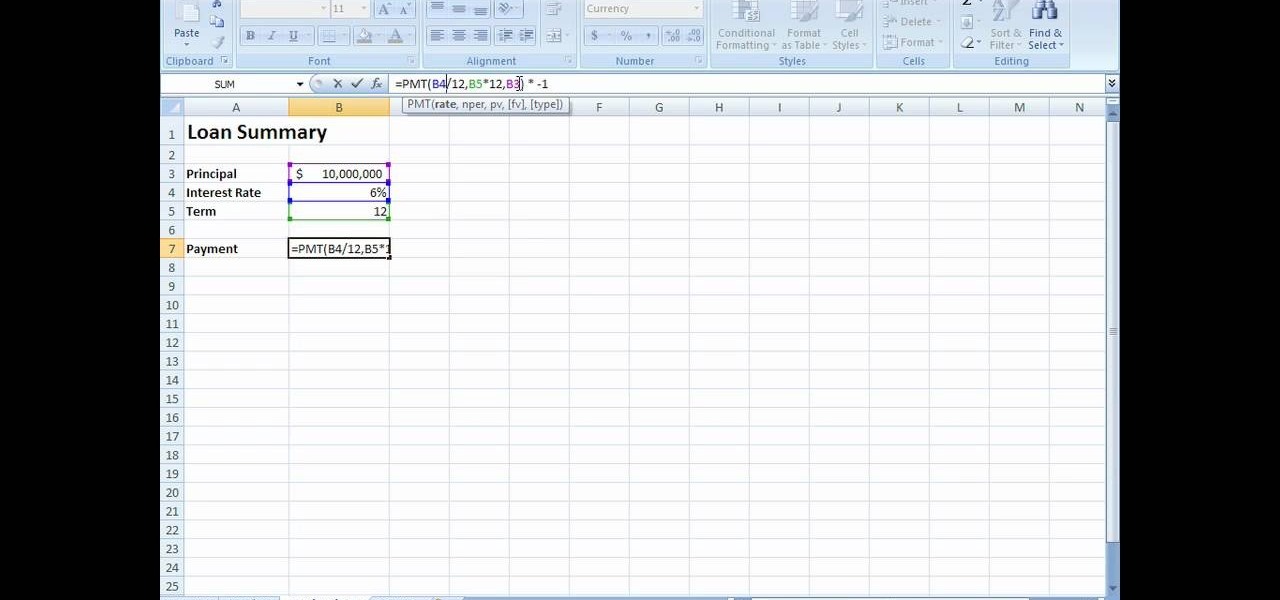
New to Microsoft Excel? Looking for a tip? How about a tip so mind-blowingly useful as to qualify as a magic trick? You're in luck. In this MS Excel tutorial from ExcelIsFun, the 255th installment in their series of digital spreadsheet magic tricks, you'll learn how to create a two-variable data table in Excel for what-if analysis. See the PMT function and learn about the formula equivalent to a data table.
A report by PwC highlights that immersive experiences in augmented and virtual reality represent the fastest growing segment of the entertainment and media industry over the next six years. News from two companies working in the industry, Fox and NetDragon, underscore the growth forecast.
If you use Microsoft Excel on a regular basis, odds are you work with numbers. Put those numbers to work. Statistical analysis allows you to find patterns, trends and probabilities within your data. In this MS Excel tutorial from everyone's favorite Excel guru, YouTube's ExcelsFun, the 43rd installment in his "Excel Statistics" series of free video lessons, you'll learn how to use the Excel Data Analysis add-in descriptive statistics tool.
If you use Microsoft Excel on a regular basis, odds are you work with numbers. Put those numbers to work. Statistical analysis allows you to find patterns, trends and probabilities within your data. In this MS Excel tutorial from everyone's favorite Excel guru, YouTube's ExcelsFun, the 13th installment in his "Excel Statistics" series of free video lessons, you'll learn how to install the Excel 2007 Data Analysis add-in.
A histogram is a summary graph showing a count of data points that fall in various ranges. Histograms are used in statistics and other forms of mathematics. In this video, learn how to create your own histogram using data analysis on the computer. This tutorial will show you how to create a frequency distribution, a cumulative frequency distribution, a histogram chart and an ogive chart with the data analysis add-in.
Step 1: Film yourself in the first position which you want your audience to see. Step 2: Film yourself in the second position you want your audience to see.
Citrus segments make refreshing additions to salads and desserts, but the bitter white pith and chewy membranes sometimes detract from the deliciousness. To make citrus segments -- sometimes called "supremes" -- the only tool needed is a sharp paring knife. Cut the top and bottom off the fruit, then carefully cut away the peel and pith, leaving as much of the fruit as possible.
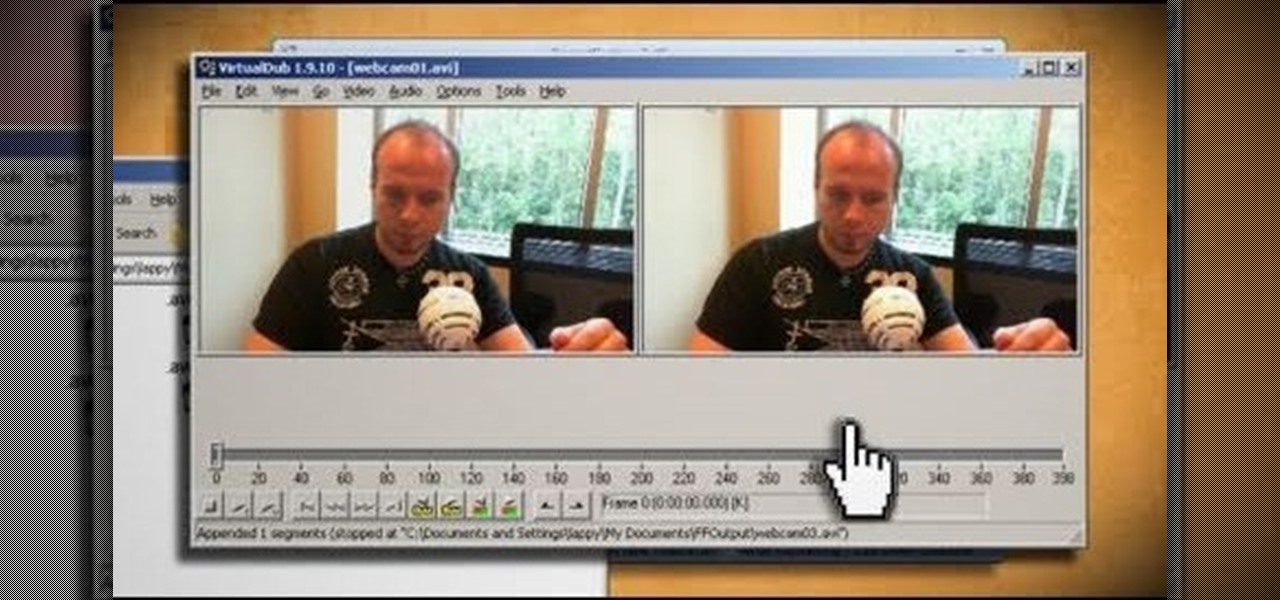
If you only want to take a clip a few minutes long from a larger movie, or split a movie into smaller segments, you can use the freeware Virtual Dub video editing program to accomplish this task (just make sure the file you're working with is already in .avi format).
From Ramanujan to calculus co-creator Gottfried Leibniz, many of the world's best and brightest mathematical minds have belonged to autodidacts. And, thanks to the Internet, it's easier than ever to follow in their footsteps (or just study for that next big test). With this installment from Internet pedagogical superstar Salman Khan's series of free math tutorials, you'll learn how to find the midpoint of a line segment in geometry.
Professional chef Michael Symon demonstrates the knife skills he uses to make cutting citrus fruits into membrane-free segments easy.
Learn how to prevent fallying prey to cmmon careless errors when doing fiscal analysis in MS Excel. Whether you're new to Microsoft's popular digital spreadsheet application or a seasoned business professional just looking to better acquaint yourself with the Excel 2010 workflow, you're sure to be well served by this video tutorial. For more information, including step-by-step instructions, take a look.
If you use Microsoft Excel on a regular basis, odds are you work with numbers. Put those numbers to work. Statistical analysis allows you to find patterns, trends and probabilities within your data. In this MS Excel tutorial from everyone's favorite Excel guru, YouTube's ExcelsFun, the 3rd installment in his "Excel Statistics" series of free video lessons, you'll learn how to use Excel's sorting and pivot tables (PivotTables) data analysis tools.
Repetition, repetition, repetition. Brainwashing, is it real? Watch these absolutely stunning segments of hidden camera containing both Bill Clinton, and Barbara Bush. Probably one of the most debatable segments is the one featuring Clinton talking to Larry King behind the scenes. If you turn your volume up it is hard to disregard, that they both in fact knew, Clinton would be elected, and the corruption in media is also clearly demonstrated. There is a segment with Barbara, staring eerily fo...
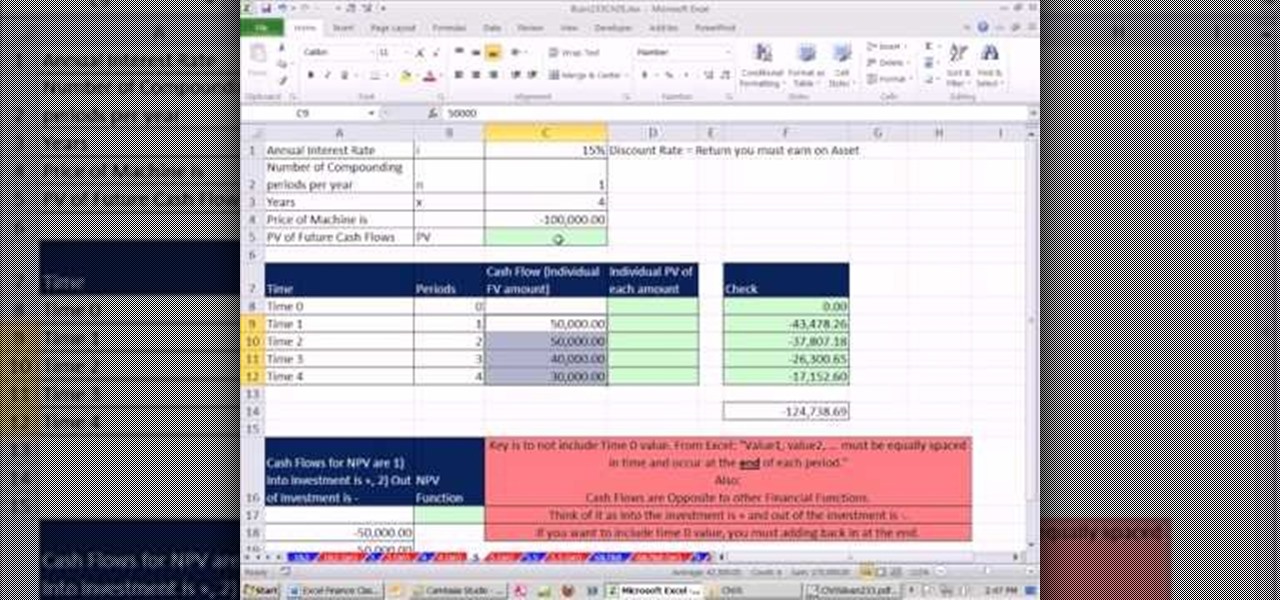
As you might guess, one of the domains in which Microsoft Excel really excels is finance math. Brush up on the stuff for your next or current job with this how-to. In this tutorial from everyone's favorite digital spreadsheet guru, YouTube's ExcelIsFun, part of his "Excel Finance Class" series of free video lessons, you'll learn how to use the PV and PMT functions together to do asset valuation using discounted cash flow analysis.
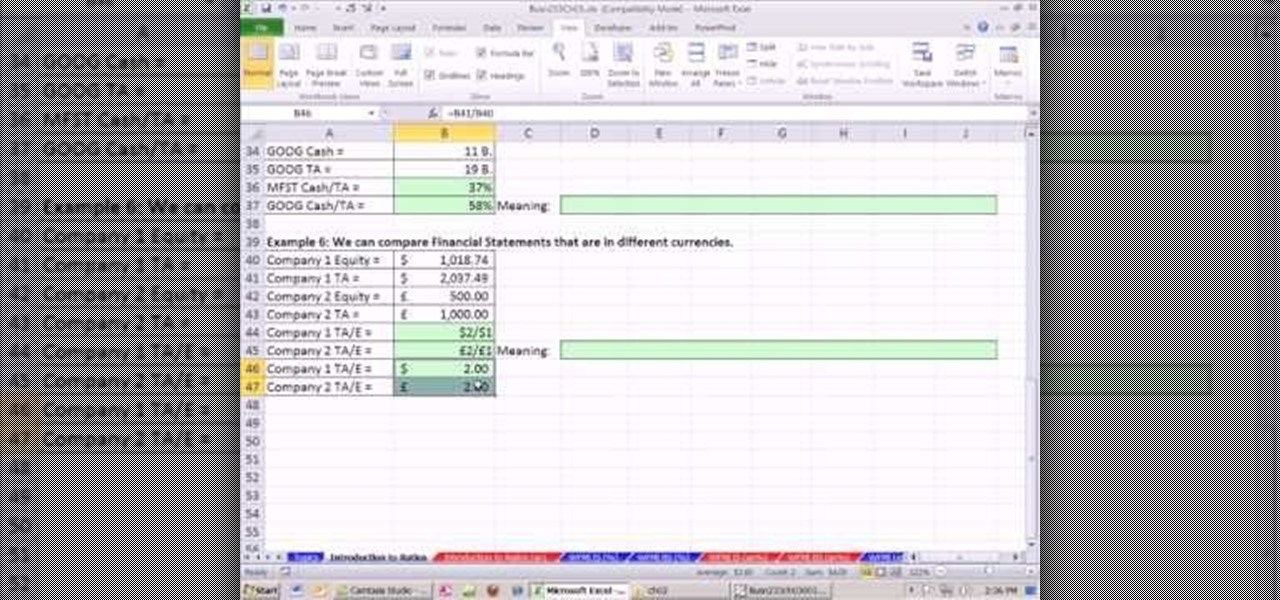
As you might guess, one of the domains in which Microsoft Excel really excels is finance math. Brush up on the stuff for your next or current job with this how-to. In this tutorial from everyone's favorite digital spreadsheet guru, YouTube's ExcelIsFun, the 17th installment in his "Excel Finance Class" series of free video lessons, you'll learn how to perform simple financial ratio analysis.
Interested in using Google's Page Speed performance analysis application? This clip will show you how it's done. It's simple! So simple, in fact, that this home-computing how-to can present a complete, step-by-step overview of the process in just over four minutes. For more information, including complete, step-by-step instructions, take a look.
As you might guess, one of the domains in which Microsoft Excel really excels is finance math. Brush up on the stuff for your next or current job with this how-to. In this tutorial from everyone's favorite digital spreadsheet guru, YouTube's ExcelIsFun, the 18th installment in his "Excel Finance Trick" series of free video lessons, you'll learn how to use the PMT and RATE functions for a complete debt/loan analysis.
This Achievement Hunter segment reveals how to unlock the Halo Warthog vehicle while playing Forza 4. You'll need to be in Autovista Mode before you can get it, and you'll need to complete all of the different challenges in the game including car bowling.
This two part segment will show you how to use the Wi-Fi tethering mobile hotspot functionality on your Motorola Droid Bionic smartphone for free after rooting it. Segment 2 of the guide will walk you through using Radiocomm to hide your tethering usage from Verizon Wireless so you're less likely to get caught.
This tutorial takes a look at how to model a segment of rope in Blender and then replicate it along a path using an Array and Curve modifier. Whether you're new to the Blender Foundation's popular open-source 3D computer graphics application or are a seasoned digital artist merely on the lookout for new tips and tricks, you're sure to be well served by this free video software tutorial from the folks at CG Cookie. For more information, including step-by-step instructions, take a look!
Step 1: Tie a Ponytail Use clear elastic to tie a ponytail and divide the ponytail into 2 segments.
In this tutorial, we learn how to bisect a line segment. First, you need to adjust your compass so the distance from the sharp part and the drawing part is the size of the line. Then, put the sharp part on one side and draw your arc with the pencil. Do this on both sides of the line so your image shows two arcs that intersect each other. Since you have these two intersecting lines, you can draw a line between these to show where the middle of the line would be. Use a ruler to draw this straig...
Hak5 isn't your ordinary tech show. It's hacking in the old-school sense, covering everything from network security, open source and forensics, to DIY modding and the homebrew scene. Damn the warranties, it's time to Trust your Technolust. In this episode, see how to edit Super Mario World levels with Lunar Magic.
The new 'Lonesome Road' DLC has arrived for Fallout: New Vegas, and with it comes several different achievements. In this particular Achievement Hunter segment, the guys take us through unlocking the 'Ed-Ecated' achievement in just a few steps. So grab those points on your Xbox 360 gamer profile.
In this segment from Achievement Hunter, the hunters will walk you through the process of finding several hidden easter eggs within the zombie paradise of Dead Island, including where to find the parents from the original trailer, the location of a porn zombie, and our good friend Jason Voorhees.