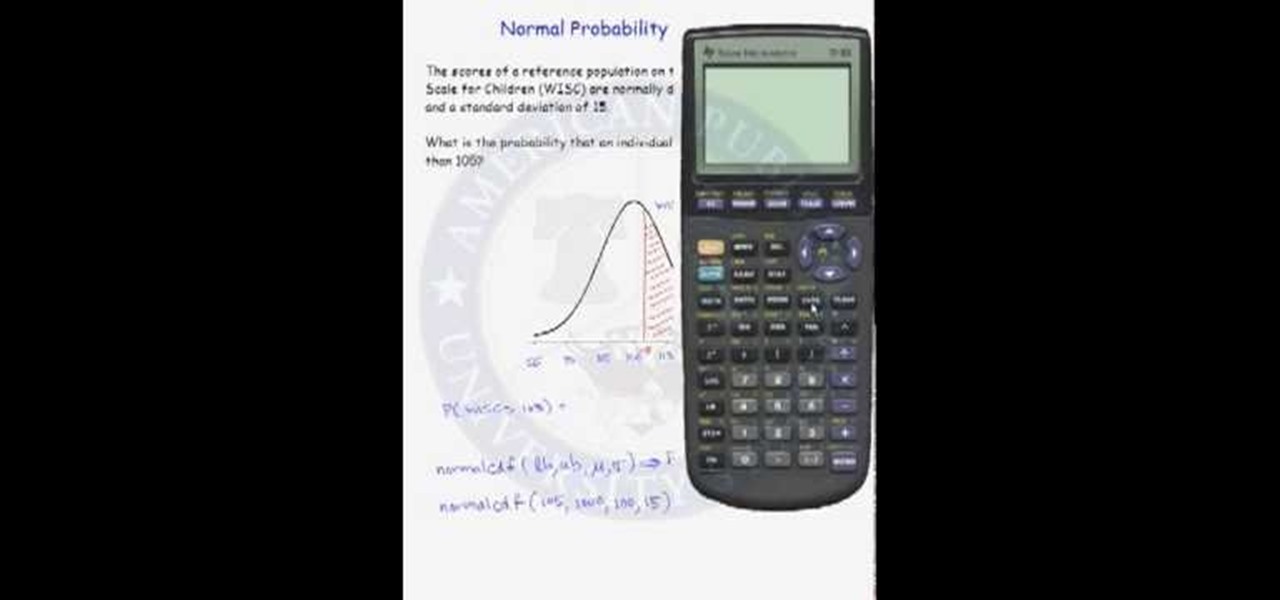
Probability computation is a complex process and even using a calculator can be difficult. But normal probability calculations can be performed quickly with the help of calculator once you know how to use it. So when you have to calculate a probability from a normal distribution you can use the functions on your scientific calculator. You can use the normal CDF function from you calculator to compute the area under a normal curve. The function requires lower band and upper band values, the me...
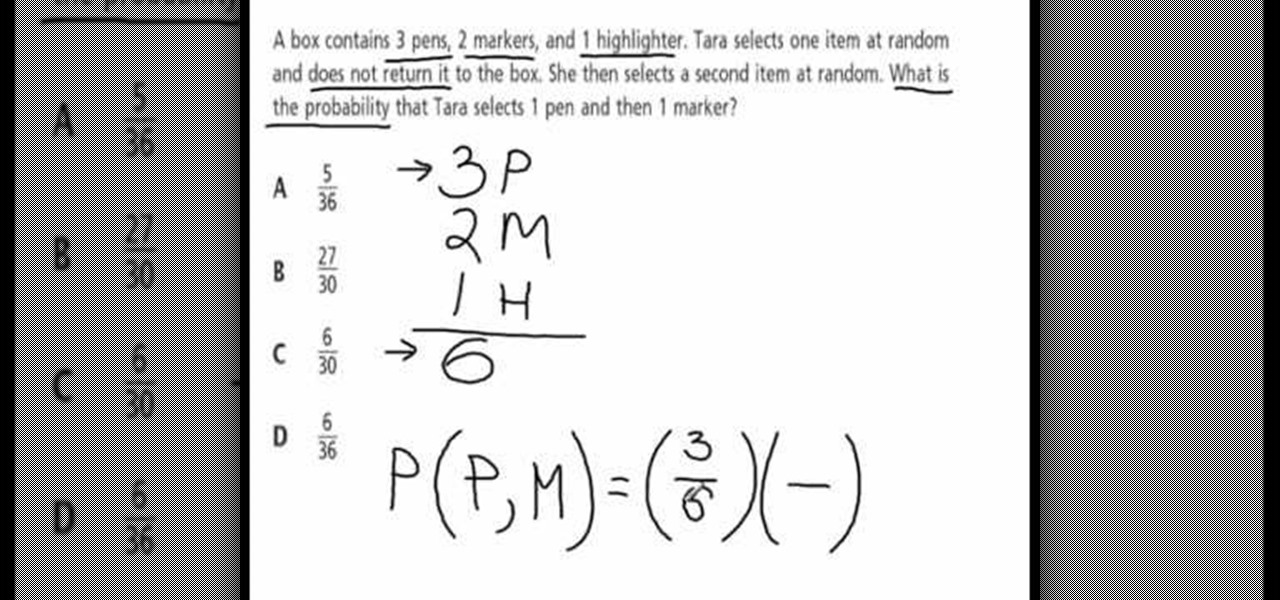
This video explains how to solve the problem of probability dependent events. In this video the problem is that a box contains three pens, 2 markers, and 1 highlighter. The person selects one item at random and does not return it to the box. So what is the probability that the person selects 1 pen and 1 marker. That is 6 items total. First she count the all items that involved in this problem. Then count the individual probability of the pen and marker. The person selects 3 pens out of 6 item...
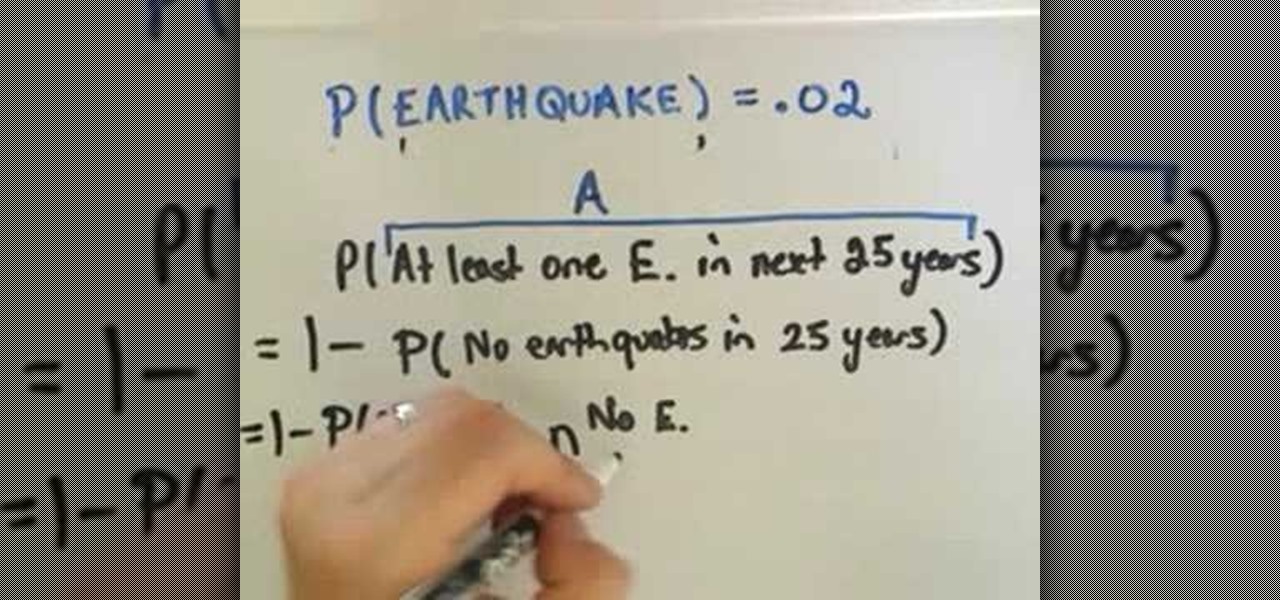
Calculating probablities can be used to help us make decision. PatrickJMT explains how to calculate probability in an "either A or not A" scenario. The probability of A plus the probability of not A is equal to one. Therefore, the probability of A is equal to one minus the probability of not A ; P(A)= 1 - P(not A). The probability of a major earthquake in San Francisco over a period of time is used as an example. The probablity of an earthquake of a magnitude of 7.5 or greater in San Francisc...
If you use Microsoft Excel on a regular basis, odds are you work with numbers. Put those numbers to work. Statistical analysis allows you to find patterns, trends and probabilities within your data. In this MS Excel tutorial from everyone's favorite Excel guru, YouTube's ExcelsFun, the 50th installment in his "Excel Statistics" series of free video lessons, you'll learn the basics of probability:
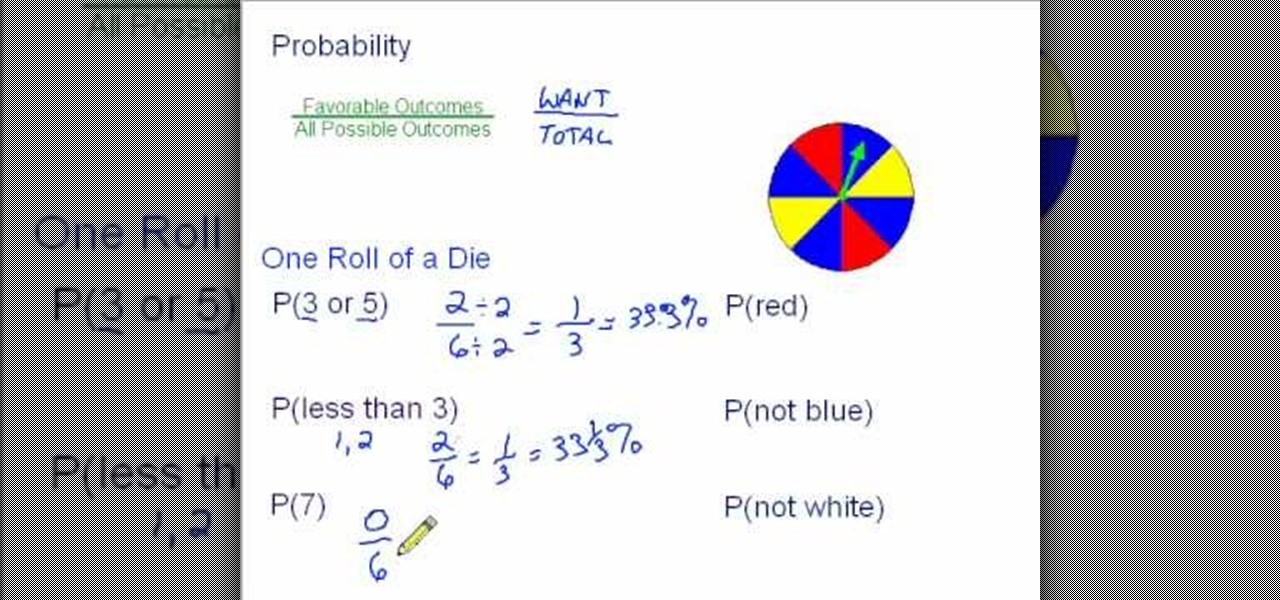
This is a very basic overview of probability, possibly intended for an eleven year old. It is a very good introduction to probability for one that has never encountered probability before. The instructor is not always clear in his intentions. Someone watching this video would learn about probability, ratios, percentages, and fraction. There is a set of required knowledge to understand what the instructor is talking about. The instructor uses very nice diagrams and also gives nice explanations...

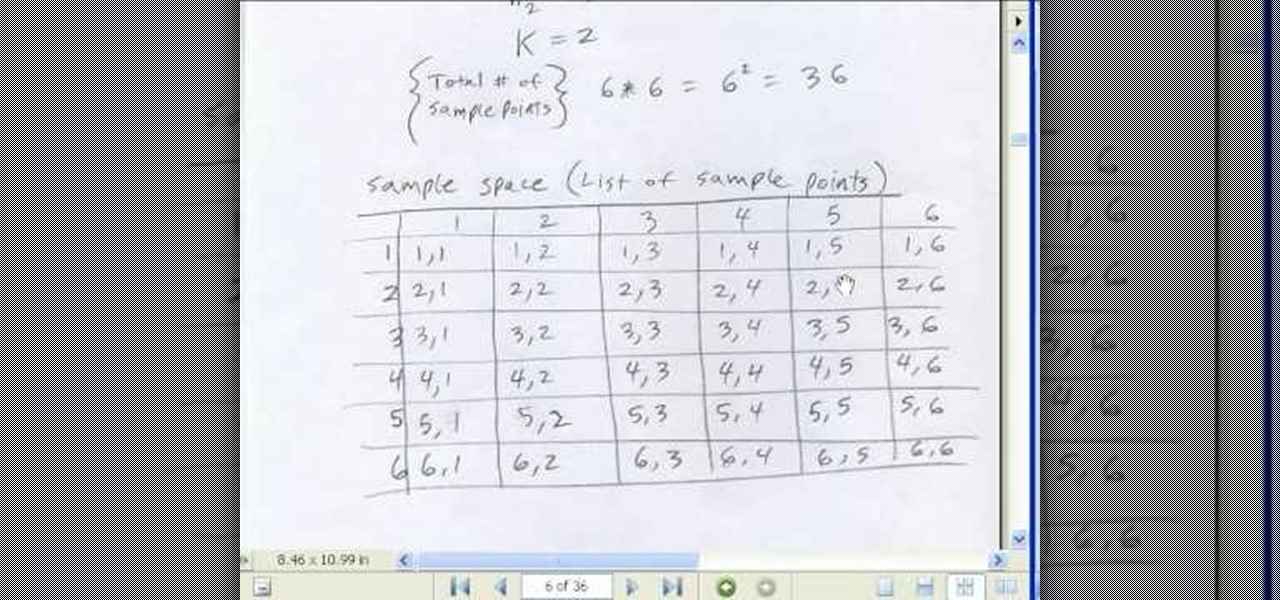
Watch the following math probability video to learn how to find the probability of two independent events. This will help you with your algebra or geometry homework.

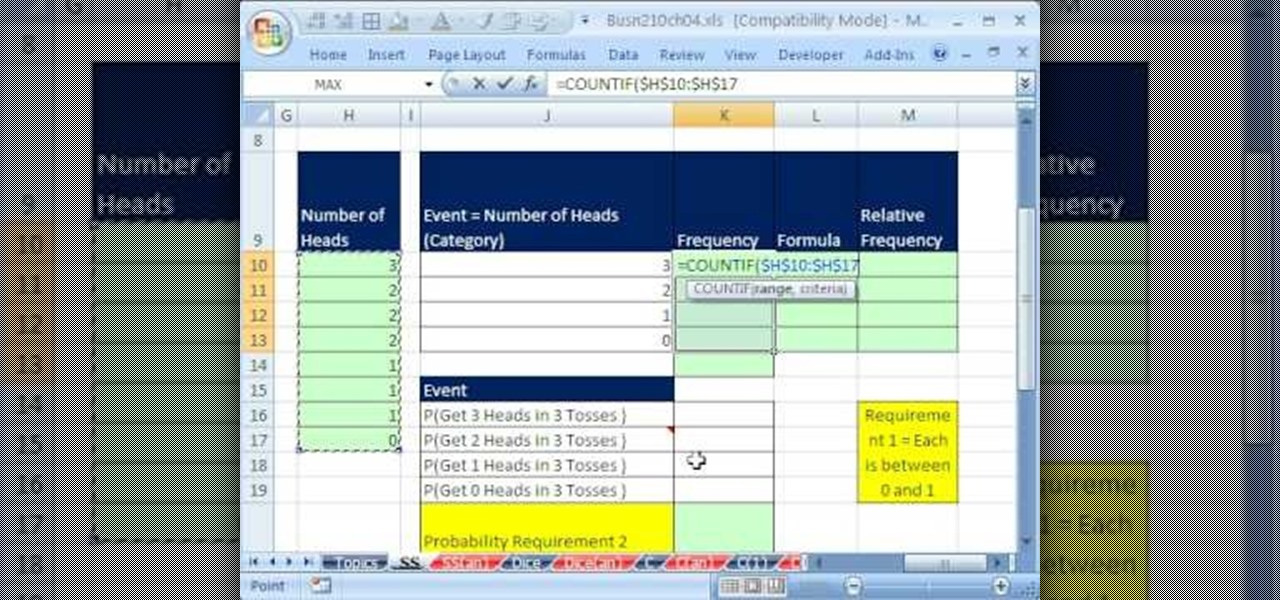
If you use Microsoft Excel on a regular basis, odds are you work with numbers. Put those numbers to work. Statistical analysis allows you to find patterns, trends and probabilities within your data. In this MS Excel tutorial from everyone's favorite Excel guru, YouTube's ExcelsFun, the 51st installment in his "Excel Statistics" series of free video lessons, you'll learn how to understand, work with and find simple probabilities in Microsoft Office Excel.
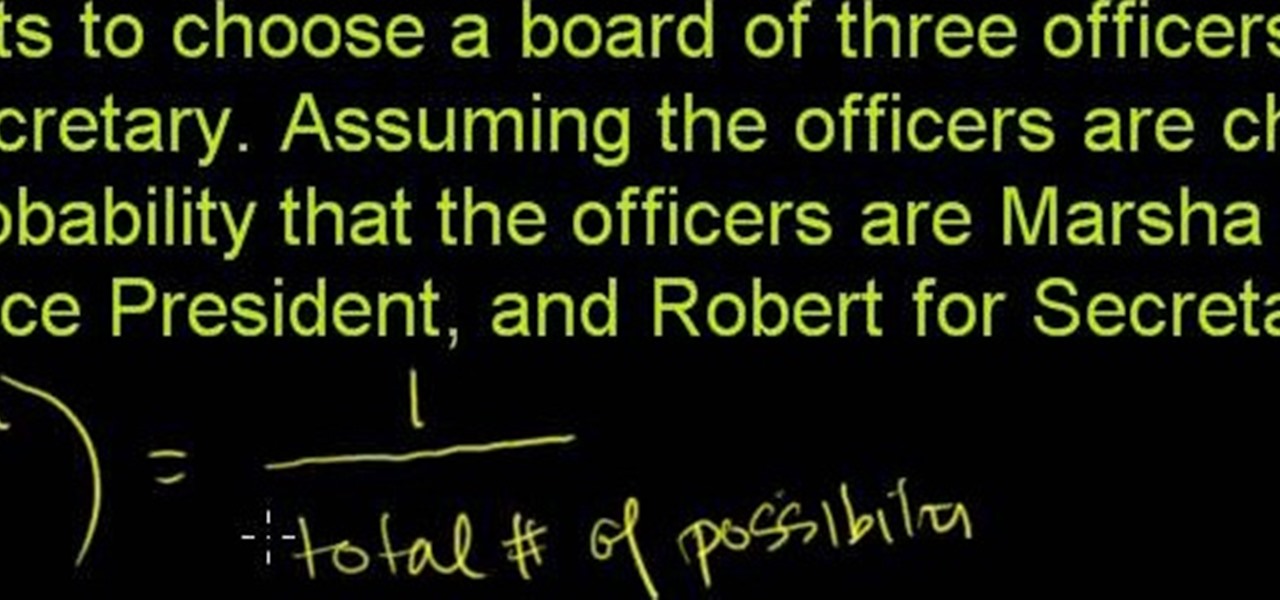
From Ramanujan to calculus co-creator Gottfried Leibniz, many of the world's best and brightest mathematical minds have belonged to autodidacts. And, thanks to the Internet, it's easier than ever to follow in their footsteps (or just finish your homework or study for that next big test). With this installment from Internet pedagogical superstar Salman Khan's series of free math tutorials, you'll learn how to calculate the probability of two dependent events in statistics.
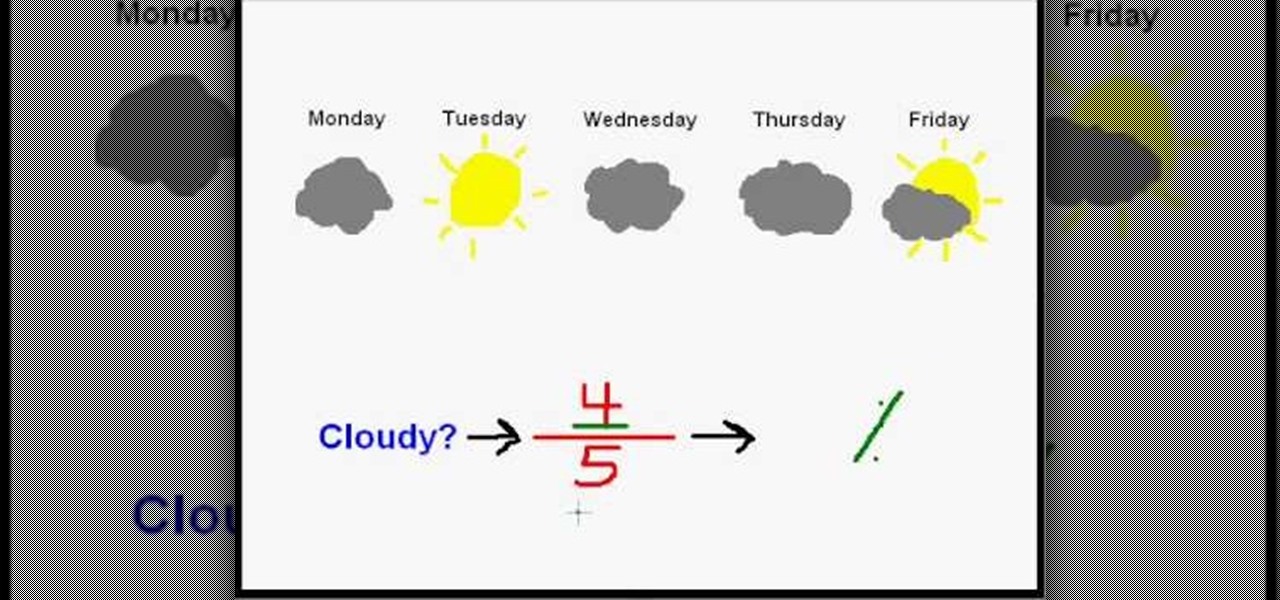
In this video, we learn how to use probability to predict weather. Probability is the chance of something happening. If you want to know what the weather is going to be like, you can look at the weather report and see what each day is going to do throughout the week. Ask yourself what the probability is that the weather will be cloudy, judging from what the current work week weather is. First, figure out how many days there are total and then find out how many are cloudy versus how many are s...
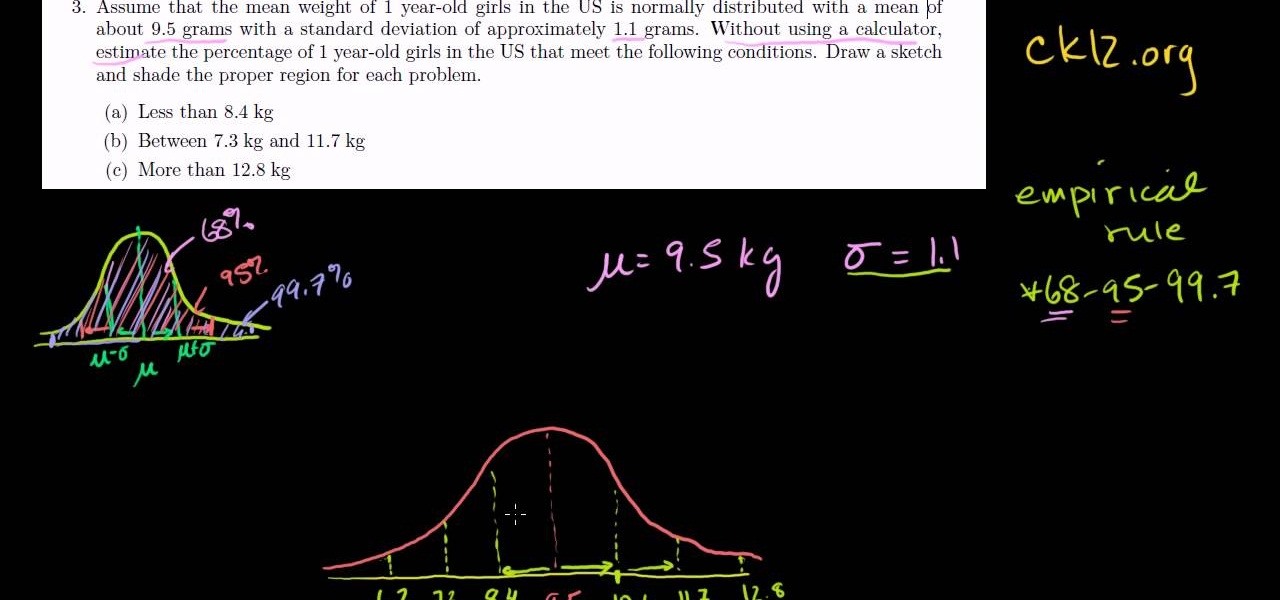
Learn how to use the empirical rule (or 68-95-99.7 rule) to estimate probabilities for normal distributions in statistics. From Ramanujan to calculus co-creator Gottfried Leibniz, many of the world's best and brightest mathematical minds have belonged to autodidacts. And, thanks to the Internet, it's easier than ever to follow in their footsteps (or just finish your homework or study for that next big test). With this installment from Internet pedagogical superstar Salman Khan's series of fre...
One of Microsoft Excel's capabilities is to allow you to graph Normal Distribution, or the probability density function, for your busines. This is a quick and easy tracking feature you can learn in just a few minutes.
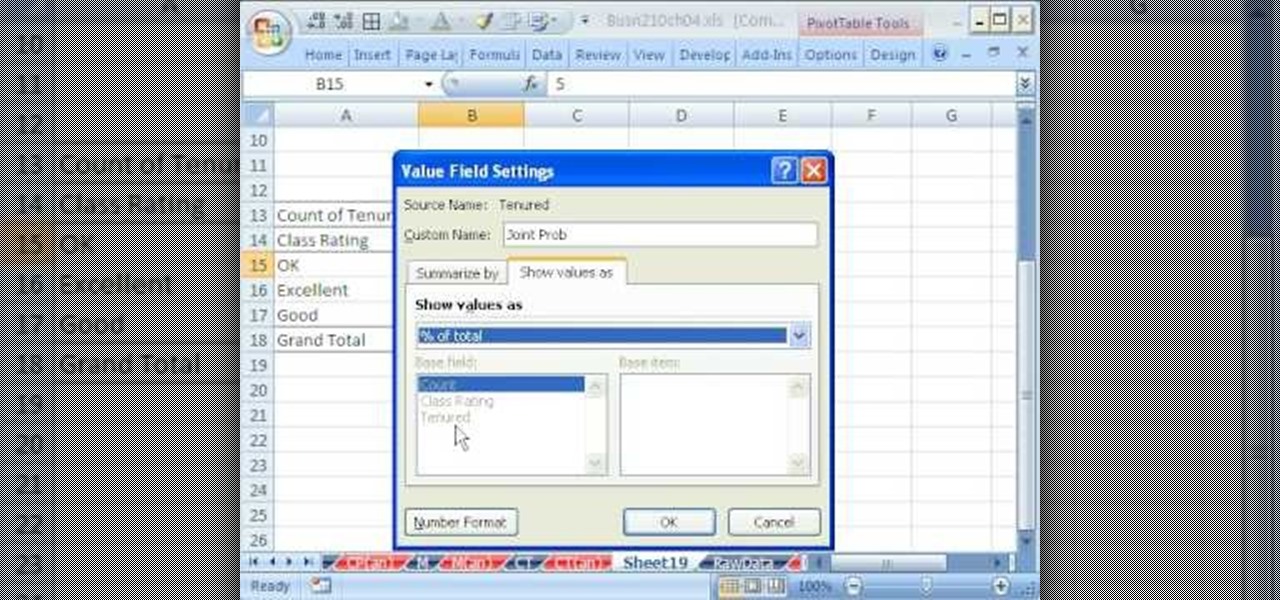
New to Microsoft Excel? Looking for a tip? How about a tip so mind-blowingly useful as to qualify as a magic trick? You're in luck. In this MS Excel tutorial from ExcelIsFun, the 55th installment in their series of digital spreadsheet magic tricks, you'll learn how to calculate probabilities with a pivot table (PivotTable). Specifically, you'll learn how to find joint, marginal and conditional probabilities.
This video will introduce you to the probabilities and odds of hitting your cards based upon what you have. Excellent beginners manual for what cards to play and the odds of winning with them.
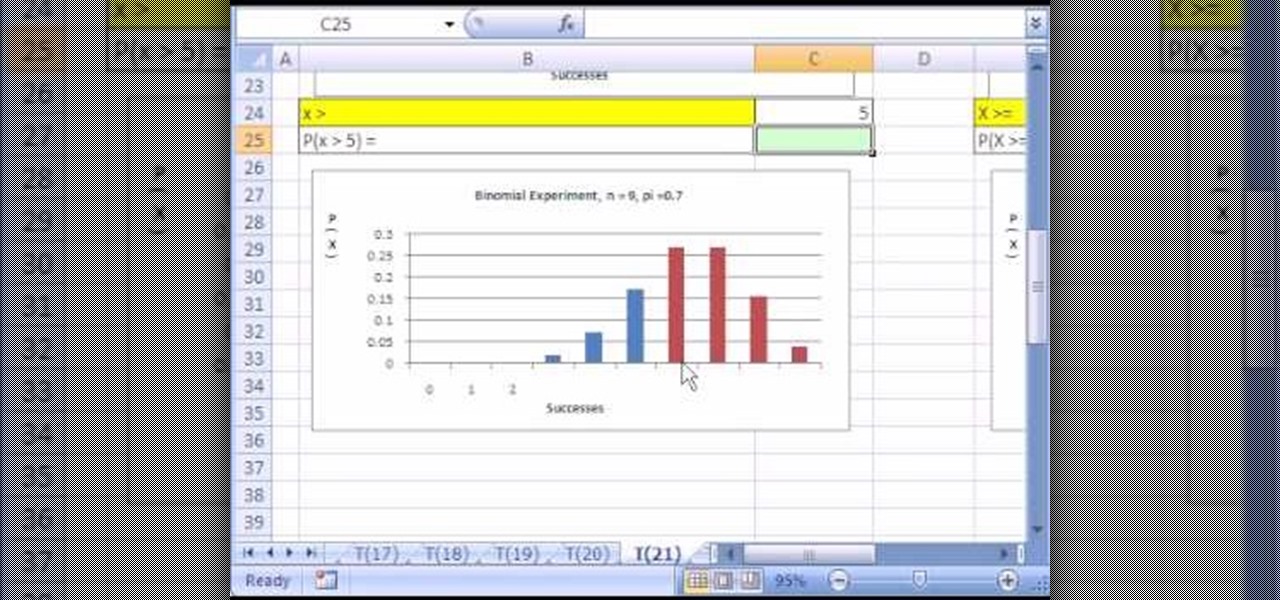
New to Microsoft Excel? Looking for a tip? How about a tip so mind-blowingly useful as to qualify as a magic trick? You're in luck. In this MS Excel tutorial from ExcelIsFun, the 21st installment in their series of digital spreadsheet magic tricks, you'll learn how to use the BINOMDIST function to calculate probabilities for a binomial experiment - binomial distribution!
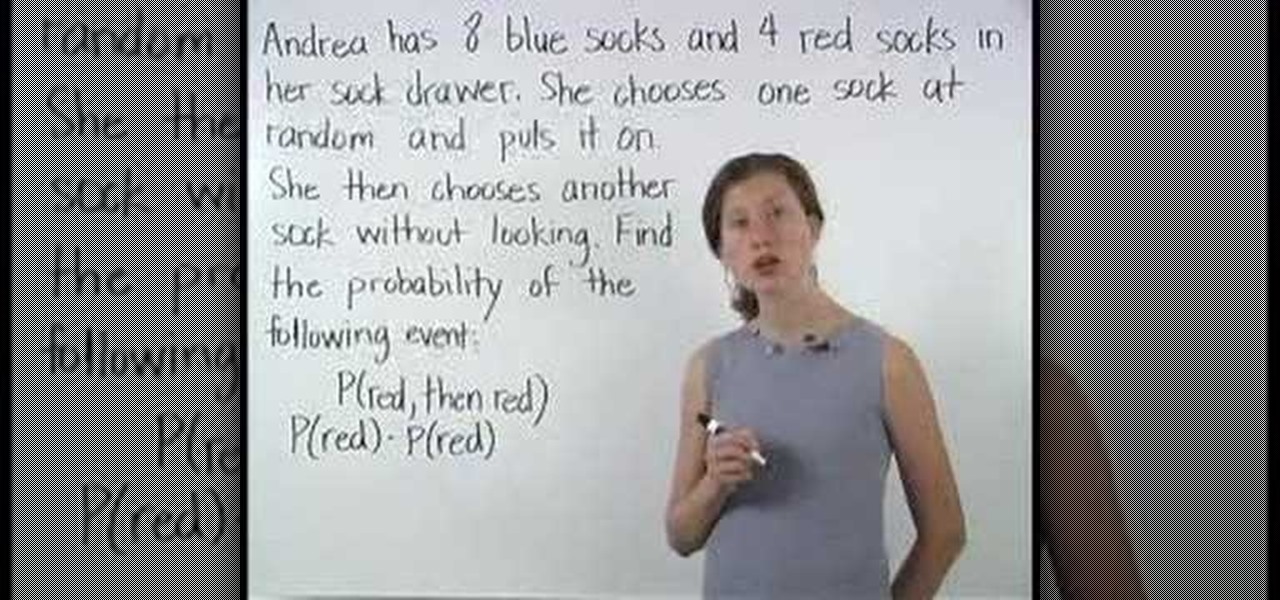
In this video you will learn how to use probability of dependent events. The video starts with a small advertisement to there website http://www.yourteacher.com. Then its followed up by a math instructor taking you through a example problem to help you understand how you can begin solving problems of your own. The problem used in the example is: Andrea has 4 red socks and 8 blue socks in her drawer, she chooses one sock at random and puts it on, she then chooses another sock without looking, ...
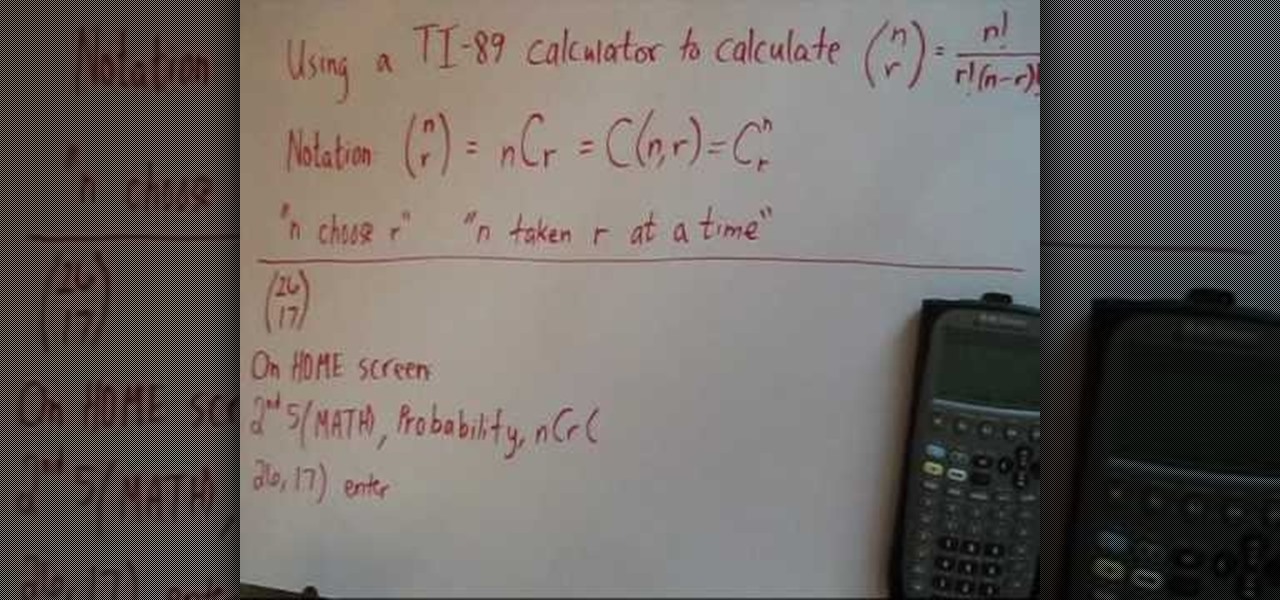
This video shows you how to do a mathematical representation on computing the nCr function using a TI-89 calculator. You can write the nCr notation in different forms. It can be simplified from nCr to C(n,r). The symbol can either be read "n choose r" or "n taken r at a time" which are from it's probability applications. On the example to find "26 choose 17", go to the Home screen of the TI-89 calculator and then go 2nd 5 which is Math. Go choose probability and then to nCr to type in (26,17)...
Need a new prank or trick to play on your friends? Well this video is your solution. All you need a non-transitive dice and to follow this video and you will be cheating your friend in no time. The idea behind this video is to use dice that are non standard, which means instead of having from 1 to 6 on the sides, they have other numbers. By playing with what numbers go on the faces, the viewers can skew with the probabilities of what number comes up. With this idea, the viewers can make dice ...
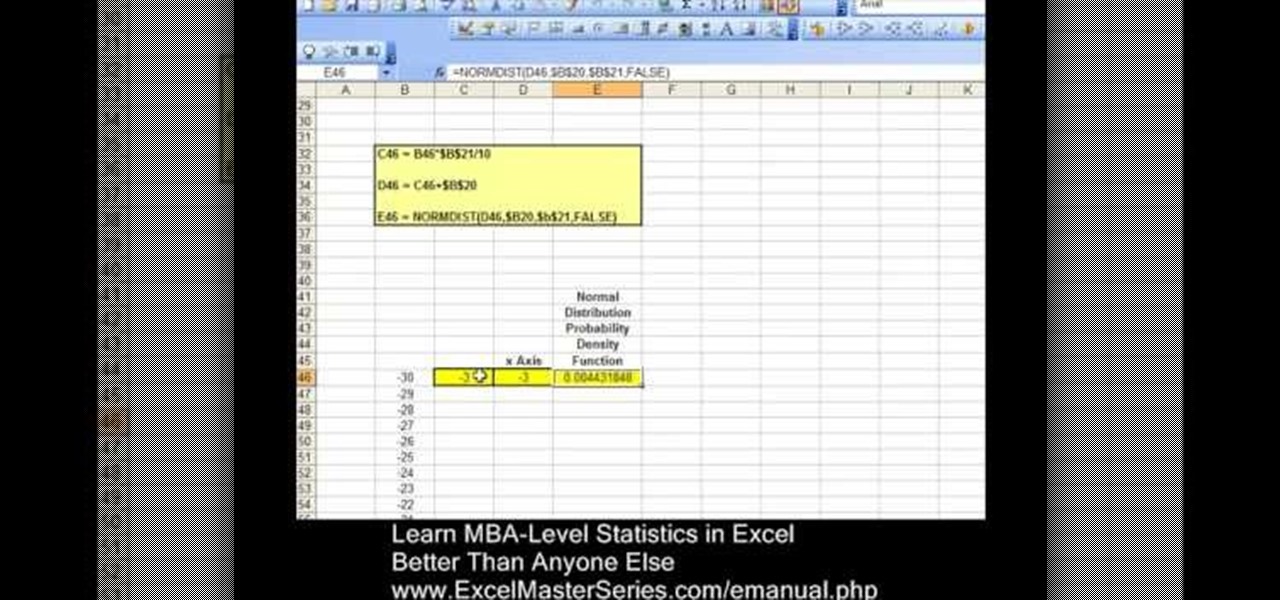
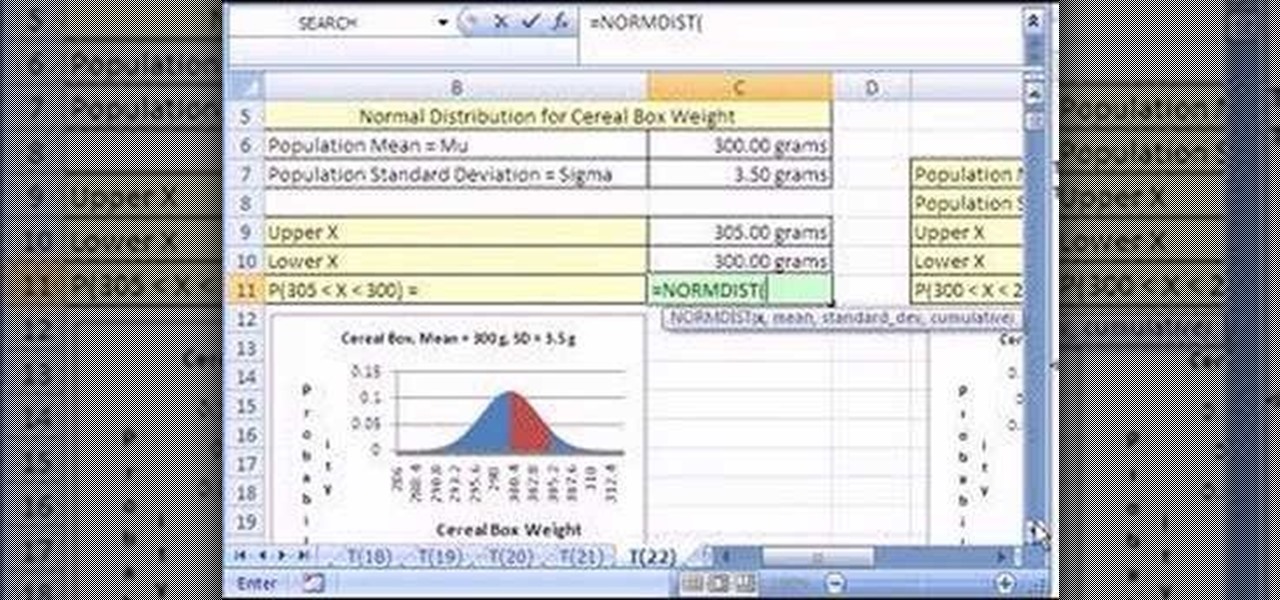
New to Microsoft Excel? Looking for a tip? How about a tip so mind-blowingly useful as to qualify as a magic trick? You're in luck. In this MS Excel tutorial from ExcelIsFun, the 22nd installment in their series of digital spreadsheet magic tricks, you'll learn how to use the NORMDIST function to calculate probabilities for a population with a normal (bell) distribution! You even get to see the four types of situations that you most commonly encounter -- plus visual pictures of each situation...
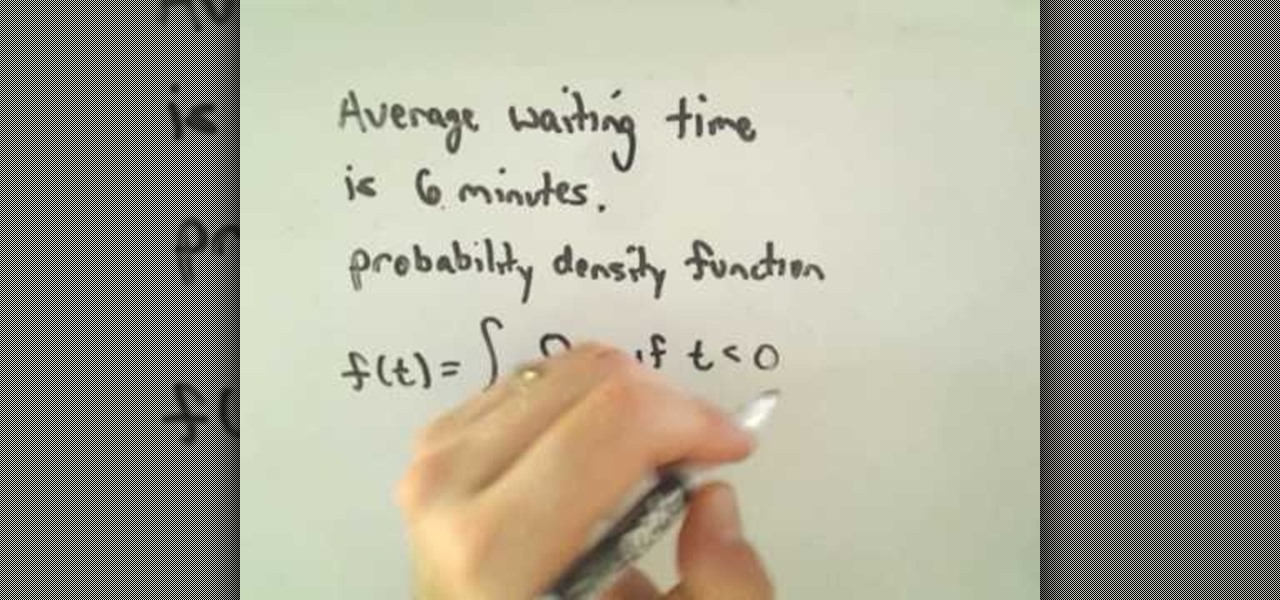
Looking for a primer on how to work with BRIEF probability density functions and continuous random variables in calculus? Learn how with this free video calc lesson. From Ramanujan to calculus co-creator Gottfried Leibniz, many of the world's best and brightest mathematical minds have belonged to autodidacts. And, thanks to the Internet, it's easier than ever to follow in their footsteps (or just finish your homework or study for that next big test).
If you use Microsoft Excel on a regular basis, odds are you work with numbers. Put those numbers to work. Statistical analysis allows you to find patterns, trends and probabilities within your data. In this MS Excel tutorial from everyone's favorite Excel guru, YouTube's ExcelsFun, the 45th installment in his "Excel Statistics" series of free video lessons, you'll learn how to see how to calculate a z-score.
If you use Microsoft Excel on a regular basis, odds are you work with numbers. Put those numbers to work. Statistical analysis allows you to find patterns, trends and probabilities within your data. In this MS Excel tutorial from everyone's favorite Excel guru, YouTube's ExcelsFun, the 35.2nd installment in his "Excel Statistics" series of free video lessons, you'll learn how to use Excel's GEOMEAN function to find geometric mean.
If you use Microsoft Excel on a regular basis, odds are you work with numbers. Put those numbers to work. Statistical analysis allows you to find patterns, trends and probabilities within your data. In this MS Excel tutorial from everyone's favorite Excel guru, YouTube's ExcelsFun, the 40th installment in his "Excel Statistics" series of free video lessons, you'll learn how to calculate range & interquartile range for variability using the MAX, MIN, QUARTILE functions.
If you use Microsoft Excel on a regular basis, odds are you work with numbers. Put those numbers to work. Statistical analysis allows you to find patterns, trends and probabilities within your data. In this MS Excel tutorial from everyone's favorite Excel guru, YouTube's ExcelsFun, the 86th installment in his "Excel Statistics" series of free video lessons, you'll learn how to construct confidence intervals for proportions using NORMSINV function and other formulas.
If you use Microsoft Excel on a regular basis, odds are you work with numbers. Put those numbers to work. Statistical analysis allows you to find patterns, trends and probabilities within your data. In this MS Excel tutorial from everyone's favorite Excel guru, YouTube's ExcelsFun, the 87th installment in his "Excel Statistics" series of free video lessons, you'll learn how to calculate sample size (n) for confidence intervals.
If you use Microsoft Excel on a regular basis, odds are you work with numbers. Put those numbers to work. Statistical analysis allows you to find patterns, trends and probabilities within your data. In this MS Excel tutorial from everyone's favorite Excel guru, YouTube's ExcelsFun, the 27th installment in his "Excel Statistics" series of free video lessons, you'll learn how to create a quantitative data dot plot chart using the REPT and COUNTIF functions.
If you use Microsoft Excel on a regular basis, odds are you work with numbers. Put those numbers to work. Statistical analysis allows you to find patterns, trends and probabilities within your data. In this MS Excel tutorial from everyone's favorite Excel guru, YouTube's ExcelsFun, the 26th installment in his "Excel Statistics" series of free video lessons, you'll learn how to create quantitative data cumulative frequency distributions with pivot tables.
If you use Microsoft Excel on a regular basis, odds are you work with numbers. Put those numbers to work. Statistical analysis allows you to find patterns, trends and probabilities within your data. In this MS Excel tutorial from everyone's favorite Excel guru, YouTube's ExcelsFun, the 16th installment in his "Excel Statistics" series of free video lessons, you'll learn how to cross tabulate & do percentage cross tabulation for categorical data using a pivot table (PivotTable).
If you use Microsoft Excel on a regular basis, odds are you work with numbers. Put those numbers to work. Statistical analysis allows you to find patterns, trends and probabilities within your data. In this MS Excel tutorial from everyone's favorite Excel guru, YouTube's ExcelsFun, the 19th installment in his "Excel Statistics" series of free video lessons, you'll learn how to group categories in a frequency distribution with a formula (2 COUNTIF) and the pivot table (PivotTable) grouping fea...
If you use Microsoft Excel on a regular basis, odds are you work with numbers. Put those numbers to work. Statistical analysis allows you to find patterns, trends and probabilities within your data. In this MS Excel tutorial from everyone's favorite Excel guru, YouTube's ExcelsFun, the 17th installment in his "Excel Statistics" series of free video lessons, you'll learn how to cross tabulate & do percentage cross tabulation for categorical data using formulas rather than pivot tables.
If you use Microsoft Excel on a regular basis, odds are you work with numbers. Put those numbers to work. Statistical analysis allows you to find patterns, trends and probabilities within your data. In this MS Excel tutorial from everyone's favorite Excel guru, YouTube's ExcelsFun, the 3rd installment in his "Excel Statistics" series of free video lessons, you'll learn how to use Excel's sorting and pivot tables (PivotTables) data analysis tools.
If you use Microsoft Excel on a regular basis, odds are you work with numbers. Put those numbers to work. Statistical analysis allows you to find patterns, trends and probabilities within your data. In this MS Excel tutorial from everyone's favorite Excel guru, YouTube's ExcelsFun, the 35th installment in his "Excel Statistics" series of free video lessons, you'll learn how to calculate weighted and geometric means and see how to use the GEOMEAN function.
If you use Microsoft Excel on a regular basis, odds are you work with numbers. Put those numbers to work. Statistical analysis allows you to find patterns, trends and probabilities within your data. In this MS Excel tutorial from everyone's favorite Excel guru, YouTube's ExcelsFun, the 33rd installment in his "Excel Statistics" series of free video lessons, you'll learn how to use the AVEARGE, MEDIAN, MODE, PERCENTILE, QUARTILE and PERCENTILERANK functions to measure location.
If you use Microsoft Excel on a regular basis, odds are you work with numbers. Put those numbers to work. Statistical analysis allows you to find patterns, trends and probabilities within your data. In this MS Excel tutorial from everyone's favorite Excel guru, YouTube's ExcelsFun, the 4th installment in his "Excel Statistics" series of free video lessons, you'll learn how to create a frequency table and percentage frequency table using a Pivot Table (PivotTable).
If you use Microsoft Excel on a regular basis, odds are you work with numbers. Put those numbers to work. Statistical analysis allows you to find patterns, trends and probabilities within your data. In this MS Excel tutorial from everyone's favorite Excel guru, YouTube's ExcelsFun, the 44th installment in his "Excel Statistics" series of free video lessons, you'll learn how to use the SKEW function to calculate the skew in a distribution of data.
f you use Microsoft Excel on a regular basis, odds are you work with numbers. Put those numbers to work. Statistical analysis allows you to find patterns, trends and probabilities within your data. In this MS Excel tutorial from everyone's favorite Excel guru, YouTube's ExcelsFun, the 37th installment in his "Excel Statistics" series of free video lessons, you'll learn how to use the PERCENTILE and QUARTILE functions.
If you use Microsoft Excel on a regular basis, odds are you work with numbers. Put those numbers to work. Statistical analysis allows you to find patterns, trends and probabilities within your data. In this MS Excel tutorial from everyone's favorite Excel guru, YouTube's ExcelsFun, the 47th installment in his "Excel Statistics" series of free video lessons, you'll learn about the basics of the empirical rule (the bell curve) and how to apply it in various ways.
If you use Microsoft Excel on a regular basis, odds are you work with numbers. Put those numbers to work. Statistical analysis allows you to find patterns, trends and probabilities within your data. In this MS Excel tutorial from everyone's favorite Excel guru, YouTube's ExcelsFun, the 89th installment in his "Excel Statistics" series of free video lessons, you'll learn how to use the NORMSINV function for critical values and the NORSDIST function for p-values.
If you use Microsoft Excel on a regular basis, odds are you work with numbers. Put those numbers to work. Statistical analysis allows you to find patterns, trends and probabilities within your data. In this MS Excel tutorial from everyone's favorite Excel guru, YouTube's ExcelsFun, the 91st installment in his "Excel Statistics" series of free video lessons, you'll learn how to use TINV and TDIST functions to find critical values given an unknown sigma value.
If you use Microsoft Excel on a regular basis, odds are you work with numbers. Put those numbers to work. Statistical analysis allows you to find patterns, trends and probabilities within your data. In this MS Excel tutorial from everyone's favorite Excel guru, YouTube's ExcelsFun, the 80th installment in his "Excel Statistics" series of free video lessons, you'll learn how to construct confidence intervals when the sigma is known known using the CONFIDENCE and NORMSINV functions.
If you use Microsoft Excel on a regular basis, odds are you work with numbers. Put those numbers to work. Statistical analysis allows you to find patterns, trends and probabilities within your data. In this MS Excel tutorial from everyone's favorite Excel guru, YouTube's ExcelsFun, the 21st installment in his "Excel Statistics" series of free video lessons, you'll learn how to build labels and counting formulas for a frequency distribution.