

News: Renault Trucks Tests HoloLens to Visualize Quality Control in Engine Assembly Operations
French manufacturer Renault Trucks is looking to the HoloLens to improve quality control processes with its engine assembly operations.

French manufacturer Renault Trucks is looking to the HoloLens to improve quality control processes with its engine assembly operations.
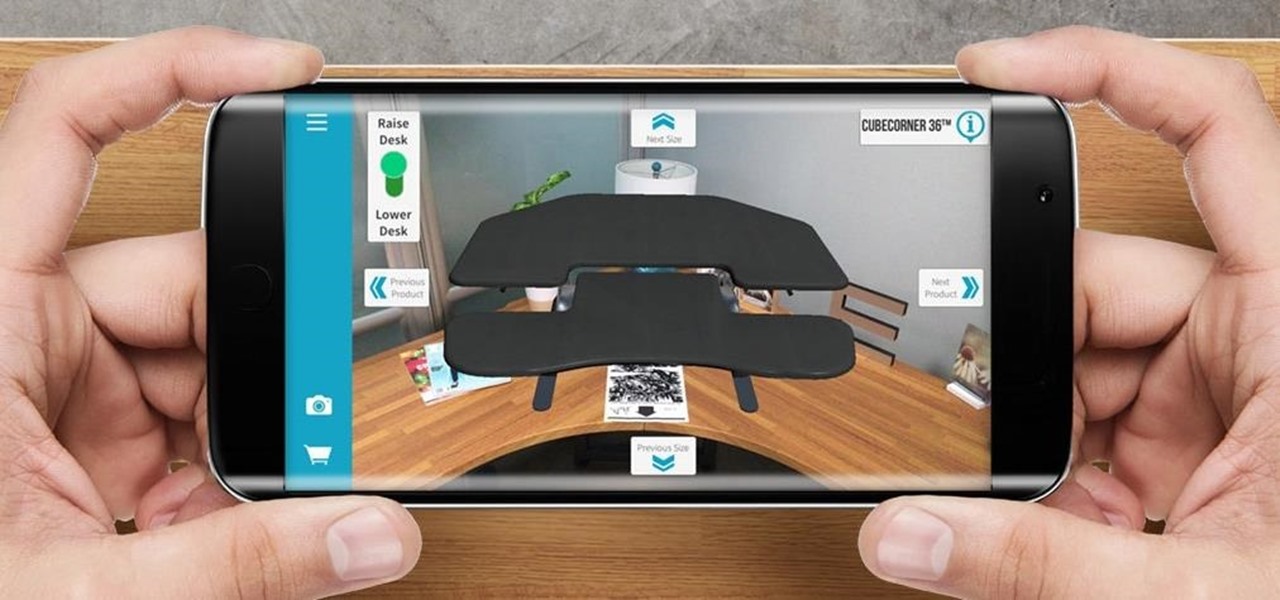
The standing desk movement has gained momentum over the past few years as research has pointed to the detrimental health effects of sitting at a desk all day.
One of the problems with the default history viewer built into Firefox is the unappealing and hard-to-find interface. If you're looking for a better way to organize your browser history, check out History Tree.

This tutorial on the companion Tech Ease for Mac site shows you how to use Inspiredata to collect, organize, and visualize data using several types of diagrams supported by the program. The movies were recorded on a Mac, but Inspiredata is a cross-platform program so the steps shown should work on the Windows version of the program as well. Inspiredata works like a database system that allows you to add notes and more.

From Ramanujan to calculus co-creator Gottfried Leibniz, many of the world's best and brightest mathematical minds have belonged to autodidacts. And, thanks to the Internet, it's easier than ever to follow in their footsteps (or just study for that next big test). With this installment from Internet pedagogical superstar Salman Khan's series of free math tutorials, you'll learn how to create a simple histogram chart.
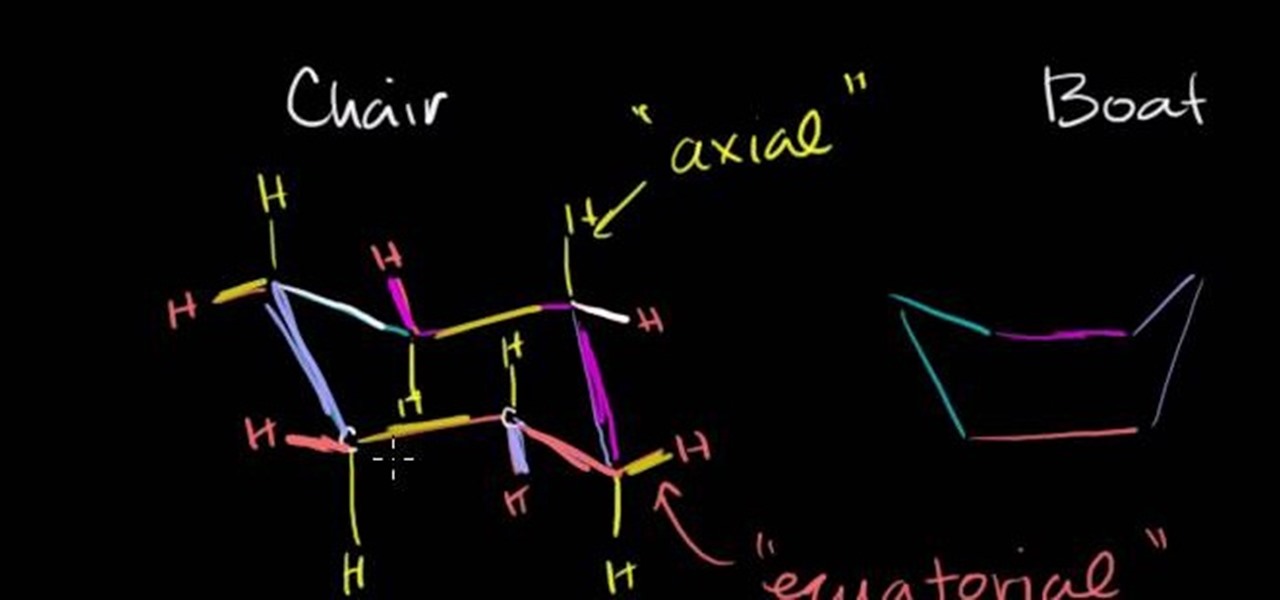
In this free video science lesson from Internet pedagogical superstar Salman Khan, you'll learn how to represent and interpret cyclohexane molecules in organic chemistry. Whether you need help studying for that next big test or could just use a hand finishing your homework, you're sure to be well served by this video lesson. For more information, including detailed, step-by-step instructions, take a look.

Interested in turning the comings and goings of your cursor into modern art? It's easy! So easy, in fact, that this home-computing how-to from the folks at TekZilla can present a complete overview of the process in just two minutes. For more information, including step-by-step instructions, take a look.
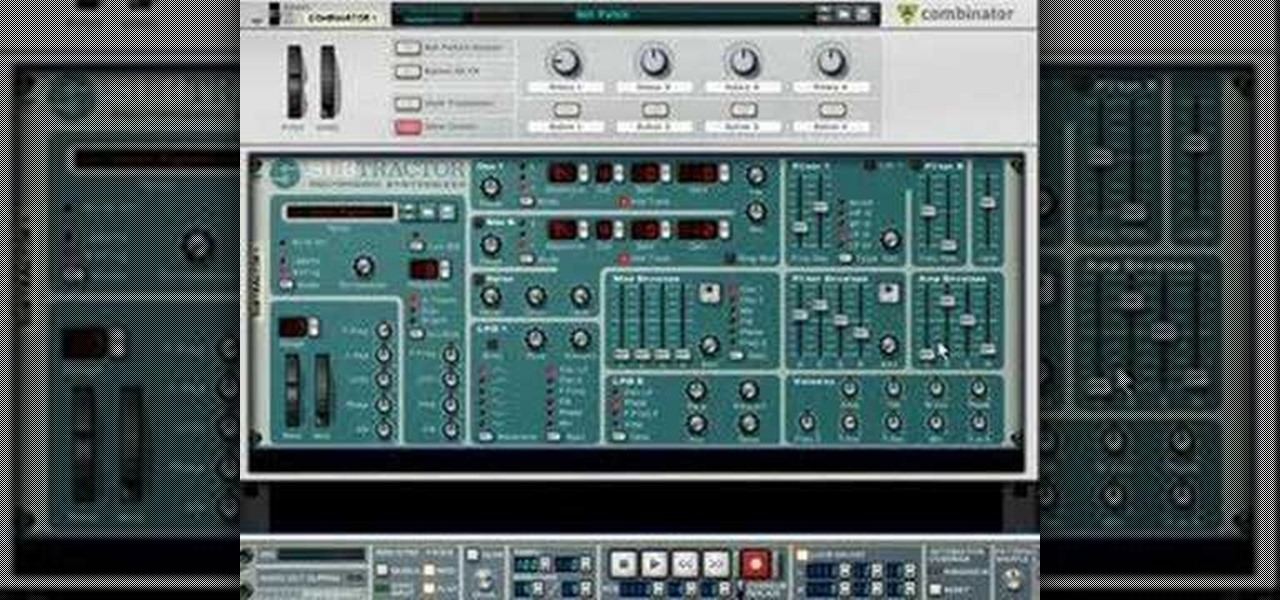
In this music production software tutorial you will learn a quick Reason trick - how to actually "See" the effect of your filter or mod envelopes in real time. This visualization trick works with any Reason instrument. Set it up and watch it move each time you press a key inf a filter or mod envelope effect.

Similar to the 90 degree rule, the 30 degree rule is demonstrated in this video. Your two forefingers in a V-shape are the best tools to use for visualizing this angle.

This video is a tutorial video. This video is showing the viewer how to change the visualize on their Playstation 3. He shows a step by step guide on how to get to the visualizer on your Playstation and he shows what the play station should look like if you are following the steps correctly. He shows the features that you can manipulate on the visualizer. He shows how you can change the color and change the overall look of the visualizer. He explains how the Playstation is easy to manipulate ...

This video shows how to visualize and see auras. Close your eyes and begin to relax your mind by gently breathing and thinking 'sooo' and 'hummm'. Once you're relaxed, dim the lights in your room and stand in front of a white background. Take a look at your hand against the white background and focus on the faint color while keeping yourself relaxed. Focus on it and the color will strengthen eventually. When the color has become more clear, you have now seen the aura. Practice on seeing the a...

This software tutorial teaches you how to use Trapcode Form, and After Effects plug-in, to visualize audio. Trapcode form is used to bend nature to your will by creating flame, smoke and other organic 3D shapes — and then synchronize it with your favorite audio. This After effects tutorial will show you how to visualize that audio in Form. Visualize audio with Trapcode Form in After Effects.

In a difficult shot in pool, the video suggests visualizing a helper or "ghost" ball to determine where to aim. The centers of the ghost ball and the object ball should be in line with the target pocket. When hit the cue ball should stop in the place of the ghost ball for a successful shot. Visualize the cue ball contact point.

This video illustrates how to use your own hand to help visualize the 90 degree rule when shooting pool and determine where the cue ball and the object ball will go, so you don't scratch. The thumb and forefinger spread out in an "L" shape will effectively predict the directions the cue ball and the object ball will take. Visualize the 90 degree rule in pool.

In this video tutorial, we learn how to create custom, particle-based visualizations for music with Trapcode Particular, Soundkeys & Adobe After Effects. Whether you're new to Adobe's popular motion graphics and compositing software, new to the Trapcode Suite or merely looking to pick up a few new tips and tricks, you're sure to be well served by this video tutorial. Take a look. Visualize music with Trapcode Particular, Soundkeys & Adobe After Effects.
The new Pyro FX in Houdini 10 are very impressive with improved workflow. The Pyro FX are great for creating 3D fire and smoke effects. And in this video tutorial series, you will learn the Pyro FX workflow in-depth and the parameters used to create fire and smoke effects. You will also see how volumetric data is created and recorded, and how to visualize it.
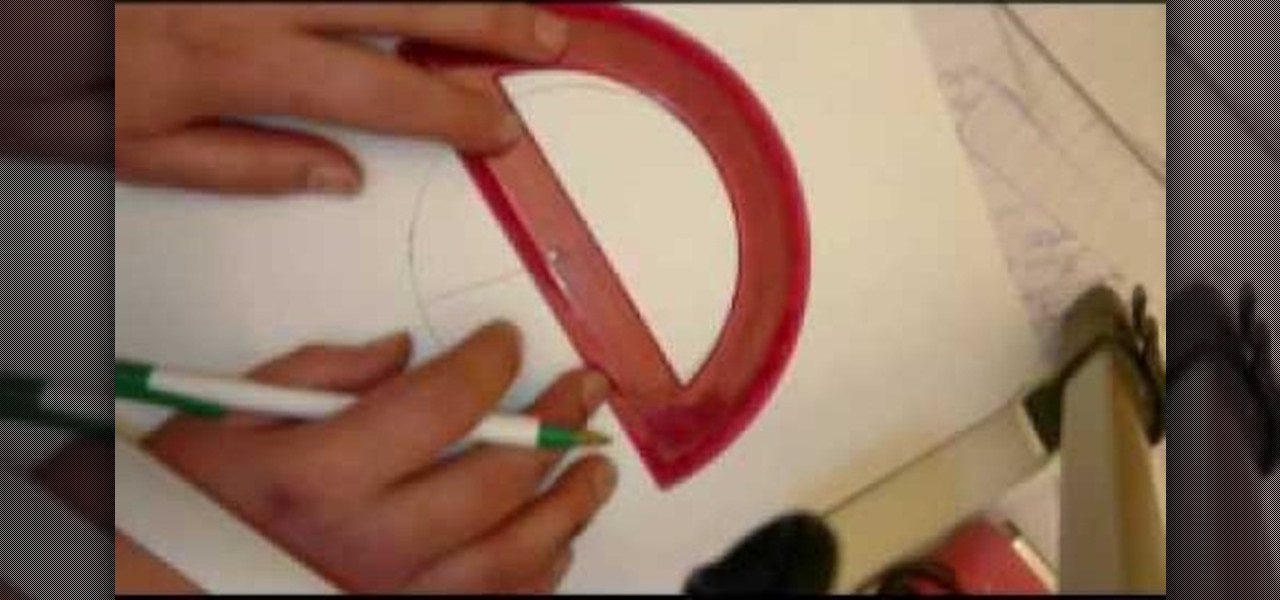
If you have a circular or semicircular protractor like the one used in this video, making a pie chart is as easy as – well — pie. This will teach you how to use your protractor to measure out each individual slice in your pie chart. Learn how to visualize statistical data through hand-drawn pie charts with this free video math lesson.
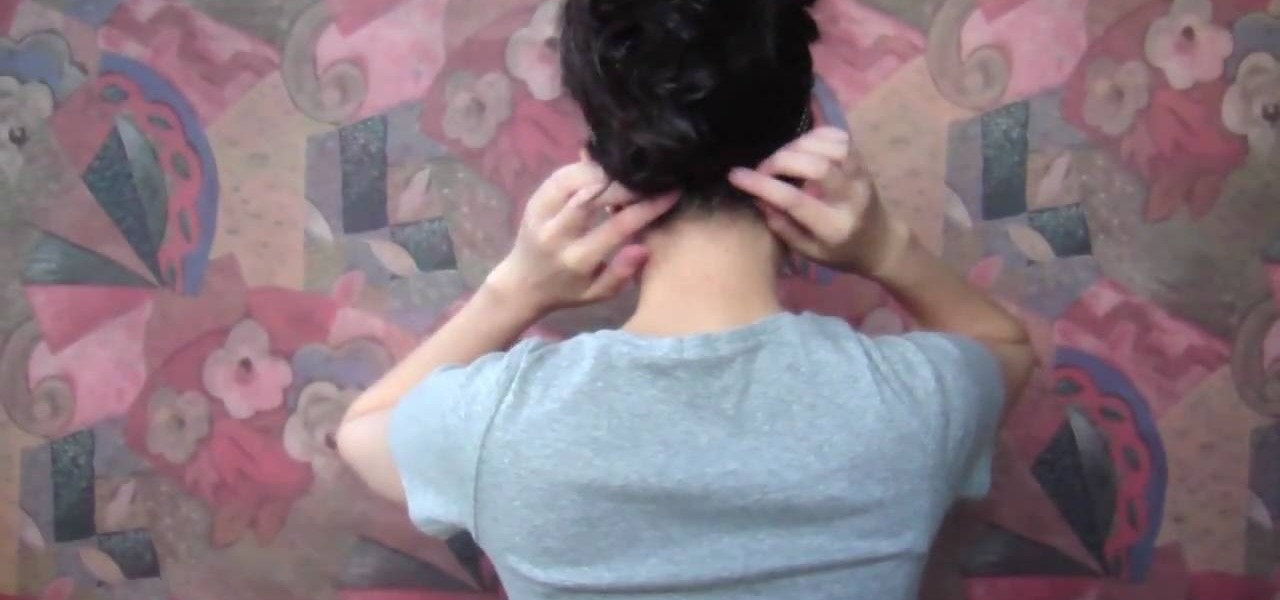
This hair tutorial is called a wispy bird's nest after its, well, wispy quality and organized jumble of hair strands that forms into a cohesive whole.
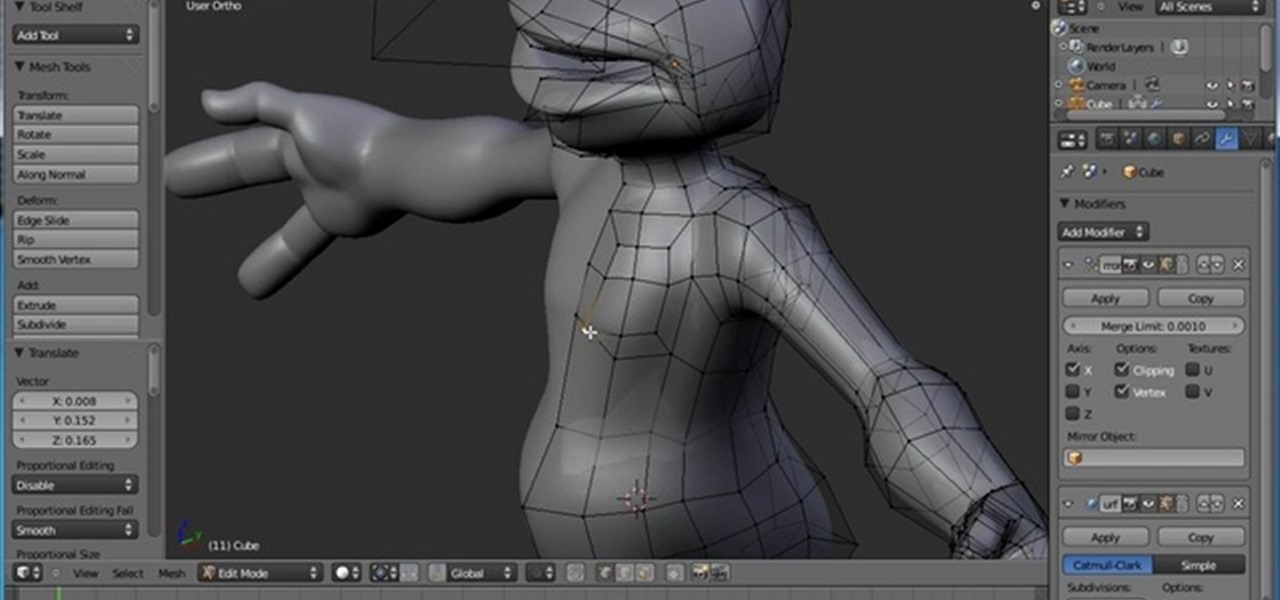
This clip demonstrates how to use the box-modeling technique to create a full character. The box-modeling technique is a good way to quickly visualize the shape of your character, rather than a creating the detail from the beginning. Whether you're new to the Blender Foundation's popular open-source 3D computer graphics application or are a seasoned digital artist merely on the lookout for new tips and tricks, you're sure to be well served by this free video software tutorial from the folks a...
This exercise tutorial is the very definition of the statement, "no pain, no gain." Along with completing challenging cardio and strength training routines like jumping jacks and push-ups, you absolutely MUST moniter your diet in order to see fat burning results. Here are a few food habits you need to keep in mind:

Pixel Perfect is the "perfect" show to help you with your Photoshop skills. Be amazed and learn as master digital artist Bert Monroy takes a stylus and a digital pad and treats it as Monet and Picasso do with oil and canvas. Learn the tips and tricks you need to whip those digital pictures into shape with Adobe Photoshop and Illustrator. In this episode, Ben shows you how to create realistic reflections in Photoshop.

Interested in chakras? Boost the seven energy centers from the base of your spine to the top of your head for optimum health and vitality. Learn how to awaken chakras with help from this video.

Hypnotizing yourself may seem like a magic trick, but is actually a great way to manage your stress or change a habit.

Awakening the sixth chakra – known as the third eye – also awakens your sixth sense, and unlocks psychic potential. In this tutorial, learn how to harness your spirituality and get in touch with your third eye.
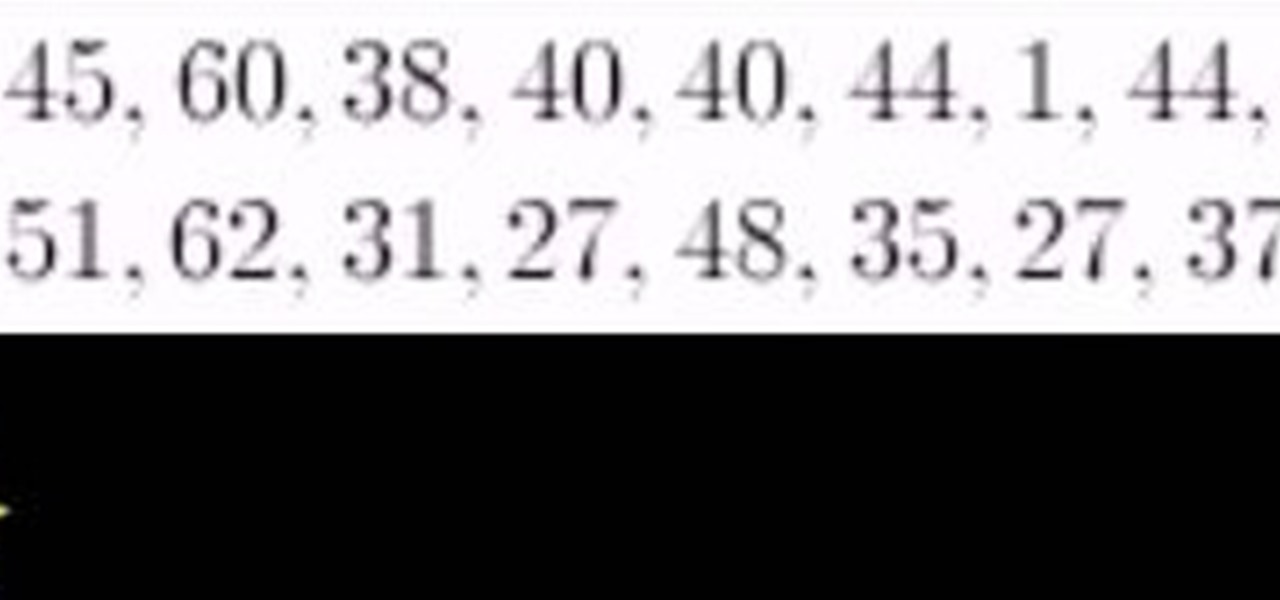
From Ramanujan to calculus co-creator Gottfried Leibniz, many of the world's best and brightest mathematical minds have belonged to autodidacts. And, thanks to the Internet, it's easier than ever to follow in their footsteps. With this installment from Internet pedagogical superstar Salman Khan's series of free math tutorials, you'll learn how to visualize statistical data with a hand-drawn stem-and-leaf chart.
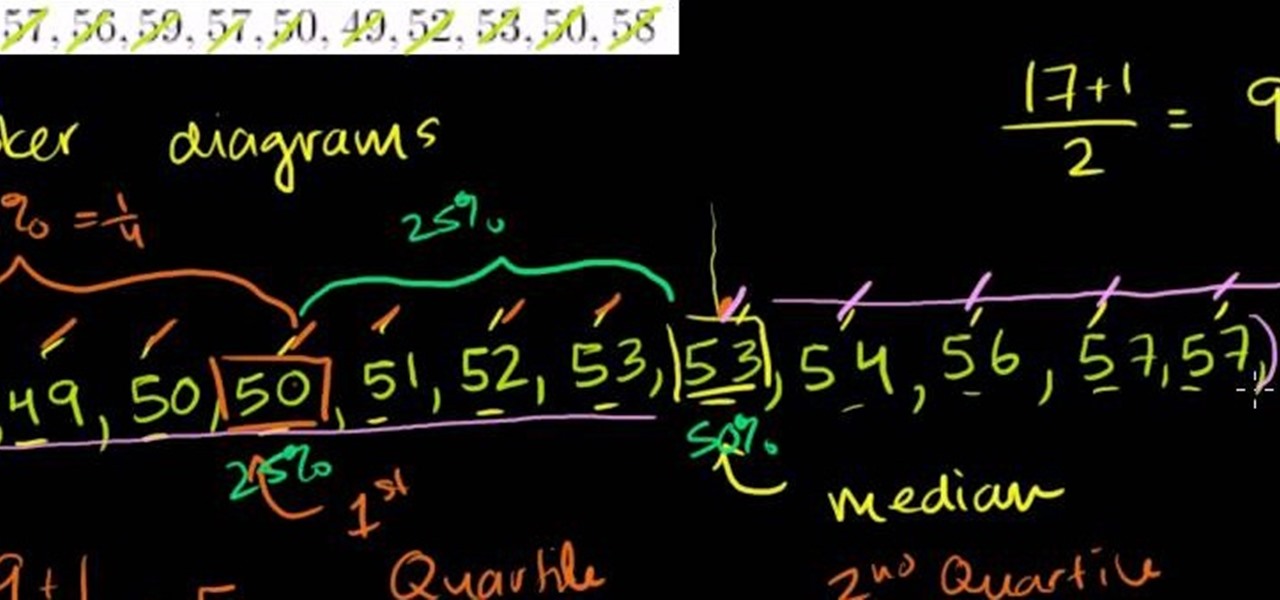
From Ramanujan to calculus co-creator Gottfried Leibniz, many of the world's best and brightest mathematical minds have belonged to autodidacts. And, thanks to the Internet, it's easier than ever to follow in their footsteps (or just study for that next big test). With this installment from Internet pedagogical superstar Salman Khan's series of free statistics tutorials, you'll learn how to use visualize data by graphing it in a box-and-whisker diagram.
Mike Tadros demonstrates some useful techniques for incorporating the Space Navigator by 3D Connexion into your Google SketchUp workflow. Create smooth animations, pre-visualize motion graphics sequences, and even create a Star Wars flight simulation. All possible with the Space Navigator for SketchUp 6.

Although all signs points to Microsoft releasing a new HoloLens in the coming days, the company is nevertheless looking to distribute its augmented reality apps to other operating systems.
Are you much for science? Cytoplasm. Nucleus. Endoplasmic reticulum. Organelle. These words might sound alien, but breaking down the parts of a cell and their functions will help you remember. This is one of the best ways for cell identification, and it's perfect for science class studying.
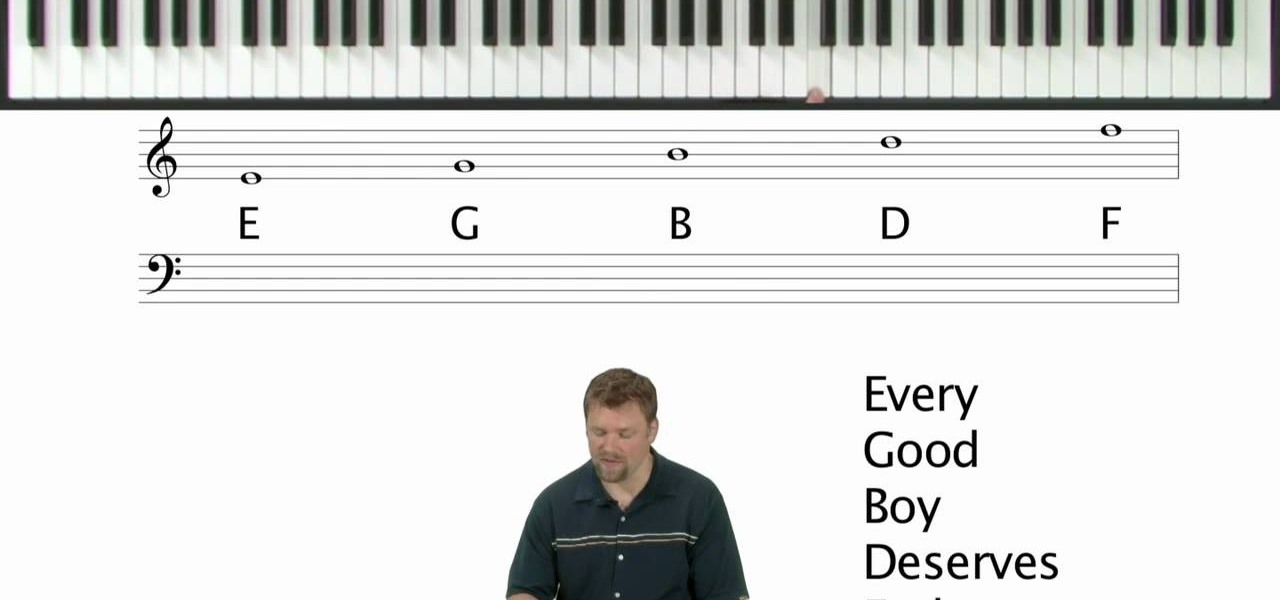
In this tutorial, we learn how to start reading sheet music for the piano. To be able to read the notes, you need to visualize what you are doing on the piano. A good starting point is the middle C on the keyboard. For a piano, you have horizontal lines in two sets on the sheet of paper. These lines are called "staffs" and the vertical lines are the "bar lines". The sections are called "measures". The top of those staffs is all the notes above the middle c. The bottom is all the notes below m...
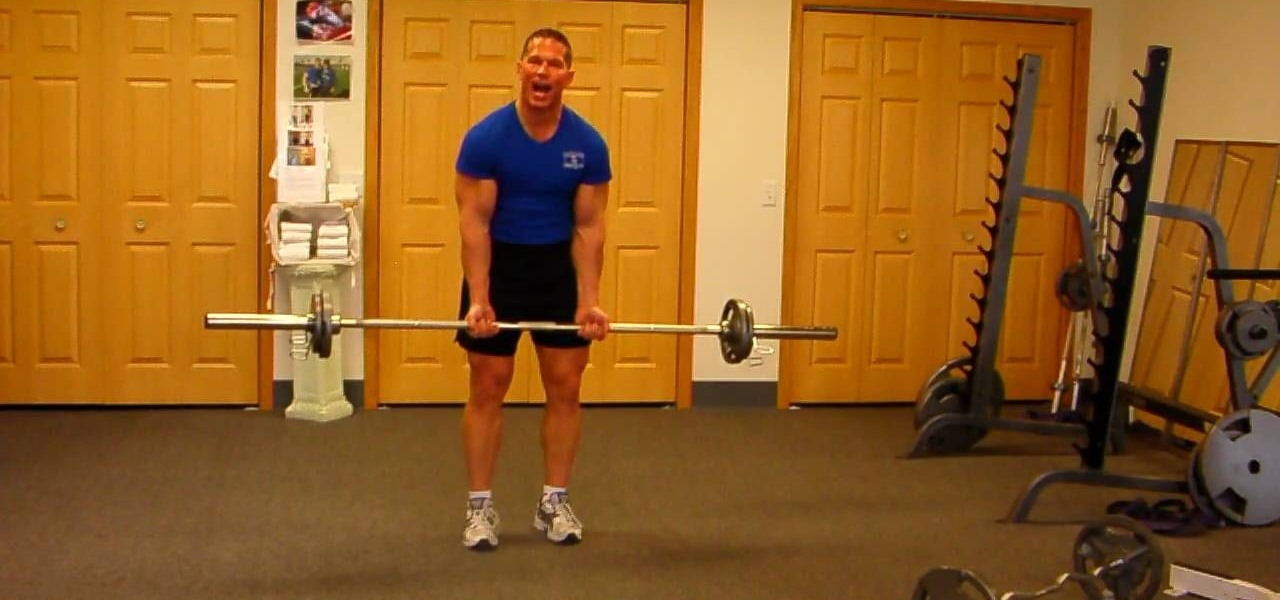
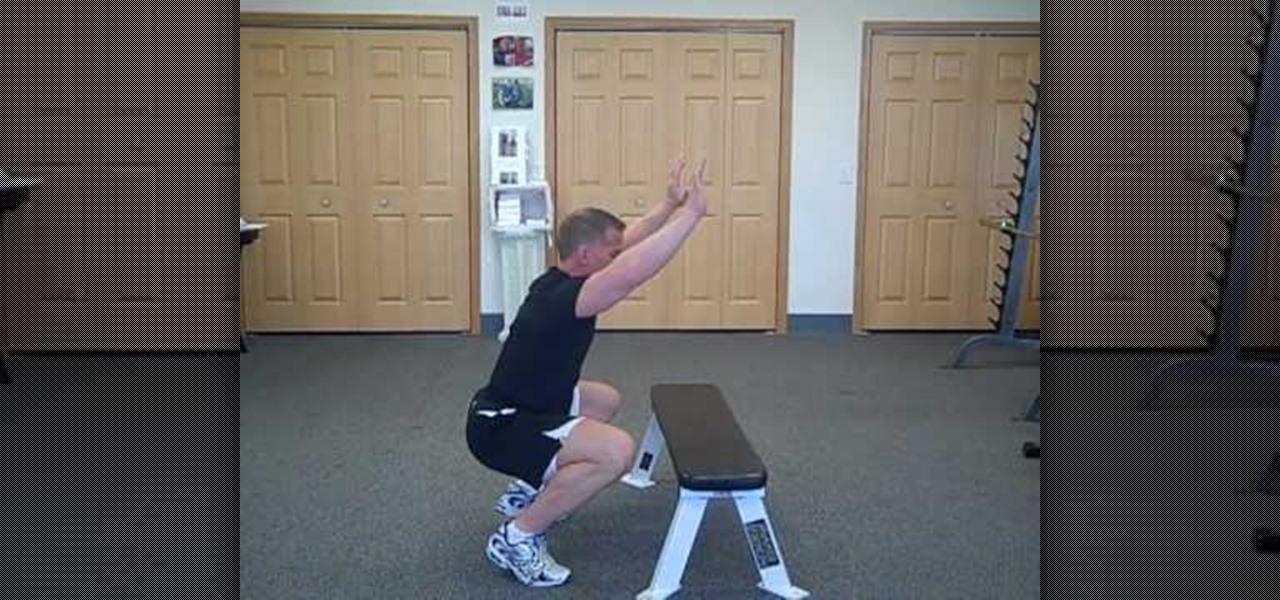
Get your straight bar and the weight that you are use to. Get the technique down before you add a bunch of weight. With the straight bar in front of you bend over and grab the bar with your hands. A narrow grab, much closer then you are use to. As you raise the bar up to your chin, visualize that you are bending the bar. The movement is as if you were scooping water up to your mouth. As your hands come up think of the pinky side of the hand coming up to your nose. Also as you do this squeeze ...

This video solves the problem of getting the right crate for your puppy. You should visualize the size of your puppy after six months and get a crate of that size. If you have a mature dog, get a crate in which the dog can move and turn around easily. The presenter recommends a plastic crate. It is designed well. The door can be opened in both directions. The top can be removed easily and there are holes for the air to come inside. The wire cage is not recommended. Its door is fixed and the c...
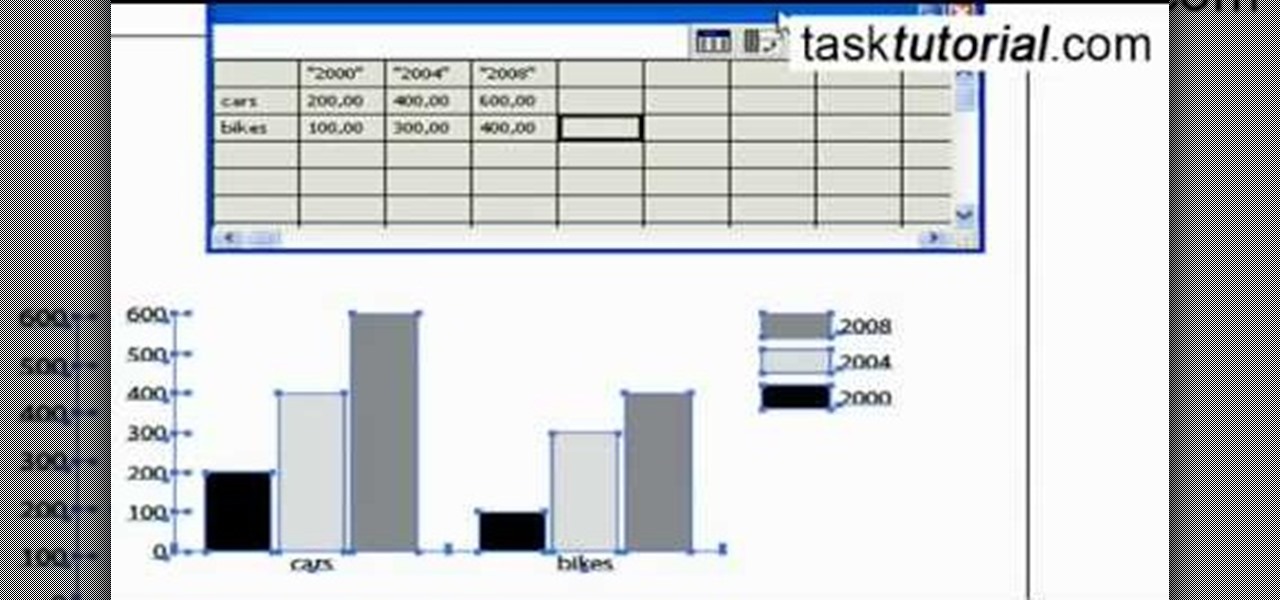
You will learn to create graphs in Illustrator. The best way to visualize data is a graph, and there are several different graph choices in this program. He chooses a column graph to show how he creates his graphs. Holding the left mouse button and dragging, he creates a rectangle which will be our graph. This brings up an input screen beside the rectangle for the graph; he puts information into the screen which shows up on the graph when he is finished.

In this video tutorial, we learn how to use the Graph Your Inbox! extension for the Google Chrome web browser to visualize Gmail usage over time. For all of the details, and to get started using Graph Your Inbox! yourself, watch this home-computing how-to from Tekzilla.

Starting a film? A storyboard is a great way to visualize a motion picture or animation through a series of illustrations or images displayed in sequence. Learn how to go about creating a storyboard in pre-production with help from this free video from EOS Lighting.
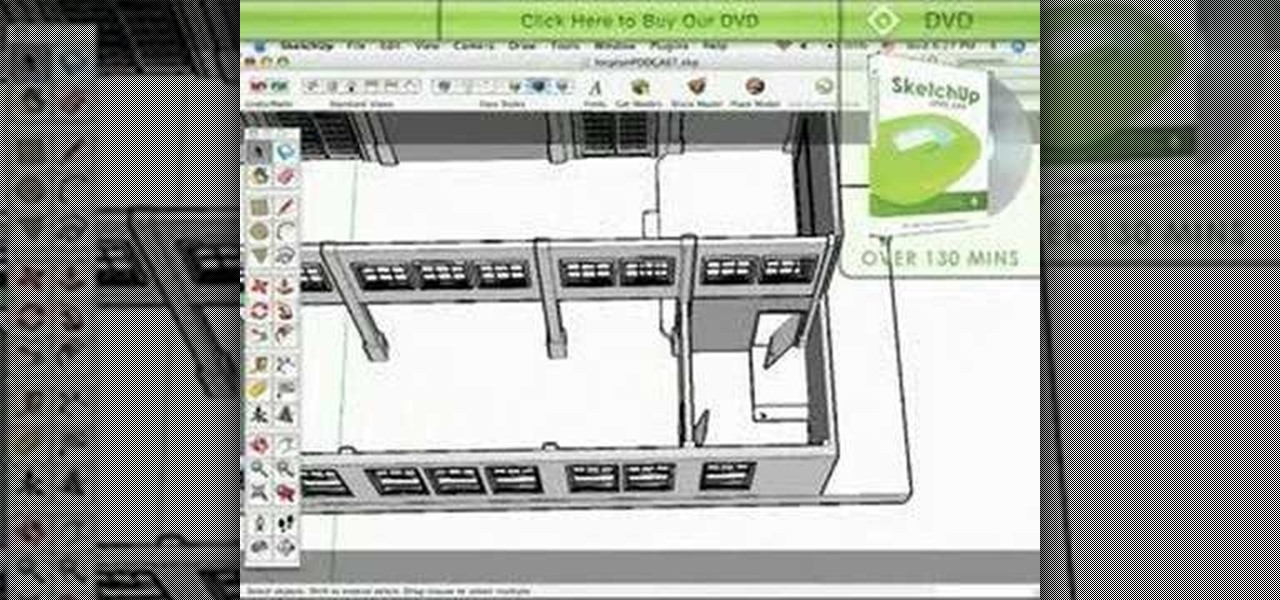
Alex Oliver demonstrates how Art Directors and Cinematographers can use the Film & Stage plugin in SketchUp to explore the use of different camera lenses and aspect ratios on location or on a production set. The Film and Stage plug-in is a great way for film makers and directors to pre-visualize shots and scenes in SketchUp, a software you may only have thought useful for architecture and product pre-visualization. Learn how to plan shots and do animatics in this SketchUp tutorial.
This is a short archery video that attempts to explain why arrow application charts are so complicated. The first three minutes or so present a model of a shaft to help visualize the independent factors that drive each section of the chart.

Oscilloscopes visualize electronic signals. This information can be useful for tests, debugging, and reverse engineering. If you work with electronic circuitry, being able to use an oscilloscope is a must have skill. Here Bre Pettis and Make Magazine hook you up with great tips.
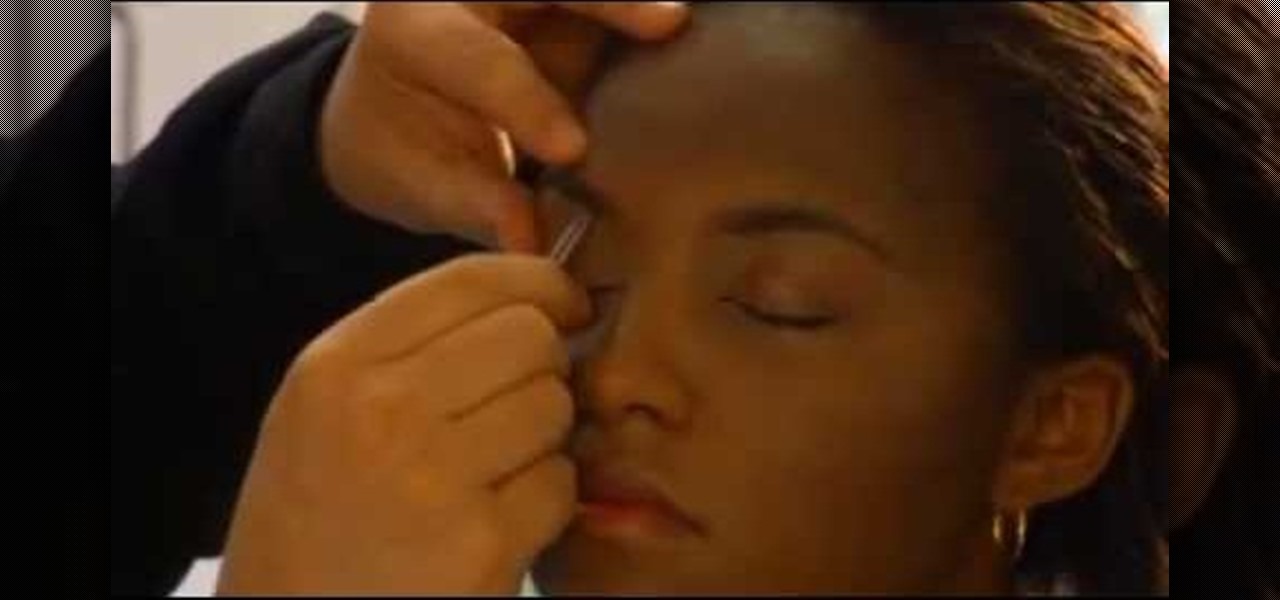
Well-shaped eyebrows will give you a sharper, sleeker look. Eyebrow guru Ramy Gafni takes us through the nuances of the art of shaping eyebrows.
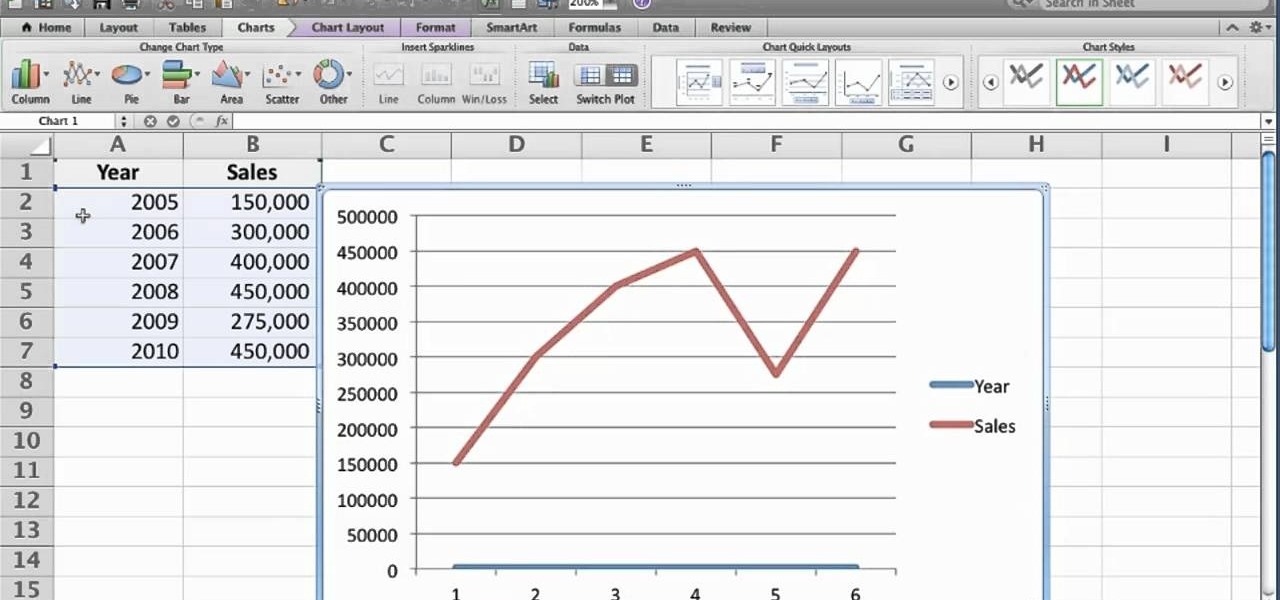
Want to generate a line chart in Excel 2011? This video will show you how it's done. Whether you're new to Microsoft's popular digital spreadsheet application, new to Excel 2011 or even an expert merely looking to brush up on the fundamentals, you're sure to be well served by this quality video tutorial from the folks at Lynda. For all of the details, and to get started creating and using line charts to visualize data in your own MS Excel '11 projects, watch the video.